| Issue |
A&A
Volume 677, September 2023
|
|
|---|---|---|
| Article Number | L3 | |
| Number of page(s) | 6 | |
| Section | Letters to the Editor | |
| DOI | https://doi.org/10.1051/0004-6361/202346373 | |
| Published online | 29 August 2023 | |
Letter to the Editor
Soft gamma-ray spectral and time evolution of the GRB 221009A: Prompt and afterglow emission with INTEGRAL/IBIS-PICsIT
INAF – Istituto di Astrofisica e Planetologia Spaziali, Via Fosso del Cavaliere 100, 00133 Roma, Italy
e-mail: This email address is being protected from spambots. You need JavaScript enabled to view it.
; This email address is being protected from spambots. You need JavaScript enabled to view it.
Received:
10
March
2023
Accepted:
28
March
2023
Abstract
Aims. The gamma-ray burst (GRB) 221009A, with its extreme brightness, has provided the opportunity to explore GRB prompt and afterglow emission behavior on short timescales with high statistics. In conjunction with detection up to very-high-energy gamma rays, studies of this event shed light on the emission processes at work in the initial phases of GRBs’ emission.
Methods. Using INTEGRAL/IBIS’s soft gamma-ray detector, PICsIT (200–2600 keV), we studied the temporal and spectral evolution during the prompt phase and the early afterglow period.
Results. We found a “flux-tracking” behavior with the source spectrum “softer” when brighter. However, the relationship between the spectral index and the flux changes during the burst. The PICsIT light curve shows that afterglow emission begins to dominate at ∼T0 + 630 s and decays with a slope of 1.6 ± 0.2, consistent with the slopes reported at soft X-rays.
Key words: gamma-ray burst: general
© The Authors 2023
 Open Access article, published by EDP Sciences, under the terms of the Creative Commons Attribution License (https://creativecommons.org/licenses/by/4.0), which permits unrestricted use, distribution, and reproduction in any medium, provided the original work is properly cited.
This article is published in open access under the Subscribe to Open model. This email address is being protected from spambots. You need JavaScript enabled to view it. to support open access publication.
1. Introduction
The long gamma-ray burst (GRB) GRB 221009A was likely the brightest GRB ever detected (Burns et al. 2023). The observation of the prompt emission was initially reported by Fermi/GBM (T0 = 13 : 17 : 00 UTC) (Veres et al. 2022). In view of the extreme GRB flux, spanning from low-energy X-rays to very high gamma rays, detections were reported by numerous instruments, including detectors not built to detect GRBs such as Gaia, SOHO (ESA 2022), Solar Orbiter (Xiao et al. 2022), CSES HPPL (Battiston et al. 2023), and others. Most of the GRB-devoted telescopes and observatories were obviously triggered, many of them with severe problems from detector dead time, pileup, and telemetry saturation: Swift/BAT (Dichiara et al. 2022); MAXI (Negoro et al. 2022); Fermi/LAT (Bissaldi et al. 2022); AGILE (Piano et al. 2022; Ursi et al. 2022); INTEGRAL (Gotz et al. 2022); Konus-Wind (Frederiks et al. 2022); Insight-HMXT (Tan et al. 2022); STPSat-6/SIRI (Mitchell et al. 2022); GECAM (Liu et al. 2022); SRG/ART-XC (Lapshov et al. 2022); and GRBAlpha (Ripa et al. 2022)). Nonetheless, the usable data from the instruments will enable studies of GRB prompt emission evolution at high time resolution and high statistics. Combined with multiwavelength afterglow detections up to TeV energies, GRB 221009A is a unique opportunity to explore numerous aspects of GRB behavior, particularly regarding the initial phase of the transition from prompt to afterglow gamma-ray emission.
In this work, we analyze the soft gamma-ray evolution of GRB 221009A in the 200 − 2600 keV energy range using the spectral-timing data provided by the IBIS/PICsIT gamma-ray telescope aboard INTErnational Gamma-Ray Astrophysics Laboratory (INTEGRAL) to study how the prompt emission varies throughout the burst. Additionally, we explored the characteristics of the afterglow emission during the prompt phase and shortly after it.
2. Observations and analysis
INTEGRAL was launched in October 2002 from Baikonur, Kazachstan (Jensen et al. 2003) in a high Earth orbit, providing long uninterrupted observations due to the ∼2.5-day elliptical orbit, resulting in an all-sky coverage for more than 85% of the operation time. With its on-board suite of instruments, INTEGRAL (Winkler et al. 2003) spans 3 keV−10 MeV with fields of view (FoVs) ranging from ∼100 − 1000 deg2. Also, the active veto shields of SPI (Vedrenne et al. 2003) and IBIS (Ubertini et al. 2003) feature large sensitive exposed area to high-energy photons and can detect impulsive events outside the FoVs of the imaging instruments with high sensitivity (von Kienlin et al. 2003; Savchenko et al. 2017).
INTEGRAL was observing XTE J1701 − 462 at the trigger time of GRB 221009A (2022 October 09 13:17:00.0 UTC) with an angle of ∼65.8° off-axis from the pointing direction. The prompt emission lasted more than 600 s, including the small precursor peak and spanned INTEGRAL observations 255800290010 − 255800300010. Beginning at 2022 October 10 13:27:56 UTC, INTEGRAL began pointed observations of the afterglow emission. Analysis and interpretation of these afterglow observations are covered in Savchenko et al. (2023). While the SPI-ACS has a higher sensitivity as a GRB monitor due to its large effective area (0.7 m2), it only has a single energy channel (> 75 keV; von Kienlin et al. 2003).
PICsIT, IBIS’s soft gamma-ray detector, covers energies from 170 keV to 10 MeV with two commonly used data types: spectral timing and spectral imaging (Labanti et al. 2003). The spectral-timing data have 7.8-ms time resolution in eight broad energy bands (200 − 2600 keV). This data type sums all the counts in all the detector pixels and thus does not have any position resolution. In contrast, the spectral-imaging data type sums the counts in each pixel over the span of an INTEGRAL pointing (∼1800 s). Using the spectral-timing data, PICsIT is able to detect impulsive events both inside and outside the FoV (Bianchin et al. 2009, 2011; Savchenko et al. 2017), though with reduced sensitivity for those outside the shielding of the IBIS walls. It is possible to account for the absorbing materials to also produce spectra (Bianchin et al. 2009; Rodi et al. 2021). For the above mentioned reasons, in this paper we focus on IBIS-PICsIT data, which provide eight broad energy channels and a higher time resolution (7.8-ms vs. 50-ms of SPI-ACS). We analyzed the observations 255800290010 − 255800300010 as part of an accepted INTEGRAL proposal to analyze the PICsIT spectral-timing data for reported GRBs.
INTEGRAL telemeters its data to the ground in real time (Winkler et al. 2003). However, the size of the on-board buffer was optimized for “standard” observations of fields, such as the Galaxy Center and Crab, and thus it is not ideal to cope with impulsive, high-flux events, due to the limited bandwidth available at the time of the satellite design and construction. Thus periods of a very high count rate (e.g., GRBs in the FoV) can result in buffer overflows and data gaps for on-board instruments. To remove such bad time intervals (BTIs), we removed periods with three or more time bins missing. Additionally we searched for detector saturation. No time bins were found at or near the maximum possible value allowed by the dedicated telemetry space, indicating that PICsIT did not suffer from pile-up effects during the burst.
3. Results
3.1. Temporal evolution
GRB 221009A began with a precursor at 13:17:00 UTC. Figure 1 shows the 200 − 1200 keV PICsIT light curve on a 500-ms time resolution. A dashed line denotes T0 (T0 = 13:17:00 UTC). The precursor is shown in an inset to better show the behavior. The feature shows a fast rise with an exponential decay lasting for approximately 7 s. No other significant emission was detected in PICsIT until ∼T0 + 177 s. Subsequently, Pulse 1 (∼T0 + 177 − 205 s) started, peaked around 11 000 cts s−1, and decayed to ∼5000 cts s−1 after which a subflare began (peak ∼7000 cts s−1) and then further decayed to a low interpulse flux at ∼T0 + 210 s.
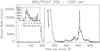 |
Fig. 1. Time evolution of the background-subtracted PICsIT light curve of GRB 202909A in the energy range 200 − 1200 keV. Each time bin was integrated over 500-ms to increase the statistics and avoid empty time bins. The dashed line corresponds T0 = 13:17:0 UTC, when the precursor was clearly detected by IBIS-PICsIT. The inset shows the precursor with 200-ms time resolution. |
Then Pulse 2 (∼T0 + 210 − 252 s) began, increasing from an interpulse level of ∼1000 cts s−1 to ∼21 000 cts s−1 in the span of ∼8 s, after which the PICsIT data suffered from telemetry issues from ∼T0 + 220 s. Thus the peak of the flare was not detected with PICsIT. The gap ended at approximately T0 + 243 s with a PICsIT count rate of ∼19 000 cts s−1. After which the GRB flux rapidly decreased to ∼15 000 cts s−1 before a more gradual decrease until roughly T0 + 252 s.
Pulse 3 (∼T0 + 252 − 320 s) began with a fast increase (∼8500 to ∼20 000 cts s−1). Much of the Pulse 3 rise overlapped with the decay of Pulse 2 and thus was not observed. PICsIT again had telemetry issues at ∼T0 + 255 s and was unable to monitor the peak behavior until T0 + 268 s when the flux began to decrease from a level of ∼19 500 cts s−1 to a few 100 cts s−1. This was followed by an interpulse period until approximately T0 + 380 s.
Pulse 4 (∼T0 + 380 − 600 s) commenced with a comparatively low flux shoulder-like feature that slowly varied between ∼500 and 2000 cts s−1 until roughly T0 + 495 s. On top of this feature several subflares occurred, lasting ∼5 − 10 s with count rates near 4000 cts s−1 at their peaks. After ∼T0 + 495 s, the flux dramatically increased to a peak of approximately 20 000 cts s−1 in ∼15 s with multiple subflares present during the rise. The pulse peaked before the flux decreased to roughly 10 000 cts s−1 in approximately 5 s and then decayed gradually until ∼T0 + 550 s after which the shoulder-like feature continued for roughly 50 s more. The results after T0 + 1000 s are discussed in Savchenko et al. (2023) as part of the INTEGRAL afterglow follow-up observations.
We investigated the hardness ratio (HR) evolution, defined as the count rate (200 − 312 keV/570 − 1200 keV), during the four pulses. Their evolution and corresponding HR are shown in Fig. 2, where a dashed line is drawn at HR = 0.5 for reference. The evolution of the normalization at 300 keV and the photon index (Γ) are also shown and discussed in detail in Sect. 3.2. GRB 221009A showed an evolution of hardness throughout the pulses with generally higher HR values (softer) at higher fluxes and lower HR values (harder) at lower fluxes. However, some variability was present during the interpulse periods due to the relatively low count rate possibly generating statistical fluctuations.
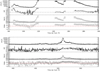 |
Fig. 2. GRB 221009A 200 − 1200 keV PICsIT light curve with the corresponding hardness ratio HR = (200 − 312 keV)/(570 − 1200 keV), normalization at 300 keV (ph cm−2 s−1 keV−1), and photon index to power-law fits. The black dashed line denotes HR = 0.5 for reference, and the red dashed line is at an index of 1.75 for reference. |
For Pulse 1, much of the data during the rise phase were missing due to a telemetry gap. Thus the existing data show predominately the peak and decay behavior with the hardness evolving from ∼1.1 at the peak to ∼0.3 just before the interpulse phase.
Pulse 2 shows a more complicated behavior. During the rise, the hardness began at roughly 0.5 and increased to nearly 1.2 as the flux increased before the data gap. In contrast, the dip showed a near constant hardness at ∼0.5 as the flux decreased, followed by a sharp increase in both hardness and flux (the beginning of Pulse 3) before flattening at HR ∼0.6 prior to the next data gap. When the decay phase of Pulse 3 started, the hardness was approximately 0.7 and decreased to a value of roughly 0.5 before beginning the interpulse period between Pulses 3 and 4.
Pulse 4 behaved differently from the prior three. Starting from T0 + 400 s, the HR varied from ∼0.2 to 0.4. After the HR increased from ∼0.4 to ∼0.6, it peaked at nearly 0.75 at the peak of the pulse. During the decay phase, the hardness decreased to roughly 0.6 and remained nearly constant until T0 + 540 s when the HR continued to decrease. However, there were large variations in the behavior as the flux decreased until the afterglow began at roughly T0 + 600 s.
3.2. Spectral evolution
Expanding on the HR evolution analysis, we fit the PICsIT data in seven channels spanning 250 − 2600 keV using 0.5-s integration throughout to study the changes in the spectral parameters. We found that the spectra are adequately fit with a power-law model and did not require a high-energy cutoff. The evolutions of the normalization at 300 keV in ph cm−2 s−1 keV−1 and the photon index (Γ) are shown in Fig. 2, as mentioned above.
In agreement with the results from HR evolution, there is a general trend of an increasing photon index with increasing flux. Pulse 1 showed an increase from Γ ∼ 1.7 at ∼T0 + 180 s prior to the gap and indexes of approximately 2.3 at the peak of the pulse. After which, Γ decreased to roughly 1.4 during the interpulse period at ∼T0 + 207 s.
Subsequently, the photon index during the Pulse 2 rise rapidly increased to ∼2.4 prior to the gap at ∼T0 + 220 s where the values flattened while the normalization showed an increase, though they are consistent with a constant value. Post-gap Γ gradually decreased before increasing to Γ ∼ 2.2 during the rise of Pulse 3 when the next gap began. When the data restarted, the photon index was at a similar value and gradually decreased to roughly two.
Following the next interpulse period at ∼T0 + 400 s, Γ remains ∼1.6 until approximately T0 + 450 s, though with a large amount of scatter due to the low flux. Next, Γ slowly varied between ∼1.6 and ∼1.9 until roughly T0 + 480 s after which the photon index was constant at approximately 1.75 for nearly 20 s. Then as the flux increased rapidly, Γ increased to ∼2.1 at approximately T0 + 511 s when the pulse peaked. During the decay phase, the normalization dropped by a factor of roughly three with only a small decrease in photon index (Γ ∼ 2). After ∼T0 + 515 s, the flux plateaued for roughly 10 s with the photon index being constant before decreasing exponentially until ∼T0 + 560 s while Γ decreased from roughly 1.9–1.5. After this, the normalization and photon index behaved similarly to the period during ∼T0 + 400 − 450 s.
4. Discussion
4.1. Prompt emission
As seen in Fig. 2, the spectral behavior and flux show correlated behavior. Similar behavior was reported by An et al. (2023) during from T0 + 180 − 300 s (though with a Band model) and has been found in approximately two-thirds of multipulse GRBs studied by Li et al. (2021). In the case of GRB 221009A, we found that the relationship between the flux and photon index changes throughout and between the pulses. Figure 3 shows the different behavior in the rise and decay of the pulses with power-law fits to each phase.
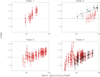 |
Fig. 3. Evolution of the photon index with flux during the rise (black) and decay (red) for the four pulses. A dashed line is plotted at a photon index of two for reference. |
The fit to the Pulse 1 decay found a slope of 0.14 ± 0.02 and a normalization of 1.00 ± 0.03. However, the lack of rise data means it is not possible to compare the two phases. Pulse 2 shows a similar but significantly different slope between the rise and decay with values of 0.07 ± 0.01 and 0.09 ± 0.01, respectively, but the two have noticeably different normalizations (0.89 ± 0.01 vs. 0.79 ± 0.01). Both slopes are significantly lower than the slope and normalization of the Pulse 1 decay.
Due to the brevity of the Pulse 3 rise, we studied only the decay phase. Its behavior is more complicated than the previous two pulses. The fit has a slope of 0.051 ± 0.006 and a normalization of 0.08 ± 0.02, which is flatter than both Pulses 1 and 2, but with a normalization comparable to the Phase 2 decay. However, the data show a possible flattening behavior below ∼0.25 ph cm−2 s−1 keV−1.
The Pulse 4 behavior rise has a slope of 0.08 ± 0.01 and normalization of 0.83 ± 0.02 comparable to Pulse 2. In contrast, the Pulse 4 decay behavior is similar to the Pulse 3 decay (slope of 0.051 ± 0.01 and normalization of 0.81 ± 0.01) with the data below roughly 0.25 ph cm−2 s−1 keV−1, again apparently flattening to nearly constant. Thus the spectral evolution of the pulses changes throughout the prompt emission, though some phases of the later pulses show similar behavior.
PICsIT’s spectral-timing data’s limited energy range makes direct comparisons with instruments that extend to lower energies difficult if there is spectral curvature, as is reported by GRBAlpha (Ripa et al. 2023), Konus-Wind (Frederiks et al. 2023), and GECAM (An et al. 2023). However, AGILE/MCAL found that the data from T0 + 181.00 − 194.03 s are well fit by a power law of Γ = 2.07 ± 0.04 (Ursi et al. 2022). While PICsIT does not have data for the period during the early portion of that time period, Fig. 2 shows similar values.
Yang et al. (2023) performed a time-resolved spectral analysis of the prompt emission using GECAM-C in the 6 keV–6 MeV energy range. They fit the spectra to a physical model assuming a synchrotron emission origin. The PICsIT data have a limited energy range, preventing us from performing the same data analysis, but we can compare the time-evolution trends with our results.
Regardless, the Yang et al. (2023) results show a strong flux-tracking behavior for the power-law index of the injection rate (q) during Pulse 2. (They do not present any results during Pulse 1). The behavior during Pulse 3 has an increase in q with flux, though the correlation is less clear than for Pulse 2. Unfortunately, much of the lack of correlation occurs during the gap in the PICsIT data so a direct comparison is not possible. Also, the Pulse 3 analysis in Yang et al. (2023) ends at ∼T0 + 272, and thus we are not able to compare the later Pulse 3 decay behavior that suggests little to no flux correlation. During Pulse 4, no significant flux-tracking is present in Yang et al. (2023). While q is highest during the peak, the errors are large during the results shown (∼T0 + 500 − 520 s). Overall, it is worth mentioning that the PICsIT results in Fig. 3 are consistent with those from Yang et al. (2023). Thus our data are consistent with their interpretation of a synchroton-emission origin from an expanding emission region and a decaying global magnetic field and therefore a jet which is Poynting-flux dominated.
4.2. Afterglow emission
A detailed analysis of afterglow observations with INTEGRAL data after T0 + 1000 s is provided in Savchenko et al. (2023). However, An et al. (2023) report that afterglow emission begins after T0 + 225 s while the prompt emission is still present. To search for the presence of afterglow emission prior to T0 + 600 s, we fit the PICsIT light curve to a power law (N(t)∝t−α) from T0 + 600 − 900 s, following An et al. (2023) and found a best-fit index of α = 3.91 ± 0.01, which is shown as the green dot-dashed line in Fig. 4. This is significantly different than 0.88 from An et al. (2023) (dashed blue line in Fig. 4).
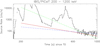 |
Fig. 4. GRB 221009A 200 − 1200 keV PICsIT light curve. The power-law best-fit slope to the data from T0 + 600 − 900 s has a slope of 3.91 and is shown in green. The best-fit to the data from T0 + 630 − 900 s gives an index of 1.6, which is shown as the red line. The blue dashed line is the power-law best-fit slope from An et al. (2023) for T0 + 600 − 900 in the 600 − 3000 keV energy range and has a slope of 0.88. |
An inspection of the PICsIT light curve (Fig. 4) shows that the An et al. (2023) slope begins to over-predict the observed flux at approximately T0 + 900 s. In contrast, the 3.91 slope under-predicts the observed flux above ∼T0 + 800 s, requiring a break to describe the decay at later times. An et al. (2023) report a break at T0 + 1125 s, well before what is required for either slope based on the PICsIT data. Additionally, the 3.91 slope significantly over-predicts the observed flux between ∼T0 + 300 − 380 s. Thus a start time of T0 + 600 s for when the afterglow emission begins to dominate is not consistent with the PICsIT data.
The PICsIT light curve shows significantly different slopes at T0 + 600 s and T0 + 700 s, indicating that the afterglow emission begins to dominate between these times. While a precise start time of when the afterglow emission begins to dominate is difficult to determine using the PICsIT light curve, we tested several start times requiring the extrapolated flux to not exceed the observed flux prior to T0 + 225 s. We found T0 + 630 s as an approximate start time when the light curve decay had a slope of α = 1.6 ± 0.2 (solid red line). This slope is similar to the T0 + 1350 − 1860 s fit of 1.89 ± 0.07 from An et al. (2023) and consistent with the soft X-ray slopes of ∼1.5 (O’Connor et al. 2023; Williams et al. 2023) and the soft gamma-ray slope (∼1.78) from Savchenko et al. (2023).
Spectral analysis by An et al. (2023) found a power-law spectrum with an index of 1.62 in the 600 − 3000 keV energy range with Insight-HMXT using HE/CsI during T0 + 630 − 930 s. Analysis of GECAM > 200 keV had a spectral index of Γ = 1.56 ± 0.16 during the same time period (An et al. 2023). We found that the PICsIT data during the same period are unable to constrain a photon index. Interestingly, the photon indexes are also consistent with the values from PICsIT during T0 + 400 − 450 s and T0 + 550 − 600 s, surrounding Pulse 4 when the spectrum softens. These spectra are also significantly harder than the spectra seen during Pulses 1, 2, and 3, suggesting the emission at these later, fainter periods are different from the brighter periods.
5. Conclusions
In conclusion, the study of GRB 221009A spectral evolution in the 200 − 2600 keV energy range using the PICsIT spectral-timing data shows that the prompt emission has a flux-tracking behavior with the PICsIT power-law indexes evolving in a correlated way with the GRB flux. Similar behavior was reported by Yang et al. (2023). They interpret the spectral evolution as synchrotron emission with an expending emission region and a decaying global magnetic field without the need for photospheric emission.
An investigation of the photon index-flux correlation for each pulse and the rise and decay phase (where the data are present) showed that the relationship varies across pulses and sometimes between the rise and decay phases of the same pulse. Additionally, the strength of the correlation appears to weaken as the prompt emission progresses with decay phases of Pulses 3 and 4 showing little to no correlation at low fluxes (< 0.25 ph cm−2 s−1 keV−1).
Lastly, we searched for the presence of afterglow emission in the PICsIT data prior to T0 + 600 s, finding the afterglow emission dominates after ∼T0 + 630 s and decays with a slope of 1.6 ± 0.2 until at least T0 + 900 s. Also, this decay index is consistent with those seen at soft X-rays prior to T0 + 79 000 s.
Acknowledgments
We thank the anonymous referee for their comments and suggestions. The authors thank the Italian Space Agency for the financial support under the “INTEGRAL ASI-INAF” agreement no 2019-35-HH.0. The research leading to these results has received funding from the European Union’s Horizon 2020 Programme under the AHEAD2020 project (grant agreement n. 871158).
References
- An, Z. H., Antier, S., Bi, X. Z., et al. 2023, Nat. Sci., submitted [arXiv:2303.01203] [Google Scholar]
- Battiston, R., Neubüser, C., Follega, F. M., et al. 2023, ApJ, 964, L29 [NASA ADS] [CrossRef] [Google Scholar]
- Bianchin, V., Foschini, L., Di Cocco, G., et al. 2009, AdSpR, 43, 1055 [NASA ADS] [Google Scholar]
- Bianchin, V., Mereghetti, S., Guidorzi, C., et al. 2011, A&A, 536, A46 [NASA ADS] [CrossRef] [EDP Sciences] [Google Scholar]
- Bissaldi, E., Omodei, N., Kerr, M., et al. 2022, GRB Coordinates Network, Circular Service, 32637 [Google Scholar]
- Burns, E., Svinkin, D., Fenimore, E., et al. 2023, ApJ, 946, L31 [NASA ADS] [CrossRef] [Google Scholar]
- Dichiara, S., Gropp, J. D., Kennea, J. A., et al. 2022, ATel, 15650 [Google Scholar]
- ESA 2022, https://www.esa.int/ESA_Multimedia/Images/2022/10/ESA_spacecraft_catch_the_brightest_ever_gamma-ray_burst [Google Scholar]
- Frederiks, D., Lysenko, A., Ridnaia, A., et al. 2022, GRB Coordinates Network, Circular Service, 32668 [Google Scholar]
- Frederiks, D., Svinkin, D., Lysenko, A. L., et al. 2023, ApJ, 949, L7 [NASA ADS] [CrossRef] [Google Scholar]
- Gotz, D., Mereghetti, S., Savchenko, V., et al. 2022, GRB Coordinates Network, Circular Service, 32660 [Google Scholar]
- Jensen, P. L., Clausen, K., Cassi, C., et al. 2003, A&A, 411, L7 [NASA ADS] [CrossRef] [EDP Sciences] [Google Scholar]
- Labanti, C., Di Cocco, G., Ferro, G., et al. 2003, A&A, 411, L149 [NASA ADS] [CrossRef] [EDP Sciences] [Google Scholar]
- Lapshov, I., Molkov, S., Mereminsky, I., et al. 2022, GRB Coordinates Network, Circular Service, 32663 [Google Scholar]
- Li, L., Ryde, F., Pe’er, A., et al. 2021, ApJS, 254, 35 [NASA ADS] [CrossRef] [Google Scholar]
- Liu, J. C., Zhang, Y. Q., Xiong, S. L., et al. 2022, GRB Coordinates Network, Circular Service, 32751 [Google Scholar]
- Mitchell, L. J., Phlips, B. F., & Johnson, W. N. 2022, GRB Coordinates Network, Circular Service, 32746 [Google Scholar]
- Negoro, H., Nakajima, M., Kobayashi, K., et al. 2022, ATel, 15651 [Google Scholar]
- O’Connor, B., Troja, E., Ryan, G., et al. 2023, Sci. Adv., 9, eadi1405 [CrossRef] [Google Scholar]
- Piano, G., Verrecchia, F., Bulgarelli, A., et al. 2022, GRB Coordinates Network, Circular Service, 32657 [Google Scholar]
- Ripa, J., Pal, A., Werner, N., et al. 2022, GRB Coordinates Network, Circular Service, 32685 [Google Scholar]
- Ripa, J., Takahashi, H., Fukazawa, Y., et al. 2023, A&A, 677, L2 [CrossRef] [EDP Sciences] [Google Scholar]
- Rodi, J., Ubertini, P., Bazzano, A., et al. 2021, 43rd COSPAR Scientific Assembly, Held 28 January - 4 February [Google Scholar]
- Savchenko, V., Bazzano, A., Bozzo, E., et al. 2017, A&A, 603, A46 [NASA ADS] [CrossRef] [EDP Sciences] [Google Scholar]
- Savchenko, V., Bazzano, A., Ubertini, P., et al. 2023, A&A, submitted [NASA ADS] [CrossRef] [EDP Sciences] [Google Scholar]
- Tan, W. J., Li, C. K., Ge, M. Y., et al. 2022, ATel, 15660 [Google Scholar]
- Ubertini, P., Lebrun, F., Cocco, G. D., et al. 2003, A&A, 411, L139 [Google Scholar]
- Ursi, A., Panebianco, G., Pittori, C., et al. 2022, GRB Coordinates Network, Circular Service, 32650 [Google Scholar]
- Vedrenne, G., Roques, J.-P., Schönfelder, V., et al. 2003, A&A, 411, L63 [CrossRef] [EDP Sciences] [Google Scholar]
- Veres, P., Burns, E., Bissaldi, E., et al. 2022, GRB Coordinates Network, Circular Service, 32636 [Google Scholar]
- von Kienlin, A., Beckmann, V., Rau, A., et al. 2003, A&A, 411, L299 [NASA ADS] [CrossRef] [EDP Sciences] [Google Scholar]
- Williams, M. A., Kennea, J. A., Dichiara, S., et al. 2023, ApJ, 946, L24 [NASA ADS] [CrossRef] [Google Scholar]
- Winkler, C., Courvoisier, T. J.-L., Di Cocco, G., et al. 2003, A&A, 411, L1 [NASA ADS] [CrossRef] [EDP Sciences] [Google Scholar]
- Xiao, H., Krucker, S., & Daniel, R. 2022, GRB Coordinates Network, Circular Service, 32661 [Google Scholar]
- Yang, J., Zhao, X. H., Yan, Z., et al. 2023, ApJ, 947, L11 [NASA ADS] [CrossRef] [Google Scholar]
All Figures
|
Fig. 1. Time evolution of the background-subtracted PICsIT light curve of GRB 202909A in the energy range 200 − 1200 keV. Each time bin was integrated over 500-ms to increase the statistics and avoid empty time bins. The dashed line corresponds T0 = 13:17:0 UTC, when the precursor was clearly detected by IBIS-PICsIT. The inset shows the precursor with 200-ms time resolution. |
| In the text | |
|
Fig. 2. GRB 221009A 200 − 1200 keV PICsIT light curve with the corresponding hardness ratio HR = (200 − 312 keV)/(570 − 1200 keV), normalization at 300 keV (ph cm−2 s−1 keV−1), and photon index to power-law fits. The black dashed line denotes HR = 0.5 for reference, and the red dashed line is at an index of 1.75 for reference. |
| In the text | |
|
Fig. 3. Evolution of the photon index with flux during the rise (black) and decay (red) for the four pulses. A dashed line is plotted at a photon index of two for reference. |
| In the text | |
|
Fig. 4. GRB 221009A 200 − 1200 keV PICsIT light curve. The power-law best-fit slope to the data from T0 + 600 − 900 s has a slope of 3.91 and is shown in green. The best-fit to the data from T0 + 630 − 900 s gives an index of 1.6, which is shown as the red line. The blue dashed line is the power-law best-fit slope from An et al. (2023) for T0 + 600 − 900 in the 600 − 3000 keV energy range and has a slope of 0.88. |
| In the text | |
Current usage metrics show cumulative count of Article Views (full-text article views including HTML views, PDF and ePub downloads, according to the available data) and Abstracts Views on Vision4Press platform.
Data correspond to usage on the plateform after 2015. The current usage metrics is available 48-96 hours after online publication and is updated daily on week days.
Initial download of the metrics may take a while.