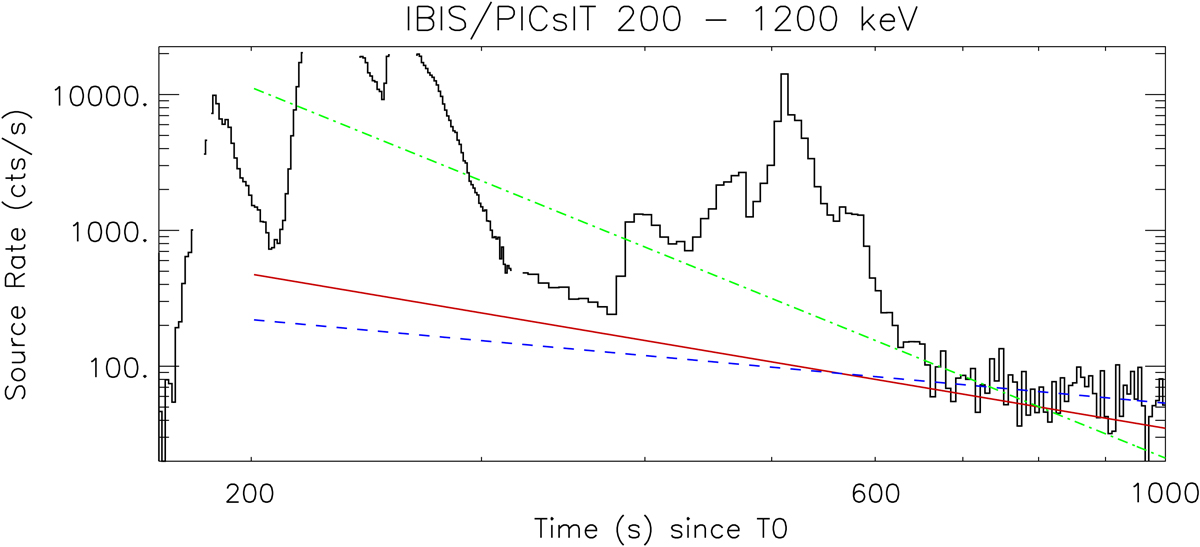
Fig. 4.
Download original image
GRB 221009A 200 − 1200 keV PICsIT light curve. The power-law best-fit slope to the data from T0 + 600 − 900 s has a slope of 3.91 and is shown in green. The best-fit to the data from T0 + 630 − 900 s gives an index of 1.6, which is shown as the red line. The blue dashed line is the power-law best-fit slope from An et al. (2023) for T0 + 600 − 900 in the 600 − 3000 keV energy range and has a slope of 0.88.
Current usage metrics show cumulative count of Article Views (full-text article views including HTML views, PDF and ePub downloads, according to the available data) and Abstracts Views on Vision4Press platform.
Data correspond to usage on the plateform after 2015. The current usage metrics is available 48-96 hours after online publication and is updated daily on week days.
Initial download of the metrics may take a while.