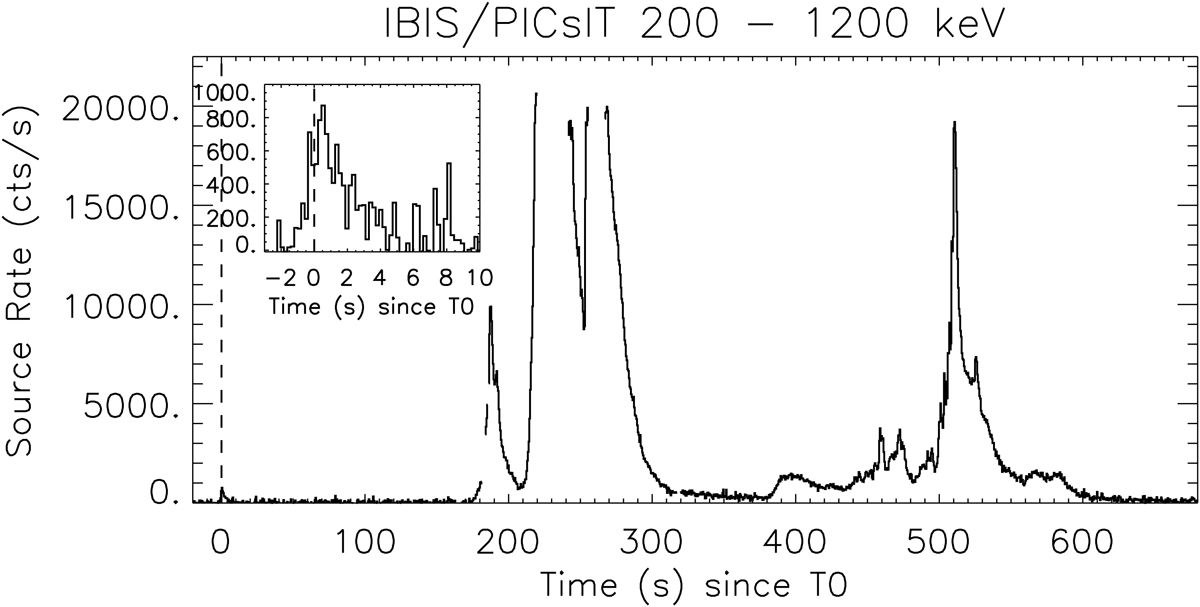
Fig. 1.
Download original image
Time evolution of the background-subtracted PICsIT light curve of GRB 202909A in the energy range 200 − 1200 keV. Each time bin was integrated over 500-ms to increase the statistics and avoid empty time bins. The dashed line corresponds T0 = 13:17:0 UTC, when the precursor was clearly detected by IBIS-PICsIT. The inset shows the precursor with 200-ms time resolution.
Current usage metrics show cumulative count of Article Views (full-text article views including HTML views, PDF and ePub downloads, according to the available data) and Abstracts Views on Vision4Press platform.
Data correspond to usage on the plateform after 2015. The current usage metrics is available 48-96 hours after online publication and is updated daily on week days.
Initial download of the metrics may take a while.