Fig. 1.
Download original image
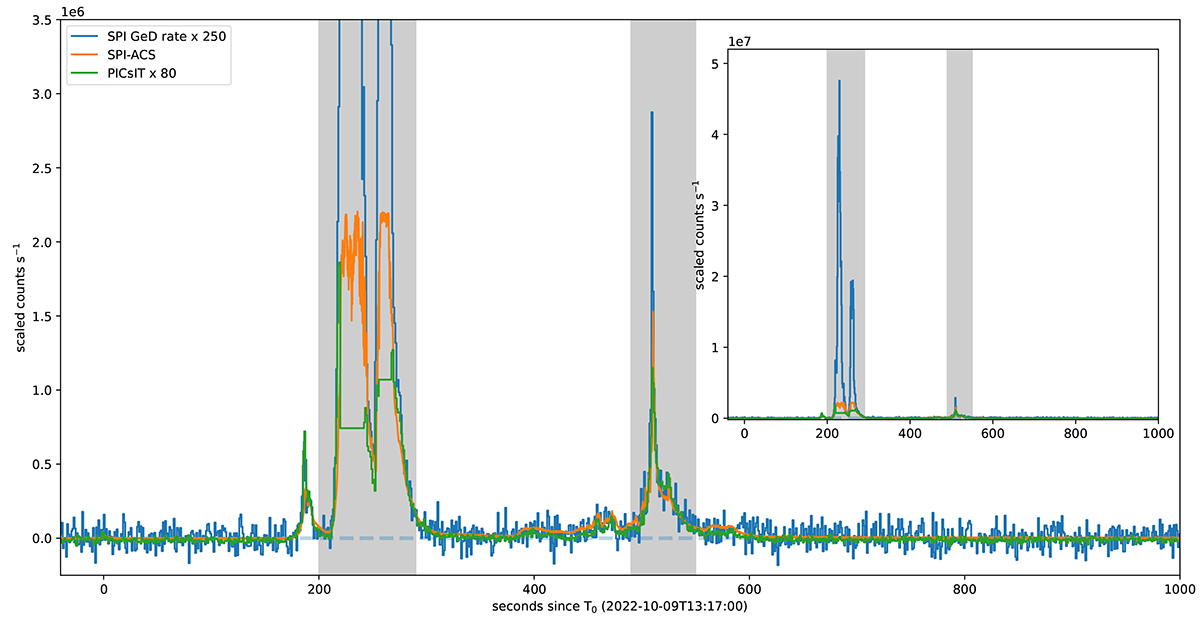
GRB 221009A prompt emission light curves (background-subtracted) as recorded by INTEGRAL instruments: SPI, SPI-ACS, and IBIS/PICsIT. All rates except for SPI-ACS are normalized to match the SPI-ACS rate. The SPI-ACS rate is affected by saturation for count rates above about 1.8 × 10⁶ counts s−1 and for PICsIT by the INTEGRAL buffer limit. Inset shows the different count rate range (in the same time range), highlighting combined SPI (Germanium detectors) rate (only moderately affected by dead-time), giving some insight on the true intensity of the primary emission episode comparing to the rest of the signal. Vertical dashed lines represent boundaries of the INTEGRAL pointings (see details in Sect. 2). Gray shaded regions represent emission episodes used for estimating fluence.
Current usage metrics show cumulative count of Article Views (full-text article views including HTML views, PDF and ePub downloads, according to the available data) and Abstracts Views on Vision4Press platform.
Data correspond to usage on the plateform after 2015. The current usage metrics is available 48-96 hours after online publication and is updated daily on week days.
Initial download of the metrics may take a while.