Fig. 3.
Download original image
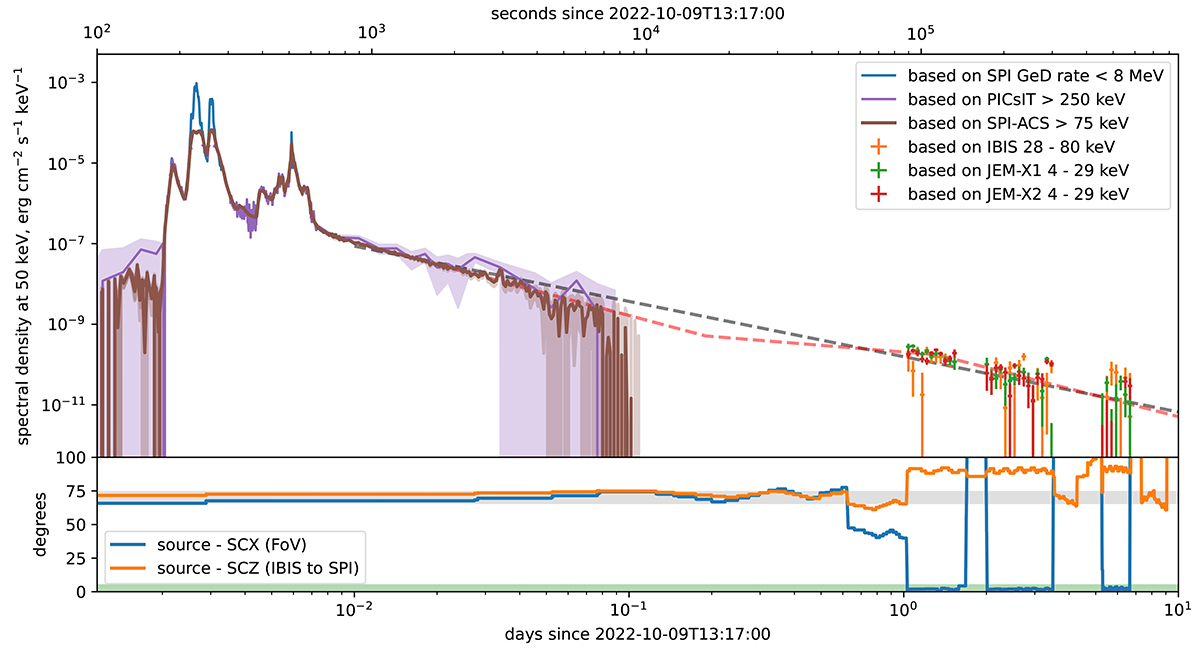
GRB 221009A prompt emission and afterglow lightcurve (top). All count rates are converted to a spectral energy density at 50 keV assuming powerlaw spectrum with a slope of −2. This spectrum is applicable for the afterglow, but implies that the prompt lightcurve in this plot is only indicative. Note: the “all-sky” observations are also available between 0.1 and 1 days after the event, but the uncertainty due to the remaining background variations does not allow for a measurement to be made within this time range. The gray dashed line represents a fit with a single powerlaw, acceptable given the response uncertainties. Red dashed line represent best fit model, consisting of powerlaw segments with two breaks. For details about the fitting see explanations in the text. GRB 221009A position relative to INTEGRAL spacecraft orientation, relevant for changes of the instrument response throughout the emission phases (bottom). The gray band indicates the range of orientations when the response changes by no more than 30%. The green band represents approximate FoV of INTEGRAL instruments.
Current usage metrics show cumulative count of Article Views (full-text article views including HTML views, PDF and ePub downloads, according to the available data) and Abstracts Views on Vision4Press platform.
Data correspond to usage on the plateform after 2015. The current usage metrics is available 48-96 hours after online publication and is updated daily on week days.
Initial download of the metrics may take a while.