Fig. 7.
Download original image
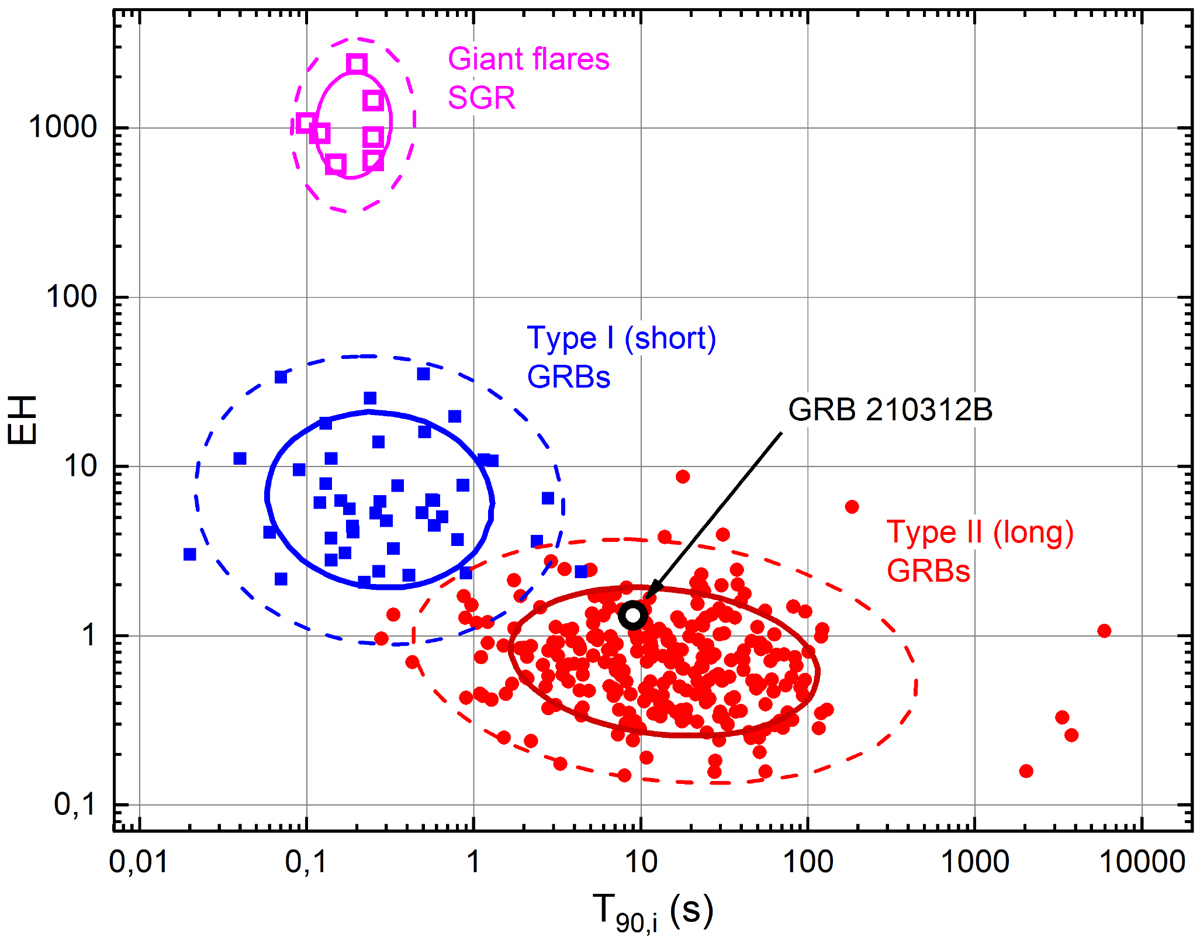
T90,i – EH diagram for type I GRBs (blue squares), type II GRBs (red circles), and SGR giant flares (unfilled magenta squares) with corresponding cluster analysis results. The 1σ and 2σ cluster regions are shown with bold solid and thin dashed curves of the corresponding colors. GRB 210312B is shown as an unfilled black circle.
Current usage metrics show cumulative count of Article Views (full-text article views including HTML views, PDF and ePub downloads, according to the available data) and Abstracts Views on Vision4Press platform.
Data correspond to usage on the plateform after 2015. The current usage metrics is available 48-96 hours after online publication and is updated daily on week days.
Initial download of the metrics may take a while.