Fig. 10.
Download original image
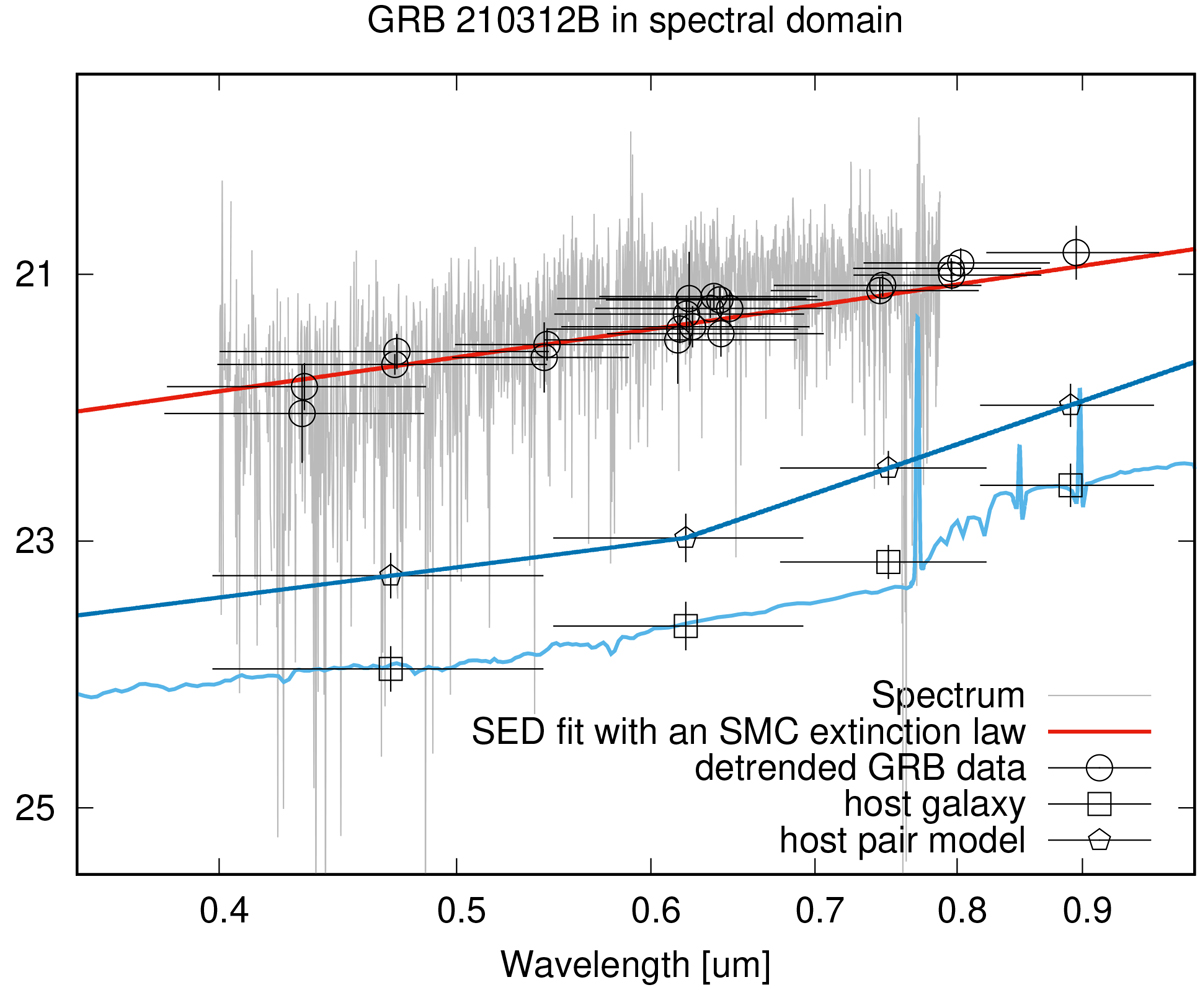
Spectral energy distribution of GRB 210312B and the residuals from the temporal and spectral fit model presented in Fig. 9. The points show the data after the temporal evolution is removed, revealing the intrinsic spectral shape. The griz photometric measurements of both host galaxy components are shown (points), along with a representative galaxy template spectrum (solid line) for comparison. The dashed line shows our simplified model of the host system used for host contribution corrections during afterglow fitting.
Current usage metrics show cumulative count of Article Views (full-text article views including HTML views, PDF and ePub downloads, according to the available data) and Abstracts Views on Vision4Press platform.
Data correspond to usage on the plateform after 2015. The current usage metrics is available 48-96 hours after online publication and is updated daily on week days.
Initial download of the metrics may take a while.