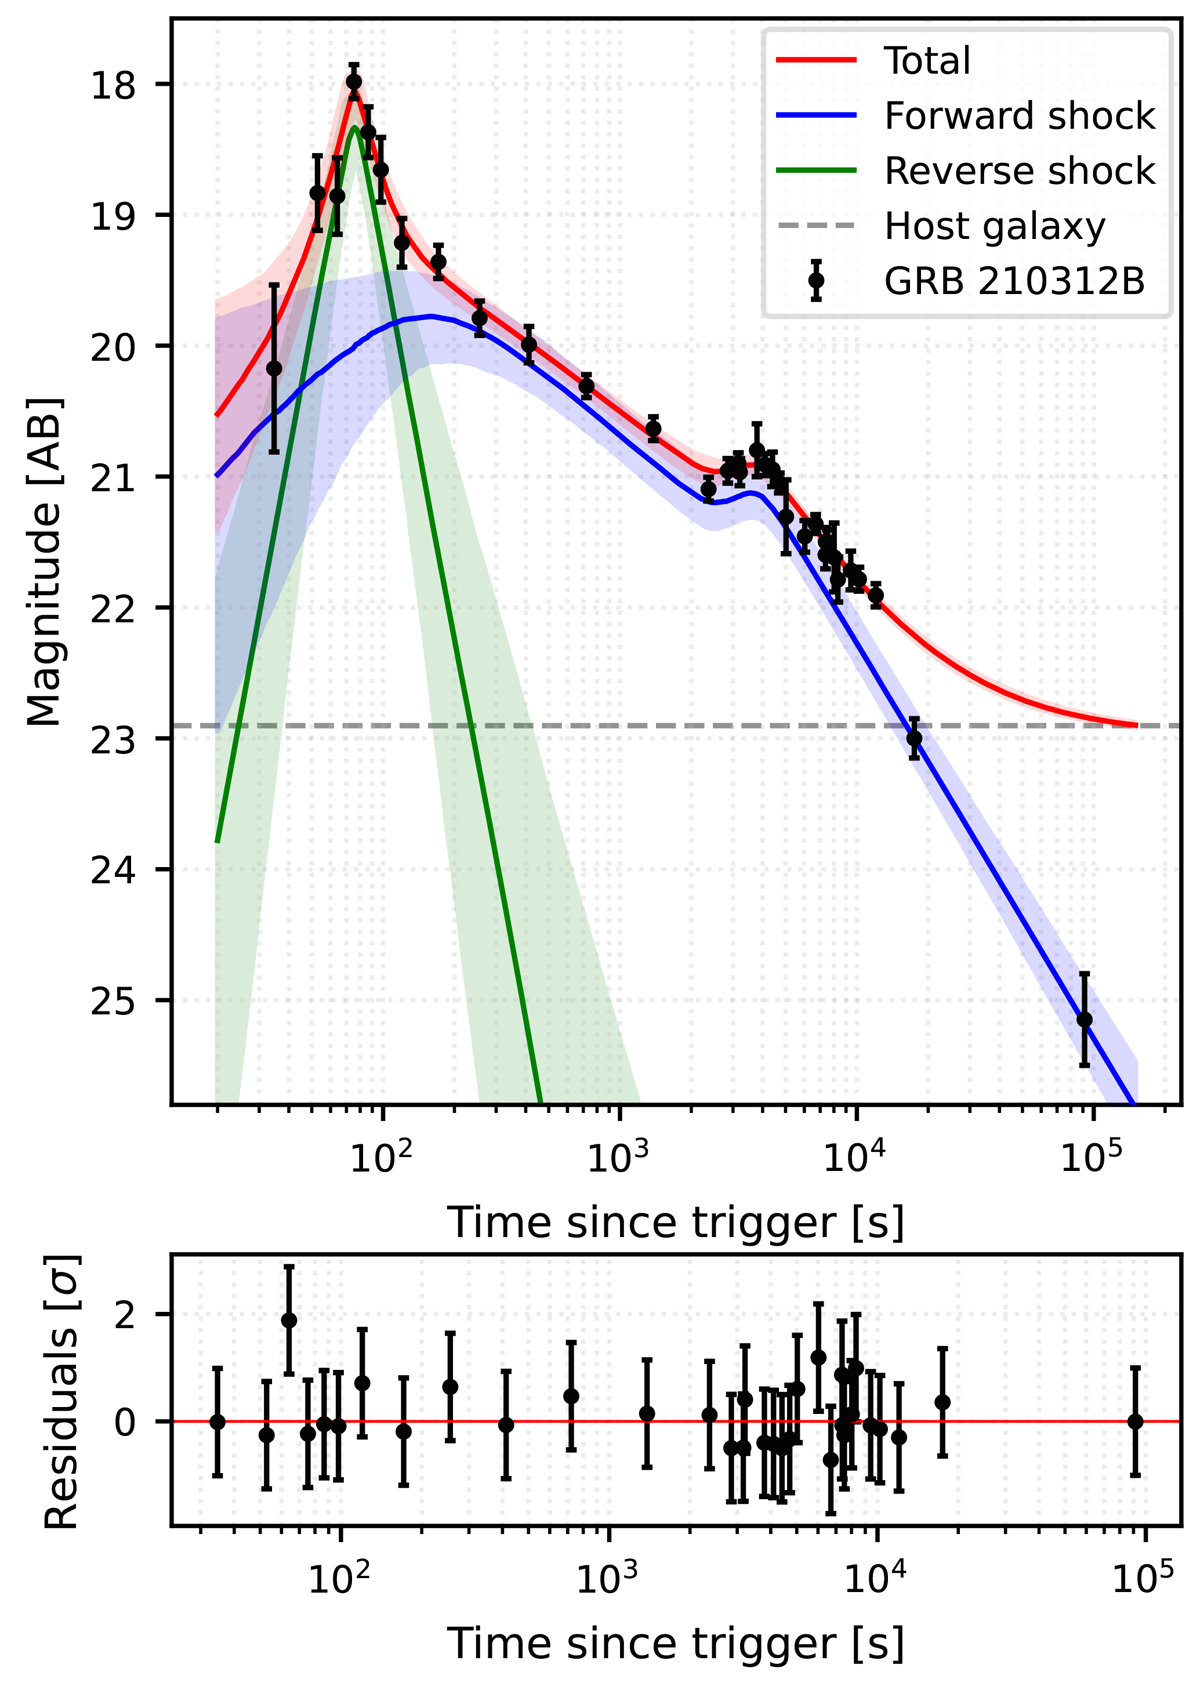
Fig. 9.
Download original image
Optical light curve of GRB 210312B. The data points show different filter measurements converted to the r-band equivalent using the spectral slope derived from our model fit. The solid lines show the best-fit model (red) with 68% confidence intervals (shaded regions) decomposed into its constituent components: forward shock (blue) and an early flare (green) emission. The dashed gray line indicates the host galaxy brightness. The model simultaneously fits both the temporal evolution and spectral behavior, properly accounting for the host galaxy contribution in measurements where it was not subtracted through image analysis. The residuals in the bottom panel demonstrate the quality of the fit. For model parameters, see Table 1.
Current usage metrics show cumulative count of Article Views (full-text article views including HTML views, PDF and ePub downloads, according to the available data) and Abstracts Views on Vision4Press platform.
Data correspond to usage on the plateform after 2015. The current usage metrics is available 48-96 hours after online publication and is updated daily on week days.
Initial download of the metrics may take a while.