Open Access
Fig. 11.
Download original image
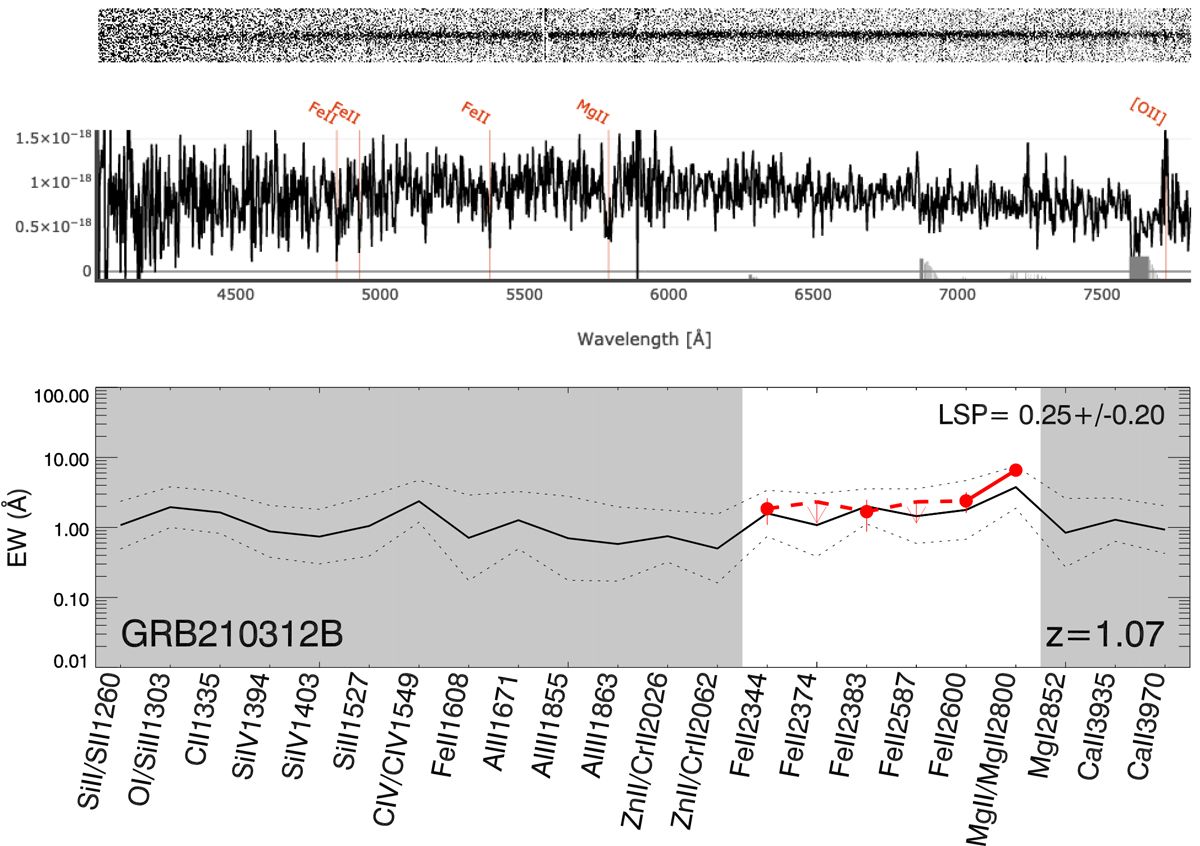
Top: Spectrum obtained with OSIRIS at the 10.4 m GTC. The 2D and 1D extractions are shown, and the detected features are indicated. Bottom: Line strength diagram obtained from the spectra of GRB 210312B.
Current usage metrics show cumulative count of Article Views (full-text article views including HTML views, PDF and ePub downloads, according to the available data) and Abstracts Views on Vision4Press platform.
Data correspond to usage on the plateform after 2015. The current usage metrics is available 48-96 hours after online publication and is updated daily on week days.
Initial download of the metrics may take a while.