Fig. 5.
Download original image
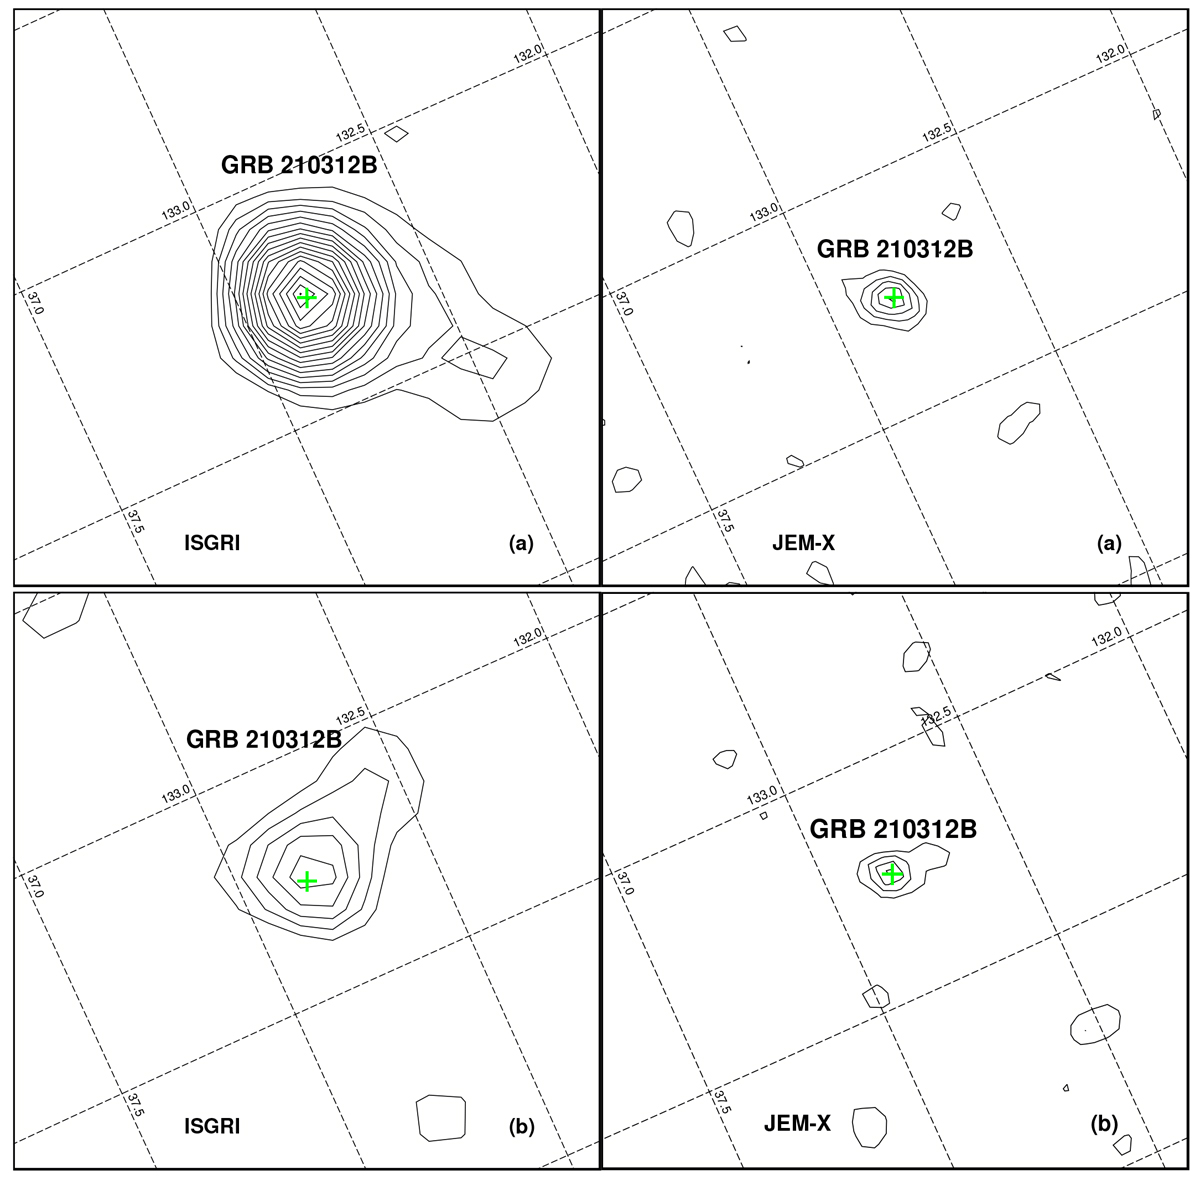
Detection of the burst by INTEGRAL during the primary pulse (a) and precursor (b) phases. Shown are S/N maps of the sky region ![]() in size centered on the GRB 210312B position. They were obtained by IBIS/ISGRI in the 20–100 keV range (left; solid lines show the S/N levels at 2, 3, 4, … σ) and JEM-X in the 3–20 keV range (right; the S/N levels are at 1, 2, 3, … σ). The dashed lines show a grid of Galactic coordinates. The burst was detected with IBIS/ISGRI at 19.1σ during the primary peak and 6.6σ during the precursor, and with JEM-X at 5.2 and 4.3σ, correspondingly.
in size centered on the GRB 210312B position. They were obtained by IBIS/ISGRI in the 20–100 keV range (left; solid lines show the S/N levels at 2, 3, 4, … σ) and JEM-X in the 3–20 keV range (right; the S/N levels are at 1, 2, 3, … σ). The dashed lines show a grid of Galactic coordinates. The burst was detected with IBIS/ISGRI at 19.1σ during the primary peak and 6.6σ during the precursor, and with JEM-X at 5.2 and 4.3σ, correspondingly.
Current usage metrics show cumulative count of Article Views (full-text article views including HTML views, PDF and ePub downloads, according to the available data) and Abstracts Views on Vision4Press platform.
Data correspond to usage on the plateform after 2015. The current usage metrics is available 48-96 hours after online publication and is updated daily on week days.
Initial download of the metrics may take a while.