| Issue |
A&A
Volume 697, May 2025
|
|
|---|---|---|
| Article Number | A84 | |
| Number of page(s) | 14 | |
| Section | Planets, planetary systems, and small bodies | |
| DOI | https://doi.org/10.1051/0004-6361/202451116 | |
| Published online | 12 May 2025 | |
Hidden under a warm blanket: If planets existed in protostellar disks, they would hardly produce observable substructures
1
European Southern Observatory,
Karl-Schwarzschild-Strasse 2,
85748
Garching,
Germany
2
Leiden Observatory, Leiden University,
PO Box 9513,
2300 RA
Leiden,
The Netherlands
3
Dipartimento di Fisica ‘Aldo Pontremoli’, Università degli Studi di Milano,
via G. Celoria 16,
20133
Milano,
Italy
★ Corresponding author: This email address is being protected from spambots. You need JavaScript enabled to view it.
Received:
14
June
2024
Accepted:
31
January
2025
Abstract
The onset of planet formation is actively under debate. Recent mass measurements of disks around protostars suggest an early start for planet formation in class 0/I disks. However, dust substructures, one possible signature of forming planets, are rarely observed in the young class 0/I disks, while they are ubiquitous in the mature class II disks. It is not clear whether the lack of dust substructures in class 0/I disks indicates an absence of planets or whether it is due to other physical effects such as temperature and dust opacity. Here, we consider the effect of temperature on the ability of planets to produce dust substructures. We prescribed the evolution of the disk and the protostar from class 0 to the class II phase and calculated the disk temperature using radiative transfer models at various stages of the evolution. We used the mid-plane temperature to calculate the disk scale height and the minimum planet mass needed to open observable dust gaps using the thermal criterion. We find that this minimum planet mass decreases as a function of time. In particular, we find that if a planet up to ∼5 M⊕ in the inner ∼5 au or up to ∼10−50 M⊕ at radii ≳5 au were already formed in the early protostellar phase (t < 2 × 10⁵ yr), it would barely produce any dust substructures. We conclude that a major contribution to the observed lack of substructures (if produced by planets) in the early protostellar phase – lowering their frequency by ∼50% – could be elevated temperatures rather than the absence of planets.
Key words: radiative transfer / planet-disk interactions / stars: low-mass / stars: protostars
© The Authors 2025
 Open Access article, published by EDP Sciences, under the terms of the Creative Commons Attribution License (https://creativecommons.org/licenses/by/4.0), which permits unrestricted use, distribution, and reproduction in any medium, provided the original work is properly cited.
This article is published in open access under the Subscribe to Open model. This email address is being protected from spambots. You need JavaScript enabled to view it. to support open access publication.
1 Introduction
The process of planet formation has been the subject of study for decades (Lissauer 1993; Pollack et al. 1996; Boss 1997; Youdin & Goodman 2005). Some of the most fundamental questions in this field relate to: when planets start to form, the typical timescales for planet formation, and the driving mechanisms behind planet formation. Considering the onset of planet(esimal) formation, given the long timescales of core accretion model (Pollack et al. 1996), it was long thought that they form in “protoplanetary disks” (i.e., class II disks); once the envelope has dissipated, the disk is relatively mature, and lasts for longer (Wuchterl et al. 2000; Goldreich et al. 2004). However, this was questioned by recent Atacama Large Millimeter/submillimeter Array (ALMA) data finding that the masses inferred from millimeter continuum observations of class II disks are at best equal to or at worst lower by one order of magnitude than the masses of exoplanets (Najita & Kenyon 2014, Manara et al. 2018; Tychoniec et al. 2018, 2020; Tobin et al. 2020). Recent population synthesis work argues that the best match for the class II dust mass distribution is indeed found when planets (Savvidou & Bitsch 2025), or at least substructures (Delussu et al. 2024), have already formed early on. Moreover, external photoevaporation (though maybe less relevant for disks in low-mass star-forming regions such as the nearest and best-surveyed ones) can significantly limit disk lifetimes in the average stellar birth environment (Winter & Haworth 2022) and curtail the growth of planets (Qiao et al. 2023). Nevertheless, planets are ubiquitous in the Galaxy. This could imply that the formation of larger bodies – planetes-imals or even planets – must start earlier in the class 0/I stage while there is still enough mass to form them.
A popular mechanism for planetesimal formation is the streaming instability (SI) (Youdin & Goodman 2005; Johansen et al. 2007, 2014), which requires a sufficiently high concentration of solids with respect to the gas to trigger the clumping of solids, with the clump eventually becoming self-gravitating. While some models predict that processes in the disk alone cannot achieve sufficient concentrations in the embedded stage (Drążkowska & Dullemond 2018), the differential collapse of dust from the envelope with respect to the gas may enrich the protostellar disk enough to begin planetesimal formation (Cridland et al. 2022, see also Tsukamoto et al. 2017; Koga et al. 2022) and these disks may already have significant amounts of large dust grains and pebbles in their mid-plane (Vorobyov et al. 2024; see also Bate 2022), although the high turbulence in young disks may impede planetesimal formation (Lim et al. 2024). Once these first building blocks of planets form, they can then grow by pebble accretion, which is efficient due to the enhanced accretion cross section because of the drag-assisted deflection and the steady supply of material from the drifting pebble flux (Ormel & Klahr 2010; Lambrechts & Johansen 2012; Liu & Ji 2020). This process may be especially effective during the early stages of disk evolution due to the high accretion rates and pebble fluxes (Tanaka & Tsukamoto 2019). An alternative model of planet formation begins with the rapid fragmentation of the gas disk due to gravitational instability (GI) (Boss 1997), which requires a high disk-to-protostellar mass ratio and is thus easier in young disks (see review by Kratter & Lodato 2016). Drag forces may drive the instability on small lengthscales, resulting in the rapid formation of rocky cores of 1−10 M⊕ (Longarini et al. 2023b,a; Baehr 2023) during the protostellar phase.
Nevertheless, the early formation of planets is still actively debated and observers are searching for more evidence of this phenomenon in class 0/I stages. In particular, if planets truly start to form early, it might be expected that one could observe their dust substructure signatures in these early stages, similarly to the ones commonly observed in mature class II disks (Calvet et al. 2002; Andrews et al. 2016; Akiyama et al. 2016; Fedele et al. 2017; Pinilla et al. 2018; Francis & van der Marel 2020; Long et al. 2023). Multiple observational studies searched for these substructures, and although some works find a few systems with dust rings and gaps in young protostellar disks (Sheehan & Eisner 2018; Sheehan et al. 2020; Segura-Cox et al. 2020), the majority of class 0/I disks do not show any substructures (see the review by Tobin & Sheehan 2024). In particular, recent statistical studies of protostellar disks such as the Early Planet Formation in Embedded Disks (eDisk) ALMA large program and the ALMA Legacy survey of class 0/I disks in Corona australis, Aquila, chaMaeleon, oPhiuchus north, Ophiuchus, and Serpens (CAMPOS) considered 19 and 124 class 0 and I disks at a resolution of ∼0.04′′ and ∼0.1′′, respectively. Both surveys had a substructure detection rate of ≲15% (Ohashi et al. 2023; Hsieh et al. 2024), while this number is ≳50% in class II disks (Baruteau et al. 2014; Andrews et al. 2018; Long et al. 2018; Cieza et al. 2021; Bae et al. 2023). These numbers could be higher if we account for some resolution bias, but not all substructures are due to planets (e.g., Zhang et al. 2015; Flock et al. 2015; Takahashi & Inutsuka 2016; Tzouvanou et al. 2023), and some planets might open multiple rings and gaps (Bae et al. 2017; Meru et al. 2019), suggesting that massive planets in embedded disks may be quite rare.
Therefore, considering the expected timescales for planet formation (e.g., Lambrechts & Johansen 2014; Drążkowska et al. 2023; Savvidou & Bitsch 2023; Lau et al. 2024), a relevant question is whether these relatively smooth class 0/I disks indeed imply the absence of planets altogether or are simply the result of other physical effects such as temperature and opacity effects. It has been suggested that the lack of substructures could be due to dust opacity effects (Ohashi et al. 2023; Sharma et al. 2023; Guerra-Alvarado et al. 2024). In this work, we consider the effect of temperature on the ability of planets to carve a gap – and the time of the gap opening – if they were to exist in embedded disks.
Observations find that young class 0 and I disks are in general warmer than the class II disks (van’t Hoff et al. 2020; Takakuwa et al. 2024). This is also implied from observations of highly complex millimeter spectra toward these objects where molecular species are sublimated from ices into the gas in warmer regions as opposed to the nearly barren spectra of class II disks (Thi et al. 2004; Jørgensen et al. 2016; Belloche et al. 2020; Loomis et al. 2020; Yang et al. 2021; Nazari et al. 2024a). The higher temperatures are expected to result in larger disk scale heights (H/r ∝  ), which in turn make it more difficult for planets to carve a gap (Lin & Papaloizou 1993; Crida et al. 2006; Baruteau et al. 2014) with the pebble isolation mass, and therefore a declining function of time (Bitsch et al. 2015). In this work, we use radiative transfer models to calculate the temperatures, and thus the scale heights of disks over time, starting with early class 0 disks and ending with class II disks. We then use analytical relations from hydrodynamical simulations to relate this to the minimum planet mass needed to carve a gap (Mgap) as a function of disk evolution. We find that this minimum mass decreases as a function of time and that even if a gas giant accreted ∼20% of its mass in the protostellar phase, it would likely not open a gap. These findings have important implications for planet formation timescales that we consider further in the discussion.
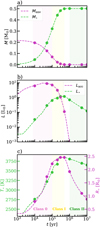 |
Fig. 1 Evolution of various parameters as the protostar ages for a final protostellar mass of 0.5 M⊙. (a) Evolution of envelope and protostellar mass. (b) Evolution of accretion and protostellar luminosity. (c) Evolution of protostellar radius and effective temperature. The filled circles indicate the nine distinct times that we have chosen to run the radiative transfer models. Shaded pink, yellow, and green areas roughly indicate the different classes. |
2 Models
Here, we simulate the evolution of the disk around a protostar from the class 0 phase to the class II phase by combining the models of Fischer et al. (2017) and the pre-main sequence evolutionary tracks of Baraffe et al. (2015). The detail of our evolutionary model is given in Appendix A and Fig. 1 shows the prescribed evolution of various parameters in our model. The prescribed values qualitatively match the observational measurements and other evolutionary models available in the literature (e.g., Evans et al. 2009; Visser et al. 2009; Dunham et al. 2010; Kristensen et al. 2012; Pokhrel et al. 2023).
We calculated the temperature using radiative transfer at nine distinct times during the disk evolution to find the disk scale height as a function of evolution. The radiative transfer models follow the general methods of Nazari et al. (2022). We used RADMC-3D version 2.01 (Dullemond et al. 2012) for our calculations. The density structures of the disk and the flattened envelope are the same as the disk-plus-envelope models of Nazari et al. (2022). The disk gas surface density was ∝ 1/R, where R is the radius in cylindrical coordinates. The assumed parameters of the models for various M⋆, f at different evolutionary ages are given in Tables B.1–B.3 (for more information on our choices for the final parameters used in the radiative transfer models, see Appendix B).
The major difference between our models and those of Nazari et al. (2022) is the iterative nature of our procedure to calculate the temperature. We initially started with ϵ values of 0.3, 0.2, and 0.1 for t < 105 yr, 105 ≤ t < 106 yr, and t ≥ 106 yr, respectively. The ϵ value was used in Nazari et al. (2022) to prescribe the disk scale height as H(R) = ϵ R. The initial values of ϵ are based on observational measurements of disk scale heights in various stages of a disk (Pinte et al. 2018; van’t Hoff et al. 2020; Law et al. 2022; Paneque-Carreño et al. 2022; Lee et al. 2022). Once we calculated the disk temperature using this initial scale height prescription, we recalculated the disk scale height using the calculated disk mid-plane temperature via (e.g., Armitage 2010):
 (1)
(1)
where cs and Ω are the sound speed and angular velocity. In Eq. (1), kB, Tmid−plane, mH, and G are the Boltzmann constant, mid-plane temperature, mass of hydrogen, and gravitational constant, respectively. We first smoothed the calculated mid-plane temperature using gaussian_filter from scipy.ndimage in python before calculating H(R) using Eq. (1). We repeated the above procedure for two more iterations, where various tests showed that it is sufficient for the mid-plane temperature to converge within ∼15% and for most models within ∼5% at radii of ≳10 au, which are the focus of this work. We note that our conclusions are independent of the initial ϵ assumed. We used 300 grid points for r between 0.4 and 0.5 au and 700 grid points for r between 0.5 and 150 au. We used 200 grid points in the θ direction between 0 and π/2, where r and θ are the radius and polar angle in spherical coordinates. Moreover, we used three million photons to calculate the temperature initially and then 6 million and 10 million photons for the next two iterations. These values were chosen based on various tests to ensure a robust measurement of the temperature.
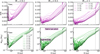 |
Fig. 2 Evolution of disk aspect ratio (top) and minimum planet mass required to open a gap (bottom) from young class 0 disks (lighter colors) to mature class II disks (darker colors) for different final protostellar masses. These models are those with small dust grains (0.1 μ m). The dashed gray line presents the radius of the disk assumed in these models. The typical masses of giant and rocky planets are taken from Zhu & Dong (2021) (also see Akeson et al. 2013). Up to ∼50 M⊕ of a giant planet and an entire rocky planet would create no sign of a dust gap if formed in the protostellar phase (t < 2 × 10⁵ yr). |
3 Aspect ratio and minimum gap-opening mass
The aspect ratio (H/R) calculated from the mid-plane temperature using Eq. (1) for the disk scale height is presented in the top row of Fig. 2. This figure shows that there is a divide between times ≲105 yr and ≳5 × 10⁵ yr. At 1 au, the aspect ratio at early times is ≳0.05 higher than late times for M⋆, f = 0.1 M⊙. This difference is ≳0.025 for M⋆, f = 0.5 M⊙ and 1 M⊙. At 10 au, the early times are ≳0.05 higher than the late times for all final protostellar masses. This large drop in the aspect ratio is driven by the final accretion of the envelope onto the star+disk, which leads to a large drop in the accretion luminosity, and thus the irradiation of the disc. A slower decline in the aspect ratio on timescales ≳1 Myr is driven by the luminosity falling as the star contracts down the Hayashi track. The disk aspect ratio for models with a disk radius of 100 au (Fig. C.1) and models with large dust grains (Fig. C.2) have a similar trend. That is, they generally get smaller for older disks. The results of these models are discussed further in Appendix C.
The minimum planet mass required to open a gap in a disk (Mgap) has been studied with hydrodynamical simulations of class II disks (Lambrechts et al. 2014; Rosotti et al. 2016; Bitsch et al. 2018), which typically show that the thermal criterion – that the Hill radius of the planet must reach, on the order of the scale height (Lin & Papaloizou 1993; Paardekooper & Mellema 2006; Baruteau et al. 2016; Ataiee et al. 2018) – controls the onset of gap opening. Quantitatively, the gap becomes observable in millimeter observations tracing large dust grains slightly before this point, once the mass of the protoplanet reaches approximately 20 M⊕ for a solar-mass protostar (Rosotti et al. 2016). The required protoplanet mass has a linear scaling with protostellar mass at a fixed aspect ratio and typical (using α prescription of Shakura & Sunyaev 1973 with α = 10−3) disk viscosities (Liu et al. 2019; Sinclair et al. 2020, although the weaker gravitational potential of low-mass stars results in their disks being thicker, and thus having a higher gap-opening mass):
 (2)
(2)
We emphasize that this relationship is based on hydrodynamical simulations of class II disks where no envelope is present. Therefore, this relation only gives a lower limit on the minimum planet mass needed to observe a gap, since in the class 0/I stage the envelope and dust extinction can hinder the observation of the gap. Moreover a thicker disk geometry can obfuscate any gaps that do open when viewed at a high-enough inclination (Guerra-Alvarado et al. 2024). In other words, the minimum planet masses needed to observe a gap could be even higher for class 0/I disks than given here.
Using Eq. (2), Mgap for our models is presented in the bottom row of Fig. 2. This figure shows that for all final protostellar masses, Mgap is higher by a factor of ≳10 in the early stages (t ≤ 105 yr) than the late stages (t ≥ 5 × 10⁵ yr). This holds for most radii above ∼0.5 au. We also find that, at all times, Mgap decreases weakly (factor of ∼2) as the final protostellar mass increases, consistent with the findings of Sinclair et al. (2020) for class II disks (where an age of 1 Myr was assumed).
Figure 2 also shows the typical radii from the star where super-Earth and/or mini-Neptune exoplanets are found (≲1 au) and those where the main population of giant exoplanets (ignoring hot Jupiters) is found (≳1 au). This shows that even if a rocky planet formed completely in the class 0/I stage (t < 2 × 10⁵ yr), it would either not produce an observable gap in the dusty disk or it would be just enough to start opening an observable gap. However, the same rocky planet could easily open a gap in a class II disk. We note that current observations of class 0/I disks do not trace the inner 1 au of the disk, but those with the best angular resolution trace the disk on a scale of ∼10 au (Ohashi et al. 2023). Future instruments such as the next-generation Very Large Array, which operates at wavelengths where dust optical depth is less of a concern, may be better suited to tracing the impact of these smaller, closer-in planets on their disks (Bae et al. 2023).
Thus, moving to the more massive planets at larger radii (∼10 au), Fig. 2 suggests that if a giant planet were completely formed in the early stages, it could open a gap in the embedded disks as well as the more mature disks. However, in the early stages, given that the gap and dusty rings are rarely observed for class 0 disks (they are mostly observed for class I disks and not all are due to planets; Sheehan et al. 2020; Segura-Cox et al. 2020; Ohashi et al. 2023; Hsieh et al. 2024), Fig. 2 puts an upper limit of ∼50 M⊕ on the mass that can be accreted by planets in most disks during their class 0 phase. Conversely, assuming that the substructures in some of the rare class 0/I disks where gaps and dusty rings are observed are a result of planets, we would require a lower limit of ∼10−50 M⊕ for the masses of those planets; that is, ≳3−20% of a Jupiter mass. Since forming such massive protoplanets on these timescales will be challenging, in Sect. 4.1 we estimate an upper limit on the fraction of disks that could produce such objects on these timescales.
4 Discussion
4.1 Implications for planet formation
Among the population of protoplanets inferred from gaps and cavities in disks assembled in the review by Bae et al. (2023), their inferred semimajor axes are all ≳10 au. Thus, the left panel of Fig. 3 summarizes how Mgap at 10 au changes over the course of a disk’s evolution through the class 0, I, and II stages. The gap-opening mass stays relatively constant throughout class 0, drops during class I, and finally declines very slowly over class II. Motivated by this behavior, we fit an approximate functional form for Mgap(t), of which we provide further details in Appendix D, using the M⋆, f = 0.5 M⊙ models. The range of Mgap among our class II models is ∼4−20 M⊕; the two lower and upper limits are consistent with the minimum estimated masses from the Bae et al. (2023) sample and with the updated estimates of Ruzza et al. (2024), respectively. Meanwhile, the largest gap-opening masses that we find are similar to the ∼60 M⊕ median of the Bae et al. (2023) sample (while Ruzza et al. 2024 generally estimate higher masses, with a median ∼180 M⊕). Thus, we might expect that, in the most extreme scenario in which the entire population of putative protoplanets observed in class II disks formed very rapidly at their inferred present locations, then the hotter temperatures and increased Mgap of younger embedded disks would effectively hide up to ∼50% of them, resulting in ≳25% of embedded disks hosting substructures. Therefore, this alone is not enough to completely explain the difference in substructure frequency between embedded disks (≲10−15%) and class II disks (≳50%). This suggests that either the substructures are roughly twice as hard to detect in embedded disks or the growth of planets must be ongoing between class 0 and class II disks.
Therefore, to estimate simply the relative reduction in the fraction of growing planets that may open gaps in embedded disks due to their elevated temperatures, we used a toy model based on a modified version of the pebble accretion prescription of Lambrechts & Johansen (2014, Eq. 31) (for full details see Appendix E.1; for discussion of other modes of planet formation see Appendix F). This is a model for 2D pebble accretion: though the core likely initially accretes in the 3D regime where its accretion radius is less than the pebble scale height, it should reach the 2D regime long before it can open a gap. Therefore, we argue that the 2D regime is the relevant regime for determining the effects of delaying gap-opening until higher masses; the growth in the 3D regime will be independent of the gap-opening mass. As our fiducial values, for all disks we assume an initial core mass of Mc, 0 = 10−1 M⊕, to ensure that the embryo accretes in the 2D regime (Lambrechts & Johansen 2014), and a formation time of ti = 0.1 Myr, such that the embryo is injected at the end of class 0. This delay loosely accounts for various factors, including the time for (a) dust to settle out of the envelope and the disk upper layers, (b) conditions conducive to the SI to arise and then the instability to grow, which can take hundreds of orbits (Yang et al. 2017) even if the earlier stages are expedited by dust growth in the envelope (Cridland et al. 2022), and (c) the core to grow out of the 3D regime. We estimate that the embryos will spend less time in the 3D regime than the 2D regime, based on the relatively larger fraction of disks that can grow an embryo from 10−3 M⊕ to 10−1 M⊕ in the 3D regime than from 10−1 M⊕ to Mgap(t) in the 2D regime (Appendix E.2), so that should not be a limiting factor. Moreover, there are alternative routes to forming cores that would start in the 2D regime via dust-assisted GI (Longarini et al. 2023a,b; Baehr 2023; see Appendix F for its caveats). Finally, we note that in this toy model planets are assumed to form in a smooth disk, without assistance from structures such as dust traps (e.g. Guilera & Sándor 2017; Morbidelli 2020) or snowlines (e.g. Drążkowska & Alibert 2017).
We used the pebble accretion prescription outlined above to determine the disk mass required to provide sufficient pebble flux to grow a planet of mass Mgap(t) in time t (Eq. (E.6)–(E.7)), where Mgap(t) is given by our fit function (Eq. (D.1)), and compared this to the case in which Mgap is kept fixed at its value at 1 Myr. We then used the lognormal fits to the class 0 non-multiple dust mass distribution from the VANDAM survey (Tobin et al. 2020, Table 9), assuming a gas-to-dust ratio of 100, in order to estimate how many disks started with enough mass to fulfill or exceed this pebble accretion criterion at each time in each case (Eq. (E.8)). We note that the masses presented by Tobin et al. (2020) are a conservative choice, since the dust is likely to be optically thick at ALMA wavelengths (see Tychoniec et al. 2018 who compare mass estimates from ALMA and VLA).
Our fiducial calculation is shown in the right panel of Fig. 3 (see Fig. E.1 for other versions assuming different input parameters). We carried out this analysis at 10 au, but this number can be interpreted as equivalent to the fraction of disks able to grow their furthest gap-opening planet at 10 au or greater – the range currently probed by observations (e.g., Ohashi et al. 2023; Bae et al. 2023) – by time t. Planet growth is slower and gap opening is harder further from the star. However, disks that are massive enough to form a planet at 10 au within time t include both disks that can form these planets exactly in t and disks that can form these planets in shorter than t. Although the disks in the first category will not be able to produce gap-opening planets further than 10 au in time t, the disks in the second category, which are massive enough to grow gap-opening planets at 10 au in shorter than t, have the right mass to produce more massive gap-opening planets at some larger radius in exactly t (i.e., those disks susceptible to gap-opening further out by time t are just a subset of those that can form gaps at 10 au).
The bottom right panel of Fig. 3 shows that for the Lambrechts & Johansen (2014) pebble fluxes, this calculation yields a decrease of up to a factor of ∼2−3 in the fraction of early class I disks that have a high-enough initial mass to produce an Mgap(t) planet given their elevated temperatures, compared to the same disks if they did not have elevated temperatures (i.e., using Mgap(1 Myr) ≈ 15 M⊕ at all times). For example, only ∼5% of disks start with enough mass to form a ≳40 M⊕ planet in ≲2 × 10⁵ yr, compared to ∼10% with enough mass to form a ≳10 M⊕ planet in that time. This suggests that ∼50% of planets that would otherwise be detectable in class II would be hidden by the high disk temperatures in early class I disks, consistent with what was estimated above from the Bae et al. (2023) distribution of inferred protoplanet masses.
Moreover, by the middle of class I (∼0.3 Myr), the predicted upper limit on disk fractions hosting gap-opening planets using the fiducial model (see top right panel of Fig. 3) is roughly in line with the observed frequency with which substructures are detected in embedded disks (≲15%, Ohashi et al. 2023; Hsieh et al. 2024; where all might not be due to planets). We reiterate that our derived ∼10−15% value in top right panel of Fig. 3 is an upper limit on the number of observable substructures due to planets, since the opening of a gap in the gas surface density does not ensure its detectability due to opacity and geometrical effects. The fraction of disks that start with enough mass to have grown gap-opening planets continues to rise from 10−15% in class I into class II, reaching ≳50%, which is consistent with observed substructure occurrence rates in class II disks.
In Appendix E.1, we explore the sensitivity of these disk fractions to factors such as earlier embryo injection times, lower initial core masses, and reduced pebble fluxes2, finding that the absolute values of disk fractions are model-dependent. Considering those absolute values, in the most generous scenario that we explore, in which massive cores form early and accrete from a high pebble flux (bottom right panel of Fig. E.1), the toy model does not significantly exceed the fraction of observed disks with known substructures in early disks (especially when higher temperatures are considered), and thus current observations do not rule out such scenarios. Conversely, more conservative planet formation models that produce lower absolute fractions of substructured embedded disks (bottom left panel of Fig. E.1) would suggest that a significant fraction of the observed substructures formed via mechanisms other than planets even in the class II disks. We also note that based on our fiducial case (top right panel of Fig. 3) a high (>80%) fraction of disks are expected to have substructures due to planets at 10 Myr. Although this number is not in conflict with substructure detection rates of class II disks, it may be perceived as inconsistent with current exoplanet population studies (e.g., Rosenthal et al. 2022). Ignoring the biases in exoplanet surveys (see Sect. 4.2), this may be justified in our model if a time cutoff of a few million years were assumed. Moreover, we note that the Lambrechts & Johansen (2014) prescription that we use more strongly overestimates pebble fluxes at later times. This is because the pebble production line in their model moves outward in time to potentially infinity, which is in conflict with the observed class II disk radii. Therefore, a time cutoff of a few million years in our model is justifiable. In conclusion, the relative decrease in the fraction of disks that can produce a gap-opening planet if elevated temperatures are considered (bottom right panel of Fig. 3) seems to be a factor of ≳2 regardless of the model assumptions. However, the absolute fractions of disks themselves at a given time vary significantly depending on the assumptions made in the model (see Fig. E.1).
Gas giant planets require runaway gas accretion to build their large gas masses (e.g. Pollack et al. 1996). This phase happens after sufficient contraction of the gas envelope, a process that depends sensitively on the contribution of sublimating pebbles to the envelope’s heating and opacity. Indeed, the few planets that could already accrete ∼10−50 M⊕ of their mass in the protostellar stage (see Sect. 3) suggest pebble accretion rates of ∼10−4 M⊕ yr−1, which is enough for pebbles to dominate the envelope opacity (Brouwers et al. 2021). Thus, runaway accretion likely requires planets to have reached their pebble isolation mass (e.g. Lambrechts et al. 2014; Ormel et al. 2021) in order to ensure that pebble accretion cannot prevent the cooling and contraction of the envelope. Any giant planets that did form in embedded disks would therefore accrete a significant mass of pebbles, resulting in a high metallicity. However, structural modeling of gas giant mass-radius relationships implies metallicities of Z ≳0.1, equivalent to ∼50−60 M⊕ of heavy elements for a 1 MJ planet (Thorngren et al. 2016); such a scenario is therefore not excluded by typical giant planet compositions.
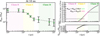 |
Fig. 3 Left: range of minimum gap-opening planet mass from the entire grid of models at 10 au as a function of time. The stars show the mean at each time. A fit function to the results of the models for M⋆, f = 0.5 M⊙ is shown with a dashed gray line. Upper right: fraction of disks that can open a gap at radii ≥ 10 au if planets grow at the maximum rate allowed by pebble accretion (see text for details), assuming a gap-opening mass changing with time (solid pink line) found from the dashed gray line in the left panel. This provides an upper limit on the number of observable substructures that are opened by planets. The green line shows the same but for a gap-opening planet mass at 1 Myr (i.e., ∼15 M⊕). The dotted black lines roughly indicate the substructure occurrence rate in observed disks. Lower right: pink line divided by the green line from the panel above showing the factor by which temperature effects alone reduce the number of gapped disks. The shaded background colors roughly show the different classes. |
4.2 Caveats and comparative remarks
In this work, we consider the gas and dust to be physically and thermally coupled. Moreover, we do not include dust settling and viscous heating. We also assume that planets can start forming in the protostellar phase. It is important to note that whether planets start forming early is actively under debate. Although some studies find that planets could start forming in the protostellar stage (Tsukamoto et al. 2017; Tanaka & Tsukamoto 2019; Cridland et al. 2022; Vorobyov et al. 2024; Baehr 2023; Longarini et al. 2023a,b), it is not yet clear whether they can without already existing substructures and perturbations (Lyra et al. 2008; Guilera & Sándor 2017; Morbidelli 2020; Voelkel et al. 2020; Lyra et al. 2024; Sándor et al. 2024). Further modeling work is needed to assess how this process could take place in the early stages, which is beyond the scope of this study.
We avoid making a direct comparison of the substructure occurrence rate in the class 0/I phase with that of wide-orbit giant planets, since much happens from that early phase until a planetary system is formed. For example, Lodato et al. (2019) (see also Ndugu et al. 2019) found that planet migration and evolution is necessary to produce a good match between the distribution of putative planets from gaps in class II disks and the distribution of cold Jupiters. A meaningful comparison between current observations of class 0/I disks and planets at radii ≳5 au is thus only possible with detailed modeling of the system’s evolution, or a comparison of the trends of substructure type and planet mass (regardless of orbital radius) with stellar mass, as was done by van der Marel & Mulders (2021) for mature disks, which are both beyond the scope of this study. Moreover, while disk observations do not yet resolve ≲5 au, where most Jupitermass planets have been discovered, it could also be argued that most of the current exoplanetary surveys are not yet sensitive enough to characterize planets at larger radii of ≳5−10 au (e.g., see review by Zhu & Dong 2021).
Although the assumption for thermal coupling of dust and gas would break down in the disk surface layers (e.g., Kamp & Dullemond 2004; Bruderer et al. 2012), it is a valid assumption in the disk mid-plane, which has a high density and is the focus of this work. The assumption of no dust settling is likely realistic in the early stages, given the observational evidence for a small amount of settling in these disks (e.g., Sheehan et al. 2022; van’t Hoff et al. 2023; Villenave et al. 2023; Encalada et al. 2024). For mature disks, this assumption is likely not valid and larger grains are expected to settle in the mid-plane (e.g., Dullemond & Dominik 2004; Woitke et al. 2016; Villenave et al. 2020). However, given that the difference between the models with small grains and large grains in this work is small (Figs. 2 and C.2), including dust settling for mature disks will likely not change the conclusions and will not increase the Mgap by one order of magnitude.
Including viscous heating would increase the mid-plane temperature, and thus increase the disk aspect ratio. However, if at all relevant, younger disks have higher accretion rates, and thus are more likely to be influenced by viscous heating and higher mid-plane temperatures (e.g., Manara et al. 2023; Fiorellino et al. 2023; Takakuwa et al. 2024). Moreover, these young disks may be more turbulent (Villenave et al. 2023), which could help to close gaps and further reduce the number of substructures. Another effect of turbulence could be increased grain fragmentation (see Testi et al. 2014 for a review), decreased grain sizes, and thus lower accretion rates onto the forming planets, which would delay the gap formation further. Therefore, including viscous heating or turbulence for younger disks is expected to strengthen the conclusions made here.
5 Conclusions
The difference in substructure frequency between embedded disks and older disks may imply the unviability of early planet formation as an explanation for the inferred masses of class II disks being insufficient to form planetary systems. Motivated by this, we have considered the evolution of the mid-plane temperature, the disk aspect ratio, and the minimum planet mass needed to open a gap in the dust from early disks to mature ones. We found that class 0/I disks have a higher mid-plane temperature, and thus aspect ratio, than class II ones. We have shown that a completely formed rocky planet at ∼1 au or a giant planet with a mass of up to ∼50 M⊕ at 10 au would not be able to open an observable gap in the class 0/I stage, while that planet will easily open one in the class II stage. We estimate that the number of planets hidden by elevated temperatures could be comparable to the number that are large enough to open gaps if they form early. Thus, the relative lack of substructures in young disks (where all the observed substructures might not be due to planets) may not imply such a low efficiency of early planet formation.
Acknowledgements
We thank the referee for their constructive comments. We greatly appreciate the helpful discussions with C. Leedham and E.F. van Dishoeck. P.N. acknowledges support from the ESO Fellowship and IAU Gruber Foundation Fellowship programs. A.D.S. was supported by funding from the European Research Council (ERC) under the European Union’s Horizon 2020 research and innovation programme (grant agreement No. 1010197S1 MOLDISK). G.P.R. is funded by the European Union under the European Union’s Horizon Europe Research & Innovation Programme No. 101039651 (DiscEvol) and by the Fondazione Cariplo, grant no. 2022-1217. Views and opinions expressed are however those of the author(s) only and do not necessarily reflect those of the European Union or the European Research Council. Neither the European Union nor the granting authority can be held responsible for them.
Appendix A Evolutionary model
Our evolutionary model assumes that the central protostar accretes gas from its surrounding envelope with mass Menv(t) over time with a rate of Ṁ(t) to grow to a final protostellar mass of M⋆, f. This accretion will result in an accretion luminosity of Lacc(t) = η G M⋆(t) Ṁ/R⋆(t), where η was assumed as 0.8 which is a typical value for young protostars and can be found by assuming that the disk accretes from an inner radius of ∼5 R⋆ (Meyer et al. 1997; Hartmann et al. 2016). We prescribe the evolution of envelope mass following Fischer et al. (2017) as
 (A.1)
(A.1)
where Menv,0 is the initial envelope mass within a radius (assumed as 2500 au here) and tH is the time required for the protostar to accumulate half of its final mass. The accretion rate is defined simply by Menv/tff, where tff is the freefall time of the envelope within the radius which we defined Menv, 0 (i.e, 2500 au). The protostellar mass (M⋆) would then increase with time using  . The evolution of envelope and protostellar mass is shown in Fig. 1a. We note that the final protostellar mass can be larger than the initial envelope mass within 2500 au because the protostar can accrete mass from radii larger than 2500 au.
For the protostellar luminosity, radius, and effective temperature (see Fig. 1b and c) we first set the time at which the protostar has accumulated half of its mass (tH) as the birthline for the premain sequence evolutionary tracks of Baraffe et al. (2015), and then take the protostellar parameters (L⋆, T⋆, and R⋆) for the corresponding protostellar mass at times t−tH from Baraffe et al. (2015). At times before the birthline, we take the protostellar parameters corresponding to the birthline of Baraffe et al. (2015) tracks while considering the evolving protostellar mass. We note that Baraffe et al. (2015) do not report L⋆, T⋆, and R⋆ at times below 5 × 10⁵ yr, thus we take their values at 5 × 10⁵ yr for the birthline and at times up to when t−tH is equal to 5 × 10⁵ yr. This assumption is valid because Baraffe et al. (2002) showed that the protostellar luminosity does not change significantly at times before 5 × 10⁵ yr (see their Fig. 3). We also note that changing the birthline time from tH to t10% or to t90% does not change the protostellar luminosity significantly (within ∼25%). Finally, because the protostellar luminosity at times below 5 × 10⁵ yr is around one order of magnitude lower than the accretion luminosity (see Fig. 1), these assumptions will not change the conclusions of this work.
Appendix B Full description of the grid parameters assumed for the radiative transfer
The parameters used in the radiative transfer models for the cases where the final protostellar masses are 0.1, 0.5, and 1 M⊙ are given in Tables B.1, B.2, and B.3. Apart from the protostellar parameters which are prescribed as explained in Appendix A, we opt for fixing the gas disk radius throughout the evolution (once at 50 and once at 100 au). This is supported by current observations of gaseous disks (Long et al. 2022; Hsieh et al. 2024) and the chosen values are similar to typical dust disk radii found from Tobin et al. (2020) for their class 0 objects when the dust and gas are more coupled than the later stages. However, we vary the disk mass during the evolution. We opt for a simple disk mass prescription. Based on the gaseous and dusty disk mass measurements (assuming a gas-to-dust mass ratio of 100) from millimeter and centimeter observations (Miotello et al. 2016; Ansdell et al. 2016; Tychoniec et al. 2018, 2020; Tobin et al. 2020; Anderson et al. 2024), we assume gaseous disk masses of 0.02, 0.01, and 0.001 M⊙ for t < 105 yr, 105 ≤ t < 106 yr, and t ≥ 106 yr, respectively. We note that based on planet formation models (e.g., Savvidou & Bitsch 2023) a 0.02 M⊙ disk mass might not be enough to form a giant planet but at those early stages the disk and the planets could be constantly replenished by the envelope and these are approximate median masses, which disks may exceed by enough to grow a planet.
Following Nazari et al. (2022), we run the grid once for a dust distribution including large (maximum dust grain size of 1 mm) grains and once for a dust distribution with small (0.1 μ m) grains. The reason to consider models with small and large grains is because at early times there is mixed evidence for dust growth in the inner envelope (Ossenkopf & Henning 1994; Kwon et al. 2009; Agurto-Gangas et al. 2019; Cacciapuoti et al. 2023; Lebreuilly et al. 2023), while high angular resolution observations reveal millimeter grain sizes in young disks that can hide the emission from various molecules (Harsono et al. 2018; Nazari et al. 2024b). We do not include dust drift and dust settling in the disks which is a reasonable assumption for young disks (t ⩽ 5 × 10⁵ yr., Sheehan et al. 2022; Lin et al. 2023; van’t Hoff et al. 2023; Villenave et al. 2023) but will become important at the later stages. Those effects are further discussed in Sect. 4.2. We do not include viscous heating in the disk because Ṁ ≲10−5 M⊙ yr−1 at all evolutionary stages for the protostellar masses assumed here, in agreement with observations and models (e.g., Alcalá et al. 2017; Sellek et al. 2020; Fiorellino et al. 2023; Manara et al. 2023; Narang et al. 2024). Thus the heating contribution from viscosity will be negligible (e.g., Harsono et al. 2015; Nazari et al. 2023).
Appendix C Results of the models with large grains and Rdisk = 100 au
Figure C.1 presents the disk aspect ratio and minimum gap-opening planet mass for the models with disk radius of 100 au, while Fig. C.2 shows those for models with large dust grains (maximum grain size of 1 mm) and Rdisk = 50 au. The models with a larger disk radius show similar trends and values for the disk aspect ratio and minimum gap-opening planet mass at radii below 50 au to the models with Rdisk = 50 au. Moreover, including large grains in the models does not change the trend in aspect ratio with time (see Fig. C.2). Including large grains in some models and at certain radii increases the aspect ratio and in some other cases it decreases or plays no significant role in the disk aspect ratio. Nevertheless, the changes produced in aspect ratio by including larger grains are for most cases below 0.025.
Appendix D Gap-opening planet mass as a function of time
In the left panel of Fig. 3 we fit a line to the findings of the radiative transfer models for the case where M⋆, f = 0.5 M⊙ as shown by the gray dashed line. We use curve_fit from scipy.optimize in python. The function that we use to fit the models with takes the following form
 (D.1)
(D.1)
with the final values of a, b, c, d, and t0 given by 58.2 M⊕, 14.9 M⊕, 0.09,−0.17, and 105.33 yr respectively.
Model parameters and results for M⋆, f = 0.1 M⊙
Model parameters and results for M⋆, f = 0.5 M⊙
Appendix E Pebble accretion
E.1 Toy model
In order to estimate for how many disks the growth timescale can compete within the lifetime of the embedded phase (and thus elevated temperatures), we use a simple pebble accretion model based on Lambrechts & Johansen (2014). Following that work we use a coagulation efficiency of 0.5 everywhere. Here the pebble accretion rate is assumed to be given by the 2D Hill regime:
 (E1)
(E1)
where rH and ΩK are the Hill radius and Keplerian orbital frequency respectively, the Stokes number is assumed to be given by the drift limit and depends on the gas pressure (P) gradient and gas surface density (Σg)
 (E.2)
(E.2)
and the steady-state pebble surface density is
 (E.3)
(E.3)
Model parameters and results for M⋆, f = 1 M⊙
We assume that the pebbles are produced due to the progress of a growth front outwards through a disk with gas surface density Σg = Σ1(R/au)−1 (where Σ1 is the gas surface density at 1 au, called β by Lambrechts & Johansen 2014) and initial dust-to-gas ratio Z0 = 0.01. Then following Lambrechts & Johansen (2014), the pebble flux is
 (E.4)
(E.4)
where we introduce the factor fPF to allow for a suppression of the pebble fluxes (see main text).
Combining everything, we obtain a pebble accretion rate
 (E.5)
(E.5)
Compared to Eq. 31 of Lambrechts & Johansen (2014), our Eq. E.5 has the additional suppression factor  . To test whether these effects could change our conclusions, we also investigate a scenario where the pebble fluxes are reduced by a factor fPF = 0.1 (see Fig. E.1); that is, only 10% of the dust grains produced at the growth front are assumed to be efficiently drifting pebbles.
Equation E.5 also has an additional (H/R)−4/3 term which results from the larger absolute pressure gradient in younger, hotter, disks which lowers the Stokes number in the drift limit (Eq. E.2) and thus reduces the efficiency of pebble accretion (Eq. E.1) in young, more vertically extended disks. It is normalized to (H/R) = 0.059 at 10 au, which is the value appropriate to Lambrechts & Johansen (2014), and also happens to be the value at 1 Myr for our 0.5 M⊙ models (Table B.2).
Although the factors of the planet location R and background density Σ1 may change over time due to planet migration or disk dispersal respectively, we hold them constant here both for simplicity and to better isolate the effects of the changing temperatures. We may then integrate Eq. E.5 and solve for the required Σ1 to grow a planet of mass Mgap(t) in time t:
 (E.6)
(E.6)
where the integral is performed numerically and H/R changes with time as a function of the same form as Eq. D.1.
Finally, we convert Σ1, crit to a dust mass by assuming the same 1/R profile and a typical disk radius of 50 au (Tobin et al. 2020)
 (E.7)
(E.7)
Following Tobin et al. (2020), we assume that the disk mass follows a lognormal distribution with median  = 52.5 M⊕ and σ = 0.83 such that we can estimate the fraction of disks that can grow a gap-opening planet in time t using the error function:
![Mathematical equation: $f_{M_{\mathrm{gap}}(t)}=\frac{1}{2}\left(1-\operatorname{erf}\left[\frac{\log _{10}\left(M_{\mathrm{d}, \mathrm{crit}}(t) / \bar{M}_{\mathrm{d}}\right)}{\sqrt{2} \sigma}\right]\right).$](/articles/aa/full_html/2025/05/aa51116-24/aa51116-24-eq16.png) (E.8)
(E.8)
This equation is used to produce the right panels of Fig. 3. As well as the fiducial values presented in Sect. 4.1 and Fig. 3, in Fig. E.1, we also present results for a lower core mass of Mc,0 = 10−3 M⊕, earlier insertion time ti = 0.01 Myr and reduced pebble flux fPF = 0.1, demonstrating that the main conclusion is largely insensitive to these parameters. More information on the consequences of Eq. E.8 are given in Sect. 4.1.
To contextualize these numbers, we note that at the end of the class I phase Mcrit = 108 M⊕ ≈ 2  and Mgap(t) = 12.2 M⊕. This corresponds to an average ∼11% pebble accretion efficiency, consistent with expectations Lambrechts & Johansen (2014), assuming the whole initial dust mass can participate. This is not a bad assumption, the remaining disk mass estimated from ALMA fluxes in the class I phase is already ∼25% of the class 0 mass, falling to ∼5% by class II (Tychoniec et al. 2020) suggesting significant dust loss to pebble drift. Nevertheless, we note that our toy model is likely too simple to truly capture planet formation at early times and thus may be overestimating the absolute number of gaps that can be produced by the growing planets.
E.2 3D pebble accretion regime
Lower-mass embryos can have accretion radii that are smaller than the pebble scale height, in which case they will accrete in the 3D regime, which is less efficient since they can only access a fraction of the disc’s pebbles. Since the dust scale height may be written in terms of the turbulence parameter α as  then for pebbles (where S t ≫ α)
  . Following Eqs. 10 and Fig. 7 of Drążkowska et al. (2023), we may estimate
  . For α=10−4−10−3, a 10−3 M⊕ embryo (as used by Lambrechts & Johansen 2014) accretes in the 2D Hill regime for Stokes numbers of St = 0.1−1. For the median class 0 disk mass (Tobin et al. 2020), such Stokes numbers correspond to pebbles around a centimeter in size in the outer disk (at ∼50 au). The corresponding numbers for a 10−1 M⊕ embryo are S t ≈ 10−2 and ∼mm-sized pebbles.
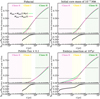 |
Fig. E.1 Same as right column of Fig. 3 (top left here), showing the effect of varying several parameters that are inputted in our toy model. The top right assumes a smaller initial embryo mass, bottom left presents the case where the pebble flux is decreased by a factor of 10 and bottom right panel shows what happens if the embryo is inserted in the class 0 phase. Although the absolute value of the disk fractions with a gap at ≥ 10 au varies significantly depending on our assumptions, the difference between the case where we consider consider the temperature effects and the case where we do not (the green and pink lines) remains a factor of ≳2. |
The equivalents of Eqs. E.1, E.5, and E.6 in the 3D regime are
 (E.9)
(E.9)
 (E.10)
 (E.11)
where Mc, 3−2 is the core mass at the transition from 3D to 2D pebble accretion.
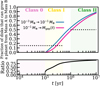 |
Fig. E.2 Comparison between the fraction of disks which can grow planets through the 3D regime (here estimated as 10−3 − 10−1 M⊕) in blue and those that can grow a planet to the gap-opening mass in the 2D regime (here estimated as >10−1 M⊕) in pink (which is the same as the pink line in Fig. 3.) |
From these we can, similarly to above, estimate the fraction of disks that can grow a planet through the 3D regime in time t. In Fig. E.2 we show that it is always greater than the fraction that can grow a gap-opening planet in the fiducial case3; thus in our toy model planets are expected to spend less time in the 3D regime and it should not be the limiting factor.
Appendix F Gravitational instability
Our discussion in Sect. 4 focused on planet formation by core accretion, starting with pebble accretion. One major potential alternative planet-forming mechanism is fragmentation due to GI. A common criterion for instability is that the disk becomes unstable when the disc-to-star mass ratio is greater than the aspect ratio. Given the aspect ratios in Tables B.1–B.3, ∼20% of disks from the Tobin et al. (2020) class 0 non-multiple mass distribution may be massive enough to be gravitationally unstable. However, fragmentation may not be the outcome of the GI instabilities if they can instead efficiently transport angular momentum and regulate the disk mass through accretion (Kratter et al. 2008). High levels of irradiation – as found in the class 0 phase - may have both stabilizing and destabilizing effects against fragmentation (Rice et al. 2011) so more dedicated modeling would be needed to deduce the fraction of embedded disks that can fragment. Nevertheless, in such young disks, fragmentation is more likely to form more massive companions on wide orbits (unless dust drag acts to lower the length/mass-scale on which the instability operates Longarini et al. 2023b,a; Baehr 2023), although the wider orbit planetary companions may migrate inward. Indeed ∼10−30% of the VANDAM survey class 0 disks host companions at 20−500 au, which may indicate a disk-fragmentation formation route distinct from the turbulent cloud fragmentation population at 1000s au (Tobin et al. 2022). Such massive companions are also likely to drive spiral density waves as well as opening gaps; spiral patterns can also form in GI turbulent disks (Kratter & Lodato 2016).
References
- Agurto-Gangas, C., Pineda, J. E., Szűcs, L., et al. 2019, A&A, 623, A147 [NASA ADS] [CrossRef] [EDP Sciences] [Google Scholar]
- Akeson, R. L., Chen, X., Ciardi, D., et al. 2013, PASP, 125, 989 [Google Scholar]
- Akiyama, E., Hasegawa, Y., Hayashi, M., & Iguchi, S., 2016, ApJ, 818, 158 [Google Scholar]
- Alcalá, J. M., Manara, C. F., Natta, A., et al. 2017, A&A, 600, A20 [NASA ADS] [CrossRef] [EDP Sciences] [Google Scholar]
- Anderson, D. E., Cleeves, L. I., Blake, G. A., et al. 2024, ApJ, 966, 84 [Google Scholar]
- Andrews, S. M., Wilner, D. J., Zhu, Z., et al. 2016, ApJ, 820, L40 [Google Scholar]
- Andrews, S. M., Huang, J., Pérez, L. M., et al. 2018, ApJ, 869, L41 [NASA ADS] [CrossRef] [Google Scholar]
- Ansdell, M., Williams, J. P., van der Marel, N., et al. 2016, ApJ, 828, 46 [Google Scholar]
- Armitage, P. J., 2010, Astrophysics of Planet Formation (Cambridge: Cambridge University Press) [Google Scholar]
- Ataiee, S., Baruteau, C., Alibert, Y., & Benz, W., 2018, A&A, 615, A110 [NASA ADS] [CrossRef] [EDP Sciences] [Google Scholar]
- Bae, J., Zhu, Z., & Hartmann, L., 2017, ApJ, 850, 201 [NASA ADS] [CrossRef] [Google Scholar]
- Bae, J., Isella, A., Zhu, Z., et al. 2023, ASP Conf. Ser., 534, 423 [NASA ADS] [Google Scholar]
- Baehr, H., 2023, MNRAS, 523, 3348 [NASA ADS] [CrossRef] [Google Scholar]
- Baraffe, I., Chabrier, G., Allard, F., & Hauschildt, P. H., 2002, A&A, 382, 563 [CrossRef] [EDP Sciences] [Google Scholar]
- Baraffe, I., Homeier, D., Allard, F., & Chabrier, G., 2015, A&A, 577, A42 [NASA ADS] [CrossRef] [EDP Sciences] [Google Scholar]
- Baruteau, C., Crida, A., Paardekooper, S. J., et al. 2014, in Protostars and Planets VI, eds. H. Beuther, R. S. Klessen, C. P. Dullemond, & T. Henning (Tucson: University of Arizona Press), 667 [Google Scholar]
- Baruteau, C., Bai, X., Mordasini, C., & Mollière, P., 2016, Space Sci. Rev., 205, 77 [CrossRef] [Google Scholar]
- Bate, M. R., 2022, MNRAS, 514, 2145 [CrossRef] [Google Scholar]
- Belloche, A., Maury, A. J., Maret, S., et al. 2020, A&A, 635, A198 [NASA ADS] [CrossRef] [EDP Sciences] [Google Scholar]
- Bitsch, B., Lambrechts, M., & Johansen, A., 2015, A&A, 582, A112 [NASA ADS] [CrossRef] [EDP Sciences] [Google Scholar]
- Bitsch, B., Morbidelli, A., Johansen, A., et al. 2018, A&A, 612, A30 [NASA ADS] [CrossRef] [EDP Sciences] [Google Scholar]
- Boss, A. P., 1997, Science, 276, 1836 [Google Scholar]
- Brouwers, M. G., Ormel, C. W., Bonsor, A., & Vazan, A., 2021, A&A, 653, A103 [NASA ADS] [CrossRef] [EDP Sciences] [Google Scholar]
- Bruderer, S., van Dishoeck, E. F., Doty, S. D., & Herczeg, G. J., 2012, A&A, 541, A91 [NASA ADS] [CrossRef] [EDP Sciences] [Google Scholar]
- Cacciapuoti, L., Macias, E., Maury, A. J., et al. 2023, A&A, 676, A4 [NASA ADS] [CrossRef] [EDP Sciences] [Google Scholar]
- Calvet, N., D’Alessio, P., Hartmann, L., et al. 2002, ApJ, 568, 1008 [Google Scholar]
- Cieza, L. A., González-Ruilova, C., Hales, A. S., et al. 2021, MNRAS, 501, 2934 [Google Scholar]
- Crida, A., Morbidelli, A., & Masset, F., 2006, Icarus, 181, 587 [Google Scholar]
- Cridland, A. J., Rosotti, G. P., Tabone, B., et al. 2022, A&A, 662, A90 [NASA ADS] [CrossRef] [EDP Sciences] [Google Scholar]
- Delussu, L., Birnstiel, T., Miotello, A., et al. 2024, A&A, 688, A81 [NASA ADS] [CrossRef] [EDP Sciences] [Google Scholar]
- Drążkowska, J., & Alibert, Y., 2017, A&A, 608, A92 [Google Scholar]
- Drążkowska, J., & Dullemond, C. P., 2018, A&A, 614, A62 [NASA ADS] [CrossRef] [EDP Sciences] [Google Scholar]
- Drążkowska, J., Stammler, S. M., & Birnstiel, T., 2021, A&A, 647, A15 [Google Scholar]
- Drążkowska, J., Bitsch, B., Lambrechts, M., et al. 2023, ASP Conf. Ser., 534, 717 [NASA ADS] [Google Scholar]
- Dullemond, C. P., & Dominik, C., 2004, A&A, 421, 1075 [NASA ADS] [CrossRef] [EDP Sciences] [Google Scholar]
- Dullemond, C. P., Juhasz, A., Pohl, A., et al. 2012, Astrophysics Source Code Library [record ascl:1202.015] [Google Scholar]
- Dunham, M. M., Evans, Neal J., I., Terebey, S., Dullemond, C. P., & Young, C. H. 2010, ApJ, 710, 470 [NASA ADS] [CrossRef] [Google Scholar]
- Encalada, F. J., Looney, L. W., Takakuwa, S., et al. 2024, ApJ, 966, 32 [NASA ADS] [CrossRef] [Google Scholar]
- Evans, Neal J., I., Dunham, M. M., Jørgensen, J. K., et al. 2009, ApJS, 181, 321 [NASA ADS] [CrossRef] [Google Scholar]
- Fedele, D., Carney, M., Hogerheijde, M. R., et al. 2017, A&A, 600, A72 [NASA ADS] [CrossRef] [EDP Sciences] [Google Scholar]
- Fiorellino, E., Tychoniec, Ś., Cruz-Sáenz de Miera, F., et al. 2023, ApJ, 944, 135 [NASA ADS] [CrossRef] [Google Scholar]
- Fischer, W. J., Megeath, S. T., Furlan, E., et al. 2017, ApJ, 840, 69 [NASA ADS] [CrossRef] [Google Scholar]
- Flock, M., Ruge, J. P., Dzyurkevich, N., et al. 2015, A&A, 574, A68 [NASA ADS] [CrossRef] [EDP Sciences] [Google Scholar]
- Francis, L., & van der Marel, N., 2020, ApJ, 892, 111 [Google Scholar]
- Goldreich, P., Lithwick, Y., & Sari, R., 2004, ARA&A, 42, 549 [NASA ADS] [CrossRef] [Google Scholar]
- Guerra-Alvarado, O. M., van der Marel, N., Di Francesco, J., et al. 2024, A&A, 681, A82 [NASA ADS] [CrossRef] [EDP Sciences] [Google Scholar]
- Guilera, O. M., & Sándor, Z., 2017, A&A, 604, A10 [Google Scholar]
- Harsono, D., Bruderer, S., & van Dishoeck, E. F., 2015, A&A, 582, A41 [NASA ADS] [CrossRef] [EDP Sciences] [Google Scholar]
- Harsono, D., Bjerkeli, P., van der Wiel, M. H. D., et al. 2018, Nat. Astron., 2, 646 [Google Scholar]
- Hartmann, L., Herczeg, G., & Calvet, N., 2016, ARA&A, 54, 135 [Google Scholar]
- Hsieh, C.-H., Arce, H. G., Maureira, M. J., et al. 2024, ApJ, 973, 138 [NASA ADS] [CrossRef] [Google Scholar]
- Johansen, A., Oishi, J. S., Mac Low, M.-M., et al. 2007, Nature, 448, 1022 [Google Scholar]
- Johansen, A., Blum, J., Tanaka, H., et al. 2014, in Protostars and Planets VI, eds. H. Beuther, R. S. Klessen, C. P. Dullemond, & T. Henning (Tucson: University of Arizona Press), 547 [Google Scholar]
- Jørgensen, J. K., van der Wiel, M. H. D., Coutens, A., et al. 2016, A&A, 595, A117 [Google Scholar]
- Kamp, I., & Dullemond, C. P., 2004, ApJ, 615, 991 [NASA ADS] [CrossRef] [Google Scholar]
- Koga, S., Kawasaki, Y., & Machida, M. N., 2022, MNRAS, 515, 6073 [NASA ADS] [CrossRef] [Google Scholar]
- Kratter, K., & Lodato, G., 2016, ARA&A, 54, 271 [NASA ADS] [CrossRef] [Google Scholar]
- Kratter, K. M., Matzner, C. D., & Krumholz, M. R., 2008, ApJ, 681, 375 [NASA ADS] [CrossRef] [Google Scholar]
- Kristensen, L. E., van Dishoeck, E. F., Bergin, E. A., et al. 2012, A&A, 542, A8 [NASA ADS] [CrossRef] [EDP Sciences] [Google Scholar]
- Kwon, W., Looney, L. W., Mundy, L. G., Chiang, H.-F., & Kemball, A. J., 2009, ApJ, 696, 841 [NASA ADS] [CrossRef] [Google Scholar]
- Lambrechts, M., & Johansen, A., 2012, A&A, 544, A32 [NASA ADS] [CrossRef] [EDP Sciences] [Google Scholar]
- Lambrechts, M., & Johansen, A., 2014, A&A, 572, A107 [NASA ADS] [CrossRef] [EDP Sciences] [Google Scholar]
- Lambrechts, M., Johansen, A., & Morbidelli, A., 2014, A&A, 572, A35 [NASA ADS] [CrossRef] [EDP Sciences] [Google Scholar]
- Lau, T. C. H., Birnstiel, T., Drążkowska, J., & Stammler, S. M., 2024, A&A, 688, A22 [NASA ADS] [CrossRef] [EDP Sciences] [Google Scholar]
- Law, C. J., Crystian, S., Teague, R., et al. 2022, ApJ, 932, 114 [NASA ADS] [CrossRef] [Google Scholar]
- Lebreuilly, U., Vallucci-Goy, V., Guillet, V., Lombart, M., & Marchand, P., 2023, MNRAS, 518, 3326 [Google Scholar]
- Lee, C.-F., Codella, C., Ceccarelli, C., & López-Sepulcre, A., 2022, ApJ, 937, 10 [NASA ADS] [CrossRef] [Google Scholar]
- Lim, J., Simon, J. B., Li, R., et al. 2024, ApJ, 969, 130 [NASA ADS] [CrossRef] [Google Scholar]
- Lin, D. N. C., & Papaloizou, J. C. B., 1993, in Protostars and Planets III (Tucson: University of Arizona Press), eds. E. H. Levy, & J. I. Lunine, 749 [Google Scholar]
- Lin, Z.-Y. D., Li, Z.-Y., Tobin, J. J., et al. 2023, ApJ, 951, 9 [NASA ADS] [CrossRef] [Google Scholar]
- Lissauer, J. J., 1993, ARA&A, 31, 129 [NASA ADS] [CrossRef] [Google Scholar]
- Liu, B., & Ji, J., 2020, Res. Astron. Astrophys., 20, 164 [Google Scholar]
- Liu, Y., Dipierro, G., Ragusa, E., et al. 2019, A&A, 622, A75 [NASA ADS] [CrossRef] [EDP Sciences] [Google Scholar]
- Lodato, G., Dipierro, G., Ragusa, E., et al. 2019, MNRAS, 486, 453 [Google Scholar]
- Long, F., Pinilla, P., Herczeg, G. J., et al. 2018, ApJ, 869, 17 [Google Scholar]
- Long, F., Andrews, S. M., Rosotti, G., et al. 2022, ApJ, 931, 6 [NASA ADS] [CrossRef] [Google Scholar]
- Long, F., Ren, B. B., Wallack, N. L., et al. 2023, ApJ, 949, 27 [NASA ADS] [CrossRef] [Google Scholar]
- Longarini, C., Armitage, P. J., Lodato, G., Price, D. J., & Ceppi, S., 2020a, MNRAS, 522, 6217 [Google Scholar]
- Longarini, C., Lodato, G., Bertin, G., & Armitage, P. J., 2020b, MNRAS, 519, 2017 [Google Scholar]
- Loomis, R. A., Öberg, K. I., Andrews, S. M., et al. 2020, ApJ, 893, 101 [Google Scholar]
- Lyra, W., Johansen, A., Klahr, H., & Piskunov, N., 2008, A&A, 491, L41 [NASA ADS] [CrossRef] [EDP Sciences] [Google Scholar]
- Lyra, W., Yang, C.-C., Simon, J. B., Umurhan, O. M., & Youdin, A. N., 2024, ApJ, 970, L19 [Google Scholar]
- Manara, C. F., Morbidelli, A., & Guillot, T., 2018, A&A, 618, L3 [NASA ADS] [CrossRef] [EDP Sciences] [Google Scholar]
- Manara, C. F., Ansdell, M., Rosotti, G. P., et al. 2023, ASP Conf. Ser., 534, 539 [NASA ADS] [Google Scholar]
- Meru, F., Rosotti, G. P., Booth, R. A., Nazari, P., & Clarke, C. J., 2019, MNRAS, 482, 3678 [Google Scholar]
- Meyer, M. R., Calvet, N., & Hillenbrand, L. A., 1997, AJ, 114, 288 [Google Scholar]
- Miotello, A., van Dishoeck, E. F., Kama, M., & Bruderer, S., 2016, A&A, 594, A85 [NASA ADS] [CrossRef] [EDP Sciences] [Google Scholar]
- Morbidelli, A., 2020, A&A, 638, A1 [Google Scholar]
- Najita, J. R., & Kenyon, S. J., 2014, MNRAS, 445, 3315 [NASA ADS] [CrossRef] [Google Scholar]
- Narang, M., Manoj, P., Tyagi, H., et al. 2024, ApJ, 962, L16 [NASA ADS] [CrossRef] [Google Scholar]
- Nazari, P., Tabone, B., Rosotti, G. P., et al. 2022, A&A, 663, A58 [NASA ADS] [CrossRef] [EDP Sciences] [Google Scholar]
- Nazari, P., Tabone, B., & Rosotti, G. P., 2023, A&A, 671, A 107 [Google Scholar]
- Nazari, P., Cheung, J. S. Y., Asensio, J. F., et al. 2024a, A&A, 686, A59 [NASA ADS] [CrossRef] [EDP Sciences] [Google Scholar]
- Nazari, P., Tabone, B., Ahmadi, A., et al. 2024b, A&A, 686, A201 [NASA ADS] [CrossRef] [EDP Sciences] [Google Scholar]
- Ndugu, N., Bitsch, B., & Jurua, E., 2019, MNRAS, 488, 3625 [CrossRef] [Google Scholar]
- Ohashi, N., Tobin, J. J., Jørgensen, J. K., et al. 2023, ApJ, 951, 8 [NASA ADS] [CrossRef] [Google Scholar]
- Ormel, C. W., & Klahr, H. H., 2010, A&A, 520, A43 [NASA ADS] [CrossRef] [EDP Sciences] [Google Scholar]
- Ormel, C. W., Vazan, A., & Brouwers, M. G., 2021, A&A, 647, A175 [NASA ADS] [CrossRef] [EDP Sciences] [Google Scholar]
- Ossenkopf, V., & Henning, T., 1994, A&A, 291, 943 [NASA ADS] [Google Scholar]
- Paardekooper, S. J., & Mellema, G., 2006, A&A, 459, L17 [CrossRef] [EDP Sciences] [Google Scholar]
- Paneque-Carreño, T., Miotello, A., van Dishoeck, E. F., et al. 2022, A&A, 666, A168 [NASA ADS] [CrossRef] [EDP Sciences] [Google Scholar]
- Pinilla, P., Tazzari, M., Pascucci, I., et al. 2018, ApJ, 859, 32 [Google Scholar]
- Pinte, C., Ménard, F., Duchêne, G., et al. 2018, A&A, 609, A47 [NASA ADS] [CrossRef] [EDP Sciences] [Google Scholar]
- Pokhrel, R., Megeath, S. T., Gutermuth, R. A., et al. 2023, ApJS, 266, 32 [NASA ADS] [CrossRef] [Google Scholar]
- Pollack, J. B., Hubickyj, O., Bodenheimer, P., et al. 1996, Icarus, 124, 62 [NASA ADS] [CrossRef] [Google Scholar]
- Qiao, L., Coleman, G. A. L., & Haworth, T. J., 2023, MNRAS, 522, 1939 [NASA ADS] [CrossRef] [Google Scholar]
- Rice, W. K. M., Armitage, P. J., Mamatsashvili, G. R., Lodato, G., & Clarke, C. J., 2011, MNRAS, 418, 1356 [Google Scholar]
- Rosenthal, L. J., Knutson, H. A., Chachan, Y., et al. 2022, ApJS, 262, 1 [Google Scholar]
- Rosotti, G. P., Juhasz, A., Booth, R. A., & Clarke, C. J., 2016, MNRAS, 459, 2790 [Google Scholar]
- Ruzza, A., Lodato, G., & Rosotti, G. P., 2024, A&A, 685, A65 [NASA ADS] [CrossRef] [EDP Sciences] [Google Scholar]
- Sándor, Z., Guilera, O. M., Regály, Z., & Lyra, W., 2024, A&A, 686, A78 [NASA ADS] [CrossRef] [EDP Sciences] [Google Scholar]
- Savvidou, S., & Bitsch, B., 2023, A&A, 679, A42 [NASA ADS] [CrossRef] [EDP Sciences] [Google Scholar]
- Savvidou, S., & Bitsch, B., 2025, A&A, 693, A302 [NASA ADS] [Google Scholar]
- Segura-Cox, D. M., Schmiedeke, A., Pineda, J. E., et al. 2020, Nature, 586, 228 [NASA ADS] [CrossRef] [Google Scholar]
- Sellek, A. D., Booth, R. A., & Clarke, C. J., 2020, MNRAS, 498, 2845 [NASA ADS] [CrossRef] [Google Scholar]
- Shakura, N. I., & Sunyaev, R. A., 1973, A&A, 24, 337 [NASA ADS] [Google Scholar]
- Sharma, R., Jørgensen, J. K., Gavino, S., et al. 2023, ApJ, 954, 69 [NASA ADS] [CrossRef] [Google Scholar]
- Sheehan, P. D., & Eisner, J. A., 2018, ApJ, 857, 18 [NASA ADS] [CrossRef] [Google Scholar]
- Sheehan, P. D., Tobin, J. J., Federman, S., Megeath, S. T., & Looney, L. W., 2020, ApJ, 902, 141 [Google Scholar]
- Sheehan, P. D., Tobin, J. J., Li, Z.-Y., et al. 2022, ApJ, 934, 95 [NASA ADS] [CrossRef] [Google Scholar]
- Sinclair, C. A., Rosotti, G. P., Juhasz, A., & Clarke, C. J., 2020, MNRAS, 493, 3535 [Google Scholar]
- Takahashi, S. Z., & Inutsuka, S.-i., 2016, AJ, 152, 184 [Google Scholar]
- Takakuwa, S., Saigo, K., Kido, M., et al. 2024, ApJ, 964, 24 [NASA ADS] [CrossRef] [Google Scholar]
- Tanaka, Y. A., & Tsukamoto, Y., 2019, MNRAS, 484, 1574 [NASA ADS] [CrossRef] [Google Scholar]
- Testi, L., Birnstiel, T., Ricci, L., et al. 2014, in Protostars and Planets VI, eds. H. Beuther, R. S. Klessen, C. P. Dullemond, & T. Henning (Tucson: University of Arizona Press), 339 [Google Scholar]
- Thi, W. F., van Zadelhoff, G. J., & van Dishoeck, E. F., 2004, A&A, 425, 955 [NASA ADS] [CrossRef] [EDP Sciences] [Google Scholar]
- Thorngren, D. P., Fortney, J. J., Murray-Clay, R. A., & Lopez, E. D., 2016, ApJ, 831, 64 [NASA ADS] [CrossRef] [Google Scholar]
- Tobin, J. J., & Sheehan, P. D., 2024, ARA&A, 62, 203 [NASA ADS] [CrossRef] [Google Scholar]
- Tobin, J. J., Sheehan, P. D., Megeath, S. T., et al. 2020, ApJ, 890, 130 [CrossRef] [Google Scholar]
- Tobin, J. J., Offner, S. S. R., Kratter, K. M., et al. 2022, ApJ, 925, 39 [NASA ADS] [CrossRef] [Google Scholar]
- Tsukamoto, Y., Okuzumi, S., & Kataoka, A., 2017, ApJ, 838, 151 [NASA ADS] [CrossRef] [Google Scholar]
- Tychoniec, Ś., Tobin, J. J., Karska, A., et al. 2018, ApJS, 238, 19 [NASA ADS] [CrossRef] [Google Scholar]
- Tychoniec, Ś., Manara, C. F., Rosotti, G. P., et al. 2020, A&A, 640, A19 [NASA ADS] [CrossRef] [EDP Sciences] [Google Scholar]
- Tzouvanou, A., Bitsch, B., & Pichierri, G., 2023, A&A, 677, A82 [NASA ADS] [CrossRef] [EDP Sciences] [Google Scholar]
- van der Marel, N., & Mulders, G. D., 2021, AJ, 162, 28 [NASA ADS] [CrossRef] [Google Scholar]
- van’t Hoff, M. L. R., Harsono, D., Tobin, J. J., et al. 2020, ApJ, 901, 166 [Google Scholar]
- van’t Hoff, M. L. R., Tobin, J. J., Li, Z.-Y., et al. 2023, ApJ, 951, 10 [CrossRef] [Google Scholar]
- Villenave, M., Ménard, F., Dent, W. R. F., et al. 2020, A&A, 642, A164 [EDP Sciences] [Google Scholar]
- Villenave, M., Podio, L., Duchêne, G., et al. 2023, ApJ, 946, 70 [NASA ADS] [CrossRef] [Google Scholar]
- Visser, R., van Dishoeck, E. F., Doty, S. D., & Dullemond, C. P., 2009, A&A, 495, 881 [NASA ADS] [CrossRef] [EDP Sciences] [Google Scholar]
- Voelkel, O., Klahr, H., Mordasini, C., Emsenhuber, A., & Lenz, C., 2020, A&A, 642, A75 [NASA ADS] [CrossRef] [EDP Sciences] [Google Scholar]
- Vorobyov, E. I., Kulikov, I., Elbakyan, V. G., McKevitt, J., & Güdel, M., 2024, A&A, 683, A202 [NASA ADS] [CrossRef] [EDP Sciences] [Google Scholar]
- Winter, A. J., & Haworth, T. J., 2022, EPJ Plus, 137, 1132 [NASA ADS] [Google Scholar]
- Woitke, P., Min, M., Pinte, C., et al. 2016, A&A, 586, A103 [NASA ADS] [CrossRef] [EDP Sciences] [Google Scholar]
- Wuchterl, G., Guillot, T., & Lissauer, J. J., 2000, in Protostars and Planets IV, eds. V. Mannings, A. P. Boss, & S. S. Russell (Tucson: University of Arizona Press), 1081 [Google Scholar]
- Yang, C.-C., Johansen, A., & Carrera, D., 2017, A&A, 606, A80 [NASA ADS] [CrossRef] [EDP Sciences] [Google Scholar]
- Yang, Y.-L., Sakai, N., Zhang, Y., et al. 2021, ApJ, 910, 20 [Google Scholar]
- Youdin, A. N., & Goodman, J., 2005, ApJ, 620, 459 [Google Scholar]
- Zhang, K., Blake, G. A., & Bergin, E. A., 2015, ApJ, 806, L7 [Google Scholar]
- Zhu, W., & Dong, S., 2021, ARA&A, 59, 291 [NASA ADS] [CrossRef] [Google Scholar]
The pebble fluxes used in the prescription of Lambrechts & Johansen (2014) are likely an upper limit, since they are only valid in the limit where fragmentation does not limit grain sizes and so long as the pebbles do not grow beyond a Stokes number of 1 (Drążkowska et al. 2021).
This results from the different mass ranges considered; if the 2D rates were used for the same mass range they would produce even higher fractions.
All Tables
All Figures
|
Fig. 1 Evolution of various parameters as the protostar ages for a final protostellar mass of 0.5 M⊙. (a) Evolution of envelope and protostellar mass. (b) Evolution of accretion and protostellar luminosity. (c) Evolution of protostellar radius and effective temperature. The filled circles indicate the nine distinct times that we have chosen to run the radiative transfer models. Shaded pink, yellow, and green areas roughly indicate the different classes. |
| In the text | |
|
Fig. 2 Evolution of disk aspect ratio (top) and minimum planet mass required to open a gap (bottom) from young class 0 disks (lighter colors) to mature class II disks (darker colors) for different final protostellar masses. These models are those with small dust grains (0.1 μ m). The dashed gray line presents the radius of the disk assumed in these models. The typical masses of giant and rocky planets are taken from Zhu & Dong (2021) (also see Akeson et al. 2013). Up to ∼50 M⊕ of a giant planet and an entire rocky planet would create no sign of a dust gap if formed in the protostellar phase (t < 2 × 10⁵ yr). |
| In the text | |
|
Fig. 3 Left: range of minimum gap-opening planet mass from the entire grid of models at 10 au as a function of time. The stars show the mean at each time. A fit function to the results of the models for M⋆, f = 0.5 M⊙ is shown with a dashed gray line. Upper right: fraction of disks that can open a gap at radii ≥ 10 au if planets grow at the maximum rate allowed by pebble accretion (see text for details), assuming a gap-opening mass changing with time (solid pink line) found from the dashed gray line in the left panel. This provides an upper limit on the number of observable substructures that are opened by planets. The green line shows the same but for a gap-opening planet mass at 1 Myr (i.e., ∼15 M⊕). The dotted black lines roughly indicate the substructure occurrence rate in observed disks. Lower right: pink line divided by the green line from the panel above showing the factor by which temperature effects alone reduce the number of gapped disks. The shaded background colors roughly show the different classes. |
| In the text | |
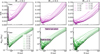 |
Fig. C.1 Same as Fig. 2 but for models with disk radius of 100 au. |
| In the text | |
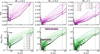 |
Fig. C.2 Same as Fig. 2 but for models with large dust grains. |
| In the text | |
|
Fig. E.1 Same as right column of Fig. 3 (top left here), showing the effect of varying several parameters that are inputted in our toy model. The top right assumes a smaller initial embryo mass, bottom left presents the case where the pebble flux is decreased by a factor of 10 and bottom right panel shows what happens if the embryo is inserted in the class 0 phase. Although the absolute value of the disk fractions with a gap at ≥ 10 au varies significantly depending on our assumptions, the difference between the case where we consider consider the temperature effects and the case where we do not (the green and pink lines) remains a factor of ≳2. |
| In the text | |
|
Fig. E.2 Comparison between the fraction of disks which can grow planets through the 3D regime (here estimated as 10−3 − 10−1 M⊕) in blue and those that can grow a planet to the gap-opening mass in the 2D regime (here estimated as >10−1 M⊕) in pink (which is the same as the pink line in Fig. 3.) |
| In the text | |
Current usage metrics show cumulative count of Article Views (full-text article views including HTML views, PDF and ePub downloads, according to the available data) and Abstracts Views on Vision4Press platform.
Data correspond to usage on the plateform after 2015. The current usage metrics is available 48-96 hours after online publication and is updated daily on week days.
Initial download of the metrics may take a while.