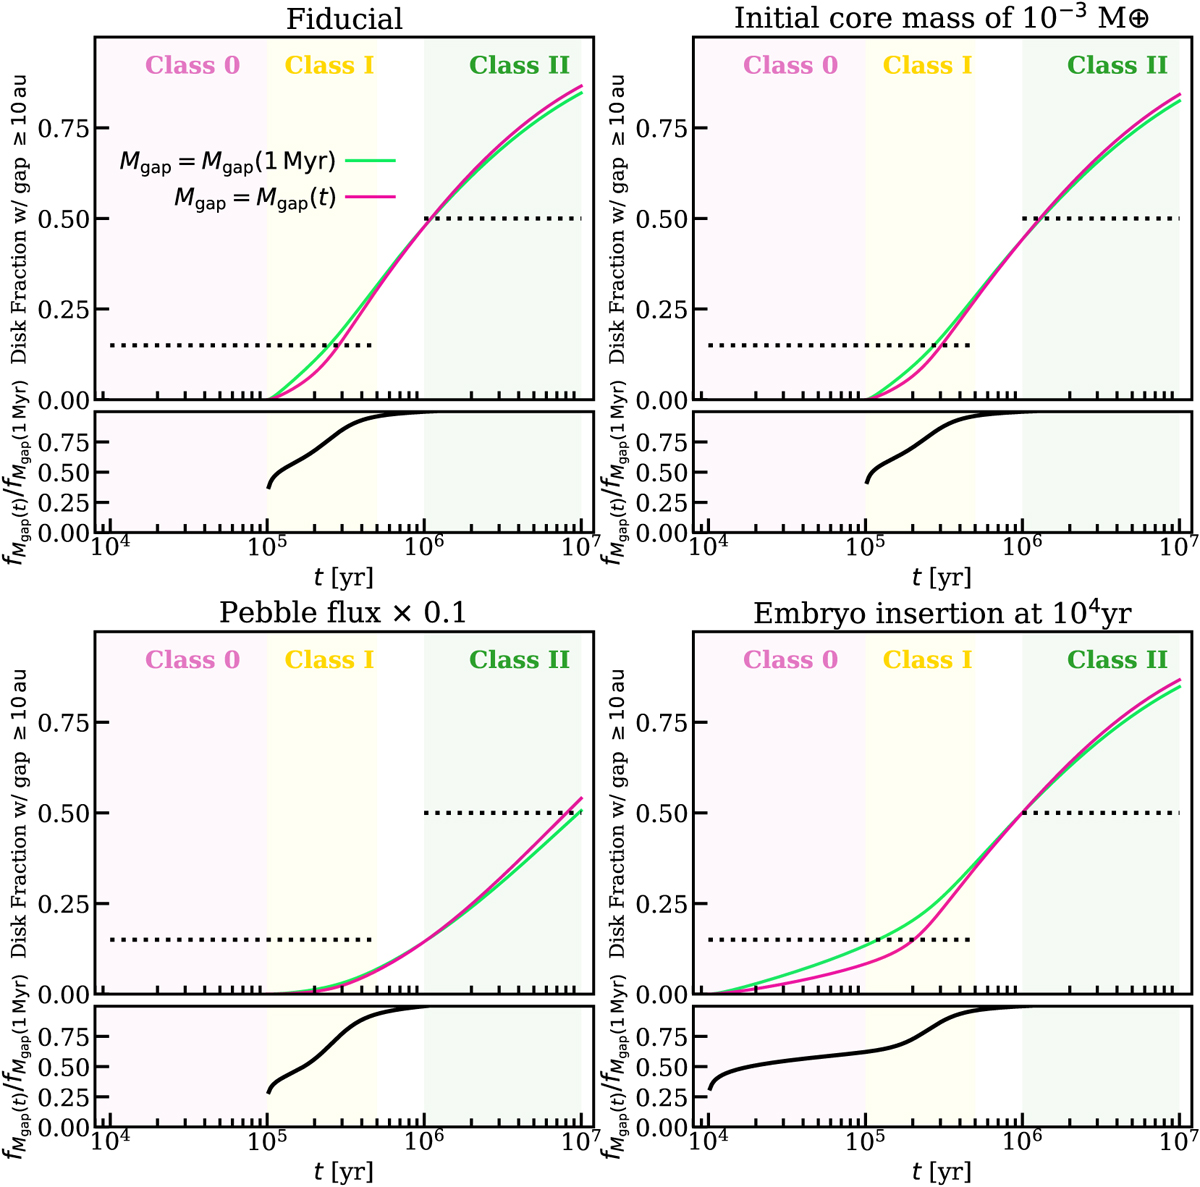
Fig. E.1
Download original image
Same as right column of Fig. 3 (top left here), showing the effect of varying several parameters that are inputted in our toy model. The top right assumes a smaller initial embryo mass, bottom left presents the case where the pebble flux is decreased by a factor of 10 and bottom right panel shows what happens if the embryo is inserted in the class 0 phase. Although the absolute value of the disk fractions with a gap at ≥ 10 au varies significantly depending on our assumptions, the difference between the case where we consider consider the temperature effects and the case where we do not (the green and pink lines) remains a factor of ≳2.
Current usage metrics show cumulative count of Article Views (full-text article views including HTML views, PDF and ePub downloads, according to the available data) and Abstracts Views on Vision4Press platform.
Data correspond to usage on the plateform after 2015. The current usage metrics is available 48-96 hours after online publication and is updated daily on week days.
Initial download of the metrics may take a while.