| Issue |
A&A
Volume 693, January 2025
|
|
|---|---|---|
| Article Number | A302 | |
| Number of page(s) | 9 | |
| Section | Planets, planetary systems, and small bodies | |
| DOI | https://doi.org/10.1051/0004-6361/202449847 | |
| Published online | 28 January 2025 | |
There is no disk mass budget problem of planet formation
1
Max-Planck-Institut für Astronomie,
Königstuhl 17,
69117
Heidelberg,
Germany
2
Department of Physics, University College Cork,
Cork,
Ireland
★ Corresponding author; This email address is being protected from spambots. You need JavaScript enabled to view it.
Received:
4
March
2024
Accepted:
13
December
2024
Abstract
The inferred dust masses from Class II protoplanetary disk observations are lower than or equal to the masses of the observed exoplanet systems. This poses the question of how planets form if their natal environments do not contain enough mass. This hypothesis has entered the literature as the “mass budget problem” of planet formation. We utilized numerical simulations of planet formation via pebble and gas accretion, including migration, in a viscously evolving protoplanetary disk, while tracing the time evolution of the dust mass. As expected, we found that the presence of a giant planet in the disk can influence the evolution of the disk itself and prevent rapid dust mass loss by trapping the dust outside its orbit. Early formation is crucial for giant planet formation, as we found in our previous work; therefore, our findings strengthen the hypothesis that planet formation has already occurred or is ongoing in Class II disks. More importantly, we find that the optically thin dust mass significantly underestimates the total dust mass in the presence of a dust-trapping deep gap. We also show that the beam convolution smears out the feature from a deep gap, especially if the planet forms in the inner disk. Such hidden dust mass, along with early planet formation, could be the answer to the hypothetical mass budget problem.
Key words: methods: numerical / planets and satellites: formation / planets and satellites: gaseous planets / protoplanetary disks / circumstellar matter
© The Authors 2025
 Open Access article, published by EDP Sciences, under the terms of the Creative Commons Attribution License (https://creativecommons.org/licenses/by/4.0), which permits unrestricted use, distribution, and reproduction in any medium, provided the original work is properly cited.
This article is published in open access under the Subscribe to Open model.
Open Access funding provided by Max Planck Society.
1 Introduction
In the last decade, dust masses of disks have been estimated for several star-forming regions (e.g., Andrews et al. 2013; Ansdell et al. 2016, 2017; Barenfeld et al. 2016; Pascucci et al. 2016; Cieza et al. 2019; Cazzoletti et al. 2019; Tychoniec et al. 2018, 2020; Villenave et al. 2021; Tobin et al. 2020; van Terwisga et al. 2022) and for some open clusters (e.g., Eisner et al. 2018; Ruíz-Rodríguez et al. 2018). However, an open question remains of how we can accurately measure the dust and gas mass budget of disks. If the answer is that we have accurate measurements and that we assume that Class II disks are the natal environments of forming planets, then a mass budget problem arises. The estimated disk masses are much lower than the inferred planetary system masses of the observed exoplanets (Greaves & Rice 2010; Najita & Kenyon 2014; Mulders et al. 2015, 2018), implying that there is not enough material to form planets.
Dust mass estimations in studies, such as the ones mentioned above, usually follow a flux-to-mass conversion initially proposed by Hildebrand (1983), which is therefore based on modeling and several assumptions. Among other parameters, universal and constant opacity and temperature, optically thin emission, unknown chemical abundances or grain structure, and uncertain stellar ages are used, which generally lead to underestimated masses. It is also assumed that most of the solid mass is in millimeter-sized grains (see also Miotello et al. 2023; Manara et al. 2023). Alternative ways to measure the dust mass have been explored, for example through the dust lines (Powell et al. 2017, 2019; Franceschi et al. 2022), but these methods still have some limitations and lead to overestimated masses.
Then, the conversion to total disk mass (gas+dust) is usually done considering an interstellar medium- or solar-like dust-to-gas ratio of 1% to ~1.5%. However, several studies find that the dust-to-gas ratio can be higher than 1% (e.g., Appelgren et al. 2020; Kama et al. 2020). Especially in regions with significant dust trapping, it is unreasonable to assume that any initial dust-to-gas ratio will remain relevant.
Recently, there has been increasing work contemplating whether these limitations of the dust mass estimates could lead to significantly underestimated masses (Galván-Madrid et al. 2018; Ballering & Eisner 2019; Zhu et al. 2019; Bergez-Casalou et al. 2022). Manara et al. (2018) suggest that another possible way out of this problem could be early planet formation, so that it is already ongoing in observations of early protoplanetary disk evolutionary stages (younger than 3 Myr).
There is increasing evidence that this is the case; for instance, Harsono et al. (2018) reported dust growth to millimeter sizes for a very young disk (around 0.1 Myr) around a solar-type protostar, while Sheehan & Eisner (2018); Segura-Cox et al. (2020), and Cieza et al. (2021) find disk substructures already in very young disks (younger than 1 Myr), which is not necessarily expected from the formation of the disk. Such observed substructures in disks (e.g., gaps or rings) can be theoretically expected outcomes of the formation processes for planets with high enough masses. There are also meteorological analyses confirming that some of the building blocks of the Solar System formed within 1 Myr (Kruijer et al. 2017; Wadhwa et al. 2020). These observations all point to dust growth being very efficient even as the disk itself is still forming, and would thus allow early planet formation.
From a theoretical point of view, this possibility is also supported by the pebble accretion scenario because it can provide high pebble accretion rates at the earliest stages of evolution (Bitsch et al. 2015; Johansen et al. 2019; Tanaka & Tsukamoto 2019). Additionally, Appelgren et al. (2020) find that the observed low disk dust masses at later evolutionary stages can be consistent with even very massive young disks that experience rapid radial dust drift.
In our previous work (Savvidou & Bitsch 2023), we performed numerical simulations of planet formation through pebble and gas accretion, including migration, in viscously evolving protoplanetary disks, and investigated how the disk conditions influence the resulting planetary masses. Here we utilize the same set of simulations and discuss how the dust evolves during the planet formation process and what this implies for the hypothesis of the disk mass budget problem.
2 Methods
2.1 Model and parameters used
The model was described in detail in Savvidou & Bitsch (2023). Briefly, the numerical simulations of planet formation in a protoplanetary disk include pebble growth and drift (Birnstiel et al. 2012), pebble evaporation and condensation at ice lines (Schneider & Bitsch 2021), planet growth via pebble (Johansen & Lambrechts 2017) and gas accretion (Ndugu et al. 2021), and planet migration (Paardekooper et al. 2011). The initial planetary mass of the embryos is determined by the pebble transition mass at which the planet starts efficient accretion from the Hill regime (Lambrechts & Johansen 2012). For these simulations, we used the ID semi-analytic chemcomp code (Schneider & Bitsch 2021). We note that we do not include planetesimal formation and we do not include dust filtering across gaps. An extended discussion about the limitations of our models is in Sect. 5.
Each simulation contained one growing planet, and we assumed that the star was of solar mass. We performed a parameter study where the α-viscosity parameter ranges from 0.0001 to 0.001, the initial disk mass ranges from 0.01 to 0.1 M⊙, the initial disk radius ranges from 50 to 200 AU, the dust fragmentation velocity ranges from 1 to 10 m/s, and the planetary embryos are placed in the disk from 1 to 50 AU, with starting times from 0.1 to 1.3 Myr (Table A.1; see also Savvidou & Bitsch 2023). Our whole sample is thus all possible combinations of these parameters (first six in Table A.1) and two different values of the dust-to-gas ratio (78400 runs). The standard set of parameters used to discuss the example cases is in bold in Table A.1.
2.2 Optically thin dust mass estimates
The continuum flux of the dust emission obtained from observations is converted to a dust mass via the Hildebrand (1983) approximation
 (1)
(1)
assuming that the emission is optically thin and is well described by an average dust temperature  (Andrews & Williams 2005) and an average opacity
  (Beckwith et al. 1990). In the Rayleigh- Jeans approximation (relevant for large wavelengths), the Planck spectrum is written
 (2)
(2)
The intensity (for an optically thin emission) is written as
 (3)
(3)
where τλ is the optical depth. In the Rayleigh–Jeans limit the intensity is then
 (4)
(4)
The surface density  corresponds to the disk regions in our models where the disk is optically thin (τλ <1). We used the flux-to-mass approximation of Eq. (1) to estimate the disk dust masses from our models with the same assumptions as in the observed sources and to compare them with the actual dust masses of the modeled disks.
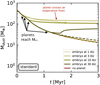 |
Fig. 1 Dust mass as a function of time for the same planets as in Fig. 1 in Savvidou & Bitsch (2023), using the standard set of parameters (Table A.1). The dashed lines show the time evolution of the optically thin dust mass and the red line shows the time evolution of the dust mass for a simulation without a planet. The dot marks the last dust mass if a planet reaches the inner edge of the disk. |
3 Dust mass evolution during planet formation
3.1 Example cases
In Fig. 1, we show the time evolution of the dust mass for four embryos that started growing at 1, 3, 10, and 30 AU (solid green lines), along with a simulation without a planet (solid red line). The examples shown here are the same simulations as in Fig. 1 in Savvidou & Bitsch (2023). We also estimate the dust mass according to Eq. (1), using the surface density in the optically thin regions only (dashed green lines). Some of the planets (mainly those originating from 1 AU; see Figs. 1 and 2 in Savvidou & Bitsch 2023) reach the inner edge of the disks in our models long before the gas dissipates. In this case we no longer plot the dust evolution, and we indicate with circles the dust mass at the time when they reach the inner edge. The solid circles correspond to the total dust mass, and the open circles correspond to the optically thin dust mass.
Without any planet growing, the dust decreases as it drifts inward and evaporates at the icelines or is lost by stellar accretion. The dust mass evolution in our models where planets are growing is heavily dependent on the growth evolution of the planet. The embryos originating at 1, 3, and 10 AU reach the pebble isolation mass within 0.5 Myr (shown in Fig. 1 in Savvidou & Bitsch 2023), and begin effectively blocking the drifting dust exterior to their orbit (marked with the arrow in Fig. 1). Therefore, the dust content in these disks almost plateaus beyond 0.5 Myr. The amount of dust blocked in our models depends on several things, such as the location of the embryo and how long it took until the planet reached the pebble isolation mass and trapped the dust. For example, the planet originating at 10 AU reaches the pebble isolation mass earlier, and there is more dust mass exterior to its orbit compared to the one originating at 30 AU; therefore, more dust gets trapped.
In the disk with the planet originating at 30 AU, the dust mass increases shortly after 1.5 Myr. Initially, the pebbles drift inward and evaporate; thus, the dust mass decreases. Then the planet starts growing and opens a gap; however, the position of the planet is such that the pressure bump generated by the opening gap is close to an evaporation front. As the planet becomes more massive, the gap it opens becomes wider, and therefore the peak of the pressure bump moves outward. Then some amount of volatiles diffuses over the evaporation front again, recondenses, and increases the dust mass.
The optically thin dust masses for all of the models (dashed green lines) evolve similarly to the dust mass in a disk without a planet, regardless of the initial location of the embryo, its orbital evolution, and its final mass. The difference between the total dust mass and the optically thin dust mass is almost one order of magnitude. Even though giant planets generate a pressure bump where many particles can be trapped, the optically thin approximation underestimates the real dust mass.
In Fig. 2, we only change one parameter at a time, as in Fig. 2 in Savvidou & Bitsch (2023). In that work we showed that no giant planet forms when the initial disk mass is low (top left plot), due to the lack of enough solid material to build a massive core, or when the embryo is injected too late (top middle plot). Without a giant planet to block the dust, it drifts and decreases even within 0.5 Myr. The evolution is hence the same under the optically thin dust assumption and for the model without a planet. The same is true for the planet originating at 30 AU in the disk with a radius of 50 AU (bottom left plot) that did not reach the pebble isolation mass. In the rest of the examples for this case, the dust mass stops decreasing after the planet opens a massive gap in the disk.
As a giant planet moves, it carries the pressure bump with it (and thus the pebbles). Once it crosses an evaporation front, pebbles evaporate and there is a dip (a sharp decrease) in the total dust mass; examples of this are shown in Fig. 1, for the disk with a planet originating at 1 AU, and Fig. 2 (middle left plot), for the planet that originated at 1 AU (marked with red arrows). These dips are proportional to the amount of material that evaporates, so larger dips are expected if the planet crosses evaporation fronts corresponding to more abundant species. Additionally, the dips are more numerous for α=0.001 because the planets migrate faster in that case and cross multiple evaporation fronts.
Overall, we find that when a massive core forms and opens a gap in the disk, the remaining dust mass in the disk is significantly higher than that estimated with the optically thin dust mass assumption. The sooner the gap opens, the larger the difference between the total dust mass near the end of the disk lifetime and the optically thin estimate. In most cases this difference is at least one order of magnitude.
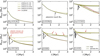 |
Fig. 2 Same as Fig. 1, with one parameter changed (marked in each panel) compared to the standard model (bold in Table A.1). These correspond to the same planets as in Fig. 2 in Savvidou & Bitsch (2023). |
3.2 Radial intensity profiles
It is interesting to consider whether the giant planets that we discussed in the examples in the previous section would lead to observable features at the disk. To this end, in Fig. 3 we show the normalized intensity of the dust emission in our models as a function of the orbital distance. The intensity is normalized to the peak intensity along the radius of the disk. For these calculations, we used the Rayleigh-Jeans approximation, following Eq. (4).
For simplicity, we summarize these examples with three distinct cases, at 1.5 Myr after the disk starts evolving. In the left plot of Fig. 3, we show a disk where no giant formed (example shown in the top, left plot in Fig. 2), in the middle plot a disk where the giant originated at 3 AU (shown in Fig. 1), and in the right plot a disk where the giant originated at 30 AU (shown in Fig. 1).
The giants cause a deep gap in the disk and, therefore, also in the intensity. However, the question is whether these features would survive the convolution with a beam. We overplot in the same figure the normalized radial intensity convolved with three different beams. The full width at half maximum (FWHM) of the two beams are 0.02″ and 0.04″, corresponding to 2.8 and 5.6 AU assuming a source at a distance of 140 Pc. These are chosen to represent some of the observations with the highest resolution so far (e.g., Benisty et al. 2021; Andrews et al. 2018). We also show the convolved intensity with a beam of 0.34″, that corresponds to 100 AU at the distance of the Perseus molecular cloud (an average of the sources discussed in Tychoniec et al. 2020).
The gap caused by a giant that started forming at the inner disk would be missed in observations even with high resolution (FWHM of a few AU) and with insufficient resolution even at large distances. At the same time, the common methods for estimating the disk dust mass could hide the trapped mass at the planetary-induced pressure bump, as we discussed before. Both of these could be part of the main reasons why we estimate such low disk masses from observations that appear to be limiting for planet formation, let alone giant planet formation.
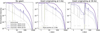 |
Fig. 3 Normalized intensity as a function of orbital distance at 1.5 Myr, comparing the uncolvolved intensity with the ones convolved with three different beams of 0.02′′ and 0.04′′ at 140 pc (2.8 and 5.6 AU), and 0.34″ at 232 pc (100 AU). The gray dashed lines show the evaporation fronts that mainly cause the spikes in the intensity. The examples with a giant correspond to the standard set of parameters (Fig. 1), while the example without a giant corresponds to a low-mass disk (top left plot in Fig. 2). |
3.3 Whole sample
In this section, we generalize our results to our whole sample and present, in Fig. 4, the cumulative distribution functions (CDFs) of the dust mass at different times, from the beginning of the simulations until 3 Myr (near the end of the lifetime of the disk in our models), every 1 Myr. We note that we excluded here the simulations where the planets reach the inner edge of the disk. Their evolution after this remains highly unknown, and hence we consider uncertain how they will influence the dust evolution.
We find that the difference between the total dust mass (solid lines) and the optically thin dust mass (dashed lines) increases with time. If there is nothing to prevent radial drift, the dust decreases in time, and this is reflected in the optically thin dust mass estimates. As we show in Figs. 1 and 2, the time evolution of the optically thin dust mass closely resembles that of the models without any dust trapping.
Interestingly, the time evolution in our models resembles the time evolution that we see when plotting the CDFs of observed disks grouped by classes (see, e.g., Fig. 2 in Drążkowska et al. 2023) and specifically focusing on Class 0 to Class II objects. A direct comparison with the observed dust mass estimates is not trivial and was not intended in this work; however, we also note that the CDFs at the end of our simulations resembles those for Class II disks. In other words, the most similar CDF from our models to the observed Class II disks is the one where planet formation has already happened, especially accounting for the optically thin dust mass estimates of our models.
This strengthens the hypothesis that planet formation starts early and has already happened or has been ongoing for at least a few million years in Class II systems that were commonly assumed to be the progenitors of planets. As expected, we show a mass loss over time, similarly to the CDFs of observed disks in ascending evolutionary stages. Even though the dust mass decreases significantly over time, especially if accounting for the optically thin dust mass, this poses no problem for planet formation because it has already happened.
We hence want to point out that the optically thin dust emission assumption for observations could be leading to a significant underestimation of the dust masses. The trapped dust due to a giant planet-induced pressure bump could be unresolved, and thus not accounted for accurately. This also strongly depends on the location of the giant planet, as the inner regions are generally more difficult to resolve, but seem to be more favorable for giant planet formation (Savvidou & Bitsch 2023). This conclusion, though, would also be the same for any mechanism that could cause dust trapping.
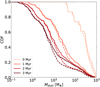 |
Fig. 4 Cumulative distribution functions for the disk dust mass of our models at different times (0–3 Myr). The dashed lines correspond to the dust mass in the optically thin limit. |
4 The mass budget problem
The last decade’s burst of millimeter disk surveys, in several star-forming regions, has led to extensive total mass estimations that do not appear to be high enough to explain planet formation, especially without 100% efficiency in the formation mechanisms (Greaves & Rice 2010; Najita & Kenyon 2014; Lambrechts et al. 2014; Manara et al. 2018; Bitsch et al. 2019). Several solutions to this hypothetical problem have been discussed, but two categories seem to be the most plausible. On the one hand, there could be an underestimation of the masses caused by the assumptions in the flux-to-mass conversion or contributions from optically thick regions. On the other hand, Class II disks could mainly contain the leftovers from planet formation if it starts much earlier than previously assumed.
The flux-to-mass conversion (Eq. (1)) relies by default on mostly optically thin emission for the dust at (sub-)millimeter wavelengths (similar when using the Rayleigh-Jeans approximation). However, the observed disks could be optically thick if dust scattering is considered (Zhu et al. 2019; Dullemond et al. 2018) or partially optically thick in smaller regions (e.g., rings) (Tripathi et al. 2017; Andrews et al. 2018). Tychoniec et al. (2020) estimate the disk masses in the Perseus star-forming region, comparing ALMA (1.1–1.3 mm) and VLA (9 mm) data, as well as dust mass estimates from other regions. Their estimated dust mass medians for Class 0 and I disks from VLA are higher compared to the estimates from the ALMA observations, but not for the Class II disks in their sample, so this could be pointing toward an early formation of planets and a significant amount of optically thick dust at ALMA wavelengths in the very young disks. Xin et al. (2023), perform SED modeling to constrain the disk dust masses in Lupus and find ~1.5–6 times higher mass estimates compared to the ones estimated via Hildebrand (1983).
Even if the millimeter emission is indeed optically thin (especially for Class II disks), the terms that go into Eq. (1) all have great uncertainties and are usually oversimplified. For example, constant values are commonly used for the temperature (Andrews & Williams 2005) or the opacity (Beckwith et al. 1990; Andrews et al. 2013), regardless of the disk or population properties, or the evolutionary stage of the disk. As an example, Pinilla et al. (2022) find that if the outer disk is as cold as the interstellar medium, then the estimated optical depth of the observed disks could be well above unity. The disk radius can also be difficult to constrain, and this can lead to a significant underestimation of the dust masses (Liu et al. 2022). Then the dust-to-gas ratio to convert the dust masses into total disk masses is also an educated guess and can deviate from the interstellar value (Williams & Cieza 2011).
The other possible explanation for the discrepancy between the masses of the observed exoplanets and the observed proto- planetary disks could be that planet formation starts in Class 0 and/or Class I disks in which the estimated mass seems to be sufficient (e.g., Tychoniec et al. 2018). The observed decrease in the masses of the Class II disks in different star-forming regions can be explained by the radial drift of the dust (Appelgren et al. 2020), the formation of larger bodies that are observationally unattainable, and/or the entrapment of solids into some region due to pressure bumps (Pinilla et al. 2020). Such dust traps, whether caused by giant planets or not, can lead to optically thick substructures that are not necessarily accounted for in the dust mass estimations, as we find in this work (see also Miotello et al. 2023; Manara et al. 2023).
The observed substructures even in young disks could be considered an evolutionary signature, supporting early giant planet formation that creates dust traps and observable features. They are mainly found in massive disks (see also Drążkowska et al. 2023; Bae et al. 2023), which are also more likely to host giant planets (Savvidou & Bitsch 2023). These disks have often remained massive, even at older ages, indicating that giants could indeed be the creators of long-lived pressure bumps that trap dust and give structure to the disks (van der Marel & Mulders 2021). The apparent lack of substructures in observations of less massive disks could be explained by insufficient resolution (Bae et al. 2023) orby the loss of information from the chosen deconvolution technique (see, e.g., Jennings et al. 2022).
The brightness of the substructures in the millimeter continuum could be related to the timing of their formation (Gárate et al. 2023), which would help in understanding their origin. However, there are degeneracies that make it difficult to link the observed substructures to a planet and its properties (Bergez-Casalou et al. 2022; Gárate et al. 2023; Tzouvanou et al. 2023), potentially explaining the lack of direct planet detections even in transition disks.
5 Limitations to our models
In the following section we discuss what is not included in our models. We explain why these limitations do not influence the conclusions.
5.1 Planetesimal formation and accretion
In our work here we did not take planetesimal formation and accretion into account. First of all, the planetesimal formation efficiency still depends on several unknown parameters, for example how efficiently pebbles are transformed into planetesimals (see Drążkowska & Alibert 2017; Lenz et al. 2020) or what their preferred formation locations are (Andama et al. 2024; Schoonenberg & Ormel 2017). Danti et al. (2023) show that the important differences between planetesimal and pebble accretion models lie in the composition of the planets that are forming, while the final planetary masses remain similar, especially at lower viscosities. Additionally, the ability to form giant planets seems to remain consistent, with or without planetesimal accretion (Kessler & Alibert 2023). These were the main discussion points of our previous paper and the basis for this paper’s work.
The accretion of planetesimals formed at gap edges exterior to giant planets also does not result in a significant change in the planetary mass, due to the inefficiency of planetesimal accretion during the gas phase, even if 100% of the dust is transformed into planetesimals (Eriksson et al. 2022). This indicates that these planetesimals do not change the growth of the forming planet.
Nevertheless, it is expected that if planetesimal formation was included, then some part of the dust mass that we show in our plots here would be used to form planetesimals. Therefore, the total dust mass (solid lines) in Fig. 4 can be considered the maximum mass of the solids that the disks can retain. The mass of solids in planetesimals would then not be observable. The formation of such larger bodies (whether pebbles larger than a few centimeters, or boulders and planetesimals) can contribute to the low disk mass measurements, while there is still no problem to planet formation, as planetesimal formation mostly influences the inner disk chemistry, but not the growth of the planets themselves (Danti et al. 2023; Kessler & Alibert 2023).
It is important to consider planetesimal formation and accretion in future work that discusses the compositional evolution of the disk or the forming planets. In the present work, though, our conclusions regarding the trapped dust mass are based on the final planetary masses and the formation of giant planets, both of which would be minimally influenced by planetesimal formation and accretion, as we discuss above. Finally, the measured protoplanetary disk dust masses pose no constraint on planet formation because the planets have already formed in the observed disk population.
5.2 Dust filtering through gaps
In our work here we assumed that all dust grain sizes can be efficiently trapped at the planetary-induced pressure bump. Recent studies suggest that some filtering of the dust grains might be taking place in such cases: trapping the larger grains, but allowing the smaller dust to follow the gas motion and pass through the gap, perhaps enhanced by dust fragmentation (Stammler et al. 2023). However, this significantly depends on the planetary mass, the strength of the dust diffusivity, and the core growth timescale (which again depends on the disk conditions). For example, they show in Stammler et al. (2023) that by decreasing the diffusivity (which corresponds to the strength of the viscosity here) to 10−4 the dust mass loss is reduced to only about 10% after 10 Myr (Fig. 3 and discussion in Sect. 3), which would be only around 3% for our integration time of 3 Myr. This result is in line with the estimate of dust filtering derived from 3D hydro-simulations (Bitsch et al. 2018).
It is also important to consider that as dust grains approach a deep gap, where the gas density decreases sharply, their Stokes numbers will rapidly increase; therefore, they will still decouple from the gas and remain trapped (Weber et al. 2018). This will lead to a varying location where particles of different sizes will be trapped, and thus potentially a wider bump, but the dust will remain mostly concentrated exterior to the gap. Additionally, the aforementioned studies do not include planetary migration. The comparison between the planetary migration speed and the velocity of the dust grains (that are well-coupled to the gas if small enough) can be a limiting factor to the permeability of a planetary gap (Morbidelli et al. 2023).
Even with some degree of dust filtering through the gap, the millimeter fluxes in disks that include gaps will be lower compared to a smooth disk (Pinilla et al. 2021). This aligns with our conclusions here that the presence of a deep gap in the disk could affect the disk structure, but this is difficult, if not impossible, to detect observationally with the current technological means and the common methods.
We instead consider that regardless of the above, the dust indeed manages to be very efficiently transported through the gap. Then the dust mass would decrease more quickly, and would approach the fractions shown in our models without a planet, but then our conclusion remains the same. There is still no mass budget problem because planet formation has successfully happened and our measurement of the disk dust masses cannot be limiting to planet formation. To further test this, we performed some simulations in which the dust is not trapped in the planetary gaps at all (see Appendix B).
5.3 1D versus 2D, and two-poppy versus full grain size distribution
We used here a 1D semi-analytic code to simulate planet formation via pebble accretion and explore a wide range of parameters to investigate how the initial conditions in the disk influence planet formation and how this influences the connection to the disk observations. The 1D approach allows fast, and thus numerous calculations; however, 2D (or 3D) and full hydrodynamical models are expected to offer more accurate and detailed physics. We also utilized here the two-population approach for the dust distribution rather than a full grain size distribution or even a full coagulation-fragmentation model. This approach allows significantly faster calculations that again allow a wide exploration of the parameter space that influences planet formation.
In relation to our results, we expect for example that the spikes in the intensity profile would be wider and potentially less strong in a full coagulation 2D model because the asymmetric effects that a planet pressure bump would induce would be “smeared out” (Drążkowska et al. 2019). This would only make the presence of a deep gap in the disk even harder to detect through observations (see Fig. 3).
5.4 Infall and outflows
In the classical picture, planet formation begins in smooth Class II disks. In our previous models Savvidou & Bitsch (2023), we followed this approach as well, and we investigate here how valid this assumption is in respect to the mass budget problem.
Any dust replenishment, especially at more evolved stages, could counteract the dust mass loss due to radial drift; therefore, it could be part of the solution to the mass budget problem (e.g., Kuffmeier et al. 2023). If a gap in the disk already existed, infalling dust would also be trapped in it, and it would not be available for planet formation in the inner disk regions. In addition, the newly trapped mass would be hidden from observations as well, because of the optically thin approximation that we discuss in this work. On the other hand, Morbidelli et al. (2024) argue that the Solar System disk did not experience any significant infall of material in order to explain the dichotomy between carbonaceous and noncarbonaceous chondrites, indicating that infall might not be dominant for all disks during the Class II stage.
Recently, high-contrast imaging with VLT/SPHERE has found an interaction with the surrounding medium in 6 out of the 43 (~14%) observed sources in the Taurus star-forming region (Garufi et al. 2024), suggesting that infall at the Class II stage might not be ubiquitous in all systems. Although the evidence for streamers is increasing steadily, it is fairly recent (see Pineda et al. 2023). Consequently, drawing definitive conclusions remains challenging, particularly with regard to Class II systems and their impact on planet formation or dust masses.
On the other hand, outflows could contribute to the mass loss, but the rates are expected and are found to be decreasing as the forming system evolves (see, e.g., Pascucci et al. 2023). Disk winds, whether magnetohydrodynamic (MHD) or photoevaporative (PE), and jets, primarily influence the gas, without changing the dust mass. Although well-coupled dust is anticipated to be entrained in them, and thus carried along, the exact amount remains uncertain (Pascucci et al. 2023).
Photoevaporation becomes important after 2–3 Myr (e.g., Sellek et al. 2024; Lienert et al. 2024), therefore after the end of our simulations, and thus will not influence our conclusions. Moreover, whether MHD or PE winds are the dominant source of gas mass loss is still not clear (Hartmann et al. 2016).
Both streamers and outflows – winds are very active fields of research with great uncertainties in their origins, mechanisms, and rates of mass gain or loss, respectively (Lesur et al. 2023; Pineda et al. 2023; Pascucci et al. 2023). Despite their significance and the need for more studies, including them in our models is beyond the scope of the present work. However, our study advocates studying disks and planet formation in the Class 0 to Class I stage, including streamers and outflows–winds.
6 Conclusions
We conclude that the mass budget problem for Class II disks does not exist, based on the following:
The assumptions concerning the dust mass estimates can at the very best lead to a lower limit of the dust mass and cannot accurately estimate the total disk mass;
We concluded in our previous work (Savvidou & Bitsch 2023), also considering the exoplanet occurrence rates, that early planet formation is crucial, especially in regard to giant planet formation;
Trapping dust in the disk (via any mechanism) will lead to a significant underestimation of the solid mass under the common assumptions used in the modeling of disk observations (i.e., the flux-to-mass approximation under the optically thin emission assumption);
Giant planets are expected to create a pressure bump exterior to their orbit that will trap the inward drifting dust (pebbles) at least in the short term, potentially also depending on the Stokes numbers of the dust grains, and on the viscosity of the disk. Any trapped dust will be largely unaccounted for by the optically thin emission approximation. Additionally, planet formation has already happened in this case, which means that there should be no missing dust budget dilemma.
We should aim for a combination of dust mass estimates from multiwavelength observations whenever possible since dust emission at longer wavelengths is more likely to be optically thin. We should also consider whether the current approaches (e.g., algorithms or observational durations) sufficiently resolve the sources and whether some information could still be elusive, especially at the inner regions of disks or in less massive and/or bright sources. At the same time, our theoretical models should focus more on dust evolution and planet formation at earlier stages to investigate precisely when and how the first planets form and what the necessary disk mass budget is. We conclude that the mass budget problem hypothesis is not an issue, and it is thus not necessary to have 100% efficiency for planet formation.
Acknowledgements
B.B. and S.S. thank the European Research Council (ERC Starting Grant 757448-PAMDORA) for their financial support. S.S. was a Fellow of the International Max Planck Research School for Astronomy and Cosmic Physics at the University of Heidelberg (IMPRS-HD) during part of the work. S.S. thanks Cornellis P. Dullemond and Nicolás Kurtovic for discussions that helped with one of the paper’s subsections.
Appendix A Parameter study
Appendix B No dust trapping at the planetary gap
In Fig. B.1 we show the dust mass evolution in time for the same example cases as in Sect. 3.1 (and Fig. 1 in Savvidou & Bitsch (2023)), but without any dust trapping in the planetary gap. For these simulations, we do not adjust the α-viscosity value in the viscous evolution of the disk, but we self-consistently calculate the adjusted α for the gas accretion routine (see Eq. 50 in Schneider & Bitsch 2021). Therefore, by construction, no pressure perturbations exist in the disk that could slow down inward drifting pebbles.
Without the dust trapping exterior to the planetary gap, the dust mass decreases over time in the same way as in the models without any planetary gap. This also corresponds to the dust mass estimate from the optically thin emission approximation, even in the simulations with planetary gaps. However, the growth of the planets is not affected at all and the resulting planets are the same (regarding their masses and orbital distances) as in the models of the main results with full dust trapping.
Any amount of dust filtration that could be happening because of growing planets in protoplanetary disks would result in final dust masses in between the values we presented here, either with full dust trapping at the planetary-induced pressure bump (main results) or with no dust trapping at all (this section). We conclude that the total dust mass that can be retained in the disks would be between these two limits, but it has no consequence for the growth and formation of planets.
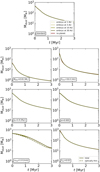 |
Fig. B.1 Similar to Figs. 1 and 2, but here we artificially remove the trapping of dust at the pressure bump that a giant planet can induce. Consequently, all the dust can pass the planet. |
References
- Andama, G., Mah, J., & Bitsch, B. 2024, A&A, 683, A118 [NASA ADS] [CrossRef] [EDP Sciences] [Google Scholar]
- Andrews, S. M., & Williams, J. P. 2005, ApJ, 631, 1134 [Google Scholar]
- Andrews, S. M., Rosenfeld, K. A., Kraus, A. L., & Wilner, D. J. 2013, ApJ, 771, 129 [Google Scholar]
- Andrews, S. M., Huang, J., Pérez, L. M., et al. 2018, ApJ, 869, L41 [NASA ADS] [CrossRef] [Google Scholar]
- Andrews, S. M., & Williams, J. P. 2005, ApJ, 631, 1134 [Google Scholar]
- Ansdell, M., Williams, J. P., van der Marel, N., et al. 2016, ApJ, 828, 46 [Google Scholar]
- Ansdell, M., Williams, J. P., Manara, C. F., et al. 2017, AJ, 153, 240 [Google Scholar]
- Appelgren, J., Lambrechts, M., & Johansen, A. 2020, A&A, 638, A156 [NASA ADS] [CrossRef] [EDP Sciences] [Google Scholar]
- Bae, J., Isella, A., Zhu, Z., et al. 2023, in Astronomical Society of the Pacific Conference Series, 534, Protostars and Planets VII, eds. S. Inutsuka, Y. Aikawa, T. Muto, K. Tomida, & M. Tamura, 423 [NASA ADS] [Google Scholar]
- Ballering, N. P., & Eisner, J. A. 2019, AJ, 157, 144 [Google Scholar]
- Barenfeld, S. A., Carpenter, J. M., Ricci, L., & Isella, A. 2016, ApJ, 827, 142 [Google Scholar]
- Beckwith, S. V. W., Sargent, A. I., Chini, R. S., & Guesten, R. 1990, AJ, 99, 924 [Google Scholar]
- Benisty, M., Bae, J., Facchini, S., et al. 2021, ApJ, 916, L2 [NASA ADS] [CrossRef] [Google Scholar]
- Bergez-Casalou, C., Bitsch, B., Kurtovic, N. T., & Pinilla, P. 2022, A&A, 659, A6 [NASA ADS] [CrossRef] [EDP Sciences] [Google Scholar]
- Birnstiel, T., Klahr, H., & Ercolano, B. 2012, A&A, 539, A148 [NASA ADS] [CrossRef] [EDP Sciences] [Google Scholar]
- Bitsch, B., Lambrechts, M., & Johansen, A. 2015, A&A, 582, A112 [NASA ADS] [CrossRef] [EDP Sciences] [Google Scholar]
- Bitsch, B., Morbidelli, A., Johansen, A., et al. 2018, A&A, 612, A30 [NASA ADS] [CrossRef] [EDP Sciences] [Google Scholar]
- Bitsch, B., Izidoro, A., Johansen, A., et al. 2019, A&A, 623, A88 [NASA ADS] [CrossRef] [EDP Sciences] [Google Scholar]
- Cazzoletti, P., Manara, C. F., Liu, H. B., et al. 2019, A&A, 626, A11 [NASA ADS] [CrossRef] [EDP Sciences] [Google Scholar]
- Cieza, L. A., Ruíz-Rodríguez, D., Hales, A., et al. 2019, MNRAS, 482, 698 [Google Scholar]
- Cieza, L. A., González-Ruilova, C., Hales, A. S., et al. 2021, MNRAS, 501, 2934 [Google Scholar]
- Danti, C., Bitsch, B., & Mah, J. 2023, A&A, 679, L7 [NASA ADS] [CrossRef] [EDP Sciences] [Google Scholar]
- Drążkowska, J., & Alibert, Y. 2017, A&A, 608, A92 [Google Scholar]
- Drążkowska, J., Li, S., Birnstiel, T., Stammler, S. M., & Li, H. 2019, ApJ, 885, 91 [Google Scholar]
- Drążkowska, J., Bitsch, B., Lambrechts, M., et al. 2023, in Astronomical Society of the Pacific Conference Series, 534, Protostars and Planets VII, eds. S. Inutsuka, Y. Aikawa, T. Muto, K. Tomida, & M. Tamura, 717 [Google Scholar]
- Dullemond, C. P., Birnstiel, T., Huang, J., et al. 2018, ApJ, 869, L46 [NASA ADS] [CrossRef] [Google Scholar]
- Eisner, J. A., Arce, H. G., Ballering, N. P., et al. 2018, ApJ, 860, 77 [CrossRef] [Google Scholar]
- Eriksson, L. E. J., Ronnet, T., Johansen, A., et al. 2022, A&A, 661, A73 [NASA ADS] [CrossRef] [EDP Sciences] [Google Scholar]
- Franceschi, R., Birnstiel, T., Henning, T., et al. 2022, A&A, 657, A74 [NASA ADS] [CrossRef] [EDP Sciences] [Google Scholar]
- Galván-Madrid, R., Liu, H. B., Izquierdo, A. F., et al. 2018, ApJ, 868, 39 [CrossRef] [Google Scholar]
- Gárate, M., Birnstiel, T., Pinilla, P., et al. 2023, A&A, 679, A15 [NASA ADS] [CrossRef] [EDP Sciences] [Google Scholar]
- Garufi, A., Ginski, C., van Holstein, R. G., et al. 2024, A&A, 685, A53 [NASA ADS] [CrossRef] [EDP Sciences] [Google Scholar]
- Greaves, J. S., & Rice, W. K. M. 2010, MNRAS, 407, 1981 [CrossRef] [Google Scholar]
- Harsono, D., Bjerkeli, P., van der Wiel, M. H. D., et al. 2018, Nat. Astron., 2, 646 [Google Scholar]
- Hartmann, L., Herczeg, G., & Calvet, N. 2016, ARA&A, 54, 135 [Google Scholar]
- Hildebrand, R. H. 1983, QJRAS, 24, 267 [NASA ADS] [Google Scholar]
- Jennings, J., Booth, R. A., Tazzari, M., Clarke, C. J., & Rosotti, G. P. 2022, MNRAS, 509, 2780 [NASA ADS] [Google Scholar]
- Johansen, A., & Lambrechts, M. 2017, Annu. Rev. Earth Planet. Sci., 45, 359 [Google Scholar]
- Johansen, A., Ida, S., & Brasser, R. 2019, A&A, 622, A202 [NASA ADS] [CrossRef] [EDP Sciences] [Google Scholar]
- Kama, M., Trapman, L., Fedele, D., et al. 2020, A&A, 634, A88 [NASA ADS] [CrossRef] [EDP Sciences] [Google Scholar]
- Kessler, A., & Alibert, Y. 2023, A&A, 674, A144 [NASA ADS] [CrossRef] [EDP Sciences] [Google Scholar]
- Kruijer, T. S., Burkhardt, C., Budde, G., & Kleine, T. 2017, PNAS, 114, 6712 [NASA ADS] [CrossRef] [Google Scholar]
- Kuffmeier, M., Jensen, S. S., & Haugbølle, T. 2023, Eur. Phys. J. Plus, 138, 272 [NASA ADS] [CrossRef] [Google Scholar]
- Lambrechts, M., & Johansen, A. 2012, A&A, 544, A32 [NASA ADS] [CrossRef] [EDP Sciences] [Google Scholar]
- Lambrechts, M., Johansen, A., & Morbidelli, A. 2014, A&A, 572, A35 [NASA ADS] [CrossRef] [EDP Sciences] [Google Scholar]
- Lenz, C. T., Klahr, H., Birnstiel, T., Kretke, K., & Stammler, S. 2020, A&A, 640, A61 [NASA ADS] [CrossRef] [EDP Sciences] [Google Scholar]
- Lesur, G., Flock, M., Ercolano, B., et al. 2023, in Astronomical Society of the Pacific Conference Series, 534, Protostars and Planets VII, eds. S. Inutsuka, Y. Aikawa, T. Muto, K. Tomida, & M. Tamura, 465 [NASA ADS] [Google Scholar]
- Lienert, J. L., Bitsch, B., & Henning, T. 2024, A&A, 691, A72 [NASA ADS] [CrossRef] [EDP Sciences] [Google Scholar]
- Liu, Y., Linz, H., Fang, M., et al. 2022, A&A, 668, A175 [NASA ADS] [CrossRef] [EDP Sciences] [Google Scholar]
- Manara, C. F., Morbidelli, A., & Guillot, T. 2018, A&A, 618, L3 [NASA ADS] [CrossRef] [EDP Sciences] [Google Scholar]
- Manara, C. F., Ansdell, M., Rosotti, G. P., et al. 2023, in Astronomical Society of the Pacific Conference Series, 534, Protostars and Planets VII, eds. S. Inutsuka, Y. Aikawa, T. Muto, K. Tomida, & M. Tamura, 539 [NASA ADS] [Google Scholar]
- Miotello, A., Kamp, I., Birnstiel, T., Cleeves, L. C., & Kataoka, A. 2023, in Astronomical Society of the Pacific Conference Series, 534, Protostars and Planets VII, eds. S. Inutsuka, Y. Aikawa, T. Muto, K. Tomida, & M. Tamura, 501 [NASA ADS] [Google Scholar]
- Morbidelli, A., Batygin, K., & Lega, E. 2023, A&A, 675, A75 [NASA ADS] [CrossRef] [EDP Sciences] [Google Scholar]
- Morbidelli, A., Marrocchi, Y., Ali Ahmad, A., et al. 2024, A&A, 691, A147 [NASA ADS] [CrossRef] [EDP Sciences] [Google Scholar]
- Mulders, G. D., Pascucci, I., & Apai, D. 2015, ApJ, 798, 112 [Google Scholar]
- Mulders, G. D., Pascucci, I., Apai, D., & Ciesla, F. J. 2018, AJ, 156, 24 [Google Scholar]
- Najita, J. R., & Kenyon, S. J. 2014, MNRAS, 445, 3315 [NASA ADS] [CrossRef] [Google Scholar]
- Ndugu, N., Bitsch, B., Morbidelli, A., Crida, A., & Jurua, E. 2021, MNRAS, 501, 2017 [Google Scholar]
- Paardekooper, S. J., Baruteau, C., & Kley, W. 2011, MNRAS, 410, 293 [NASA ADS] [CrossRef] [Google Scholar]
- Pascucci, I., Testi, L., Herczeg, G. J., et al. 2016, ApJ, 831, 125 [Google Scholar]
- Pascucci, I., Cabrit, S., Edwards, S., et al. 2023, in Astronomical Society of the Pacific Conference Series, 534, Protostars and Planets VII, eds. S. Inutsuka, Y. Aikawa, T. Muto, K. Tomida, & M. Tamura, 567 [NASA ADS] [Google Scholar]
- Pineda, J. E., Arzoumanian, D., Andre, P., et al. 2023, in Astronomical Society of the Pacific Conference Series, 534, Protostars and Planets VII, eds. S. Inutsuka, Y. Aikawa, T. Muto, K. Tomida, & M. Tamura, 233 [NASA ADS] [Google Scholar]
- Pinilla, P., Pascucci, I., & Marino, S. 2020, A&A, 635, A105 [NASA ADS] [CrossRef] [EDP Sciences] [Google Scholar]
- Pinilla, P., Lenz, C. T., & Stammler, S. M. 2021, A&A, 645, A70 [NASA ADS] [CrossRef] [EDP Sciences] [Google Scholar]
- Pinilla, P., Benisty, M., Kurtovic, N. T., et al. 2022, A&A, 665, A128 [NASA ADS] [CrossRef] [EDP Sciences] [Google Scholar]
- Powell, D., Murray-Clay, R., & Schlichting, H. E. 2017, ApJ, 840, 93 [NASA ADS] [CrossRef] [Google Scholar]
- Powell, D., Murray-Clay, R., Pérez, L. M., Schlichting, H. E., & Rosenthal, M. 2019, ApJ, 878, 116 [NASA ADS] [CrossRef] [Google Scholar]
- Ruíz-Rodríguez, D., Cieza, L. A., Williams, J. P., et al. 2018, MNRAS, 478, 3674 [Google Scholar]
- Savvidou, S., & Bitsch, B. 2023, A&A, 679, A42 [NASA ADS] [CrossRef] [EDP Sciences] [Google Scholar]
- Schneider, A. D., & Bitsch, B. 2021, A&A, 654, A71 [Google Scholar]
- Schoonenberg, D., & Ormel, C. W. 2017, A&A, 602, A21 [NASA ADS] [CrossRef] [EDP Sciences] [Google Scholar]
- Segura-Cox, D. M., Schmiedeke, A., Pineda, J. E., et al. 2020, Nature, 586, 228 [NASA ADS] [CrossRef] [Google Scholar]
- Sellek, A. D., Grassi, T., Picogna, G., et al. 2024, A&A, 690, A296 [NASA ADS] [CrossRef] [EDP Sciences] [Google Scholar]
- Sheehan, P. D., & Eisner, J. A. 2018, ApJ, 857, 18 [NASA ADS] [CrossRef] [Google Scholar]
- Stammler, S. M., Lichtenberg, T., Drazkowska, J., & Birnstiel, T. 2023, A&A, 670, L5 [NASA ADS] [CrossRef] [EDP Sciences] [Google Scholar]
- Tanaka, Y. A., & Tsukamoto, Y. 2019, MNRAS, 484, 1574 [NASA ADS] [CrossRef] [Google Scholar]
- Tobin, J. J., Sheehan, P. D., Megeath, S. T., et al. 2020, ApJ, 890, 130 [CrossRef] [Google Scholar]
- Tripathi, A., Andrews, S. M., Birnstiel, T., & Wilner, D. J. 2017, ApJ, 845, 44 [Google Scholar]
- Tychoniec, L., Tobin, J. J., Karska, A., et al. 2018, ApJS, 238, 19 [NASA ADS] [CrossRef] [Google Scholar]
- Tychoniec, L., Manara, C. F., Rosotti, G. P., et al. 2020, A&A, 640, A19 [NASA ADS] [CrossRef] [EDP Sciences] [Google Scholar]
- Tzouvanou, A., Bitsch, B., & Pichierri, G. 2023, A&A, 677, A82 [NASA ADS] [CrossRef] [EDP Sciences] [Google Scholar]
- van der Marel, N., & Mulders, G. D. 2021, AJ, 162, 28 [NASA ADS] [CrossRef] [Google Scholar]
- van Terwisga, S. E., Hacar, A., van Dishoeck, E. F., Oonk, R., & Portegies Zwart, S. 2022, A&A, 661, A53 [NASA ADS] [CrossRef] [EDP Sciences] [Google Scholar]
- Villenave, M., Ménard, F., Dent, W. R. F., et al. 2021, A&A, 653, A46 [NASA ADS] [CrossRef] [EDP Sciences] [Google Scholar]
- Wadhwa, M., McCoy, T. J., & Schrader, D. L. 2020, Annu. Rev. Earth Planet. Sci., 48, 233 [Google Scholar]
- Weber, P., Benítez-Llambay, P., Gressel, O., Krapp, L., & Pessah, M. E. 2018, ApJ, 854, 153 [NASA ADS] [CrossRef] [Google Scholar]
- Williams, J. P., & Cieza, L. A. 2011, ARA&A, 49, 67 [Google Scholar]
- Xin, Z., Espaillat, C. C., Rilinger, A. M., Ribas, Á., & Macías, E. 2023, ApJ, 942, 4 [NASA ADS] [CrossRef] [Google Scholar]
- Zhu, Z., Zhang, S., Jiang, Y.-F., et al. 2019, ApJ, 877, L18 [NASA ADS] [CrossRef] [Google Scholar]
All Tables
All Figures
|
Fig. 1 Dust mass as a function of time for the same planets as in Fig. 1 in Savvidou & Bitsch (2023), using the standard set of parameters (Table A.1). The dashed lines show the time evolution of the optically thin dust mass and the red line shows the time evolution of the dust mass for a simulation without a planet. The dot marks the last dust mass if a planet reaches the inner edge of the disk. |
| In the text | |
|
Fig. 2 Same as Fig. 1, with one parameter changed (marked in each panel) compared to the standard model (bold in Table A.1). These correspond to the same planets as in Fig. 2 in Savvidou & Bitsch (2023). |
| In the text | |
|
Fig. 3 Normalized intensity as a function of orbital distance at 1.5 Myr, comparing the uncolvolved intensity with the ones convolved with three different beams of 0.02′′ and 0.04′′ at 140 pc (2.8 and 5.6 AU), and 0.34″ at 232 pc (100 AU). The gray dashed lines show the evaporation fronts that mainly cause the spikes in the intensity. The examples with a giant correspond to the standard set of parameters (Fig. 1), while the example without a giant corresponds to a low-mass disk (top left plot in Fig. 2). |
| In the text | |
|
Fig. 4 Cumulative distribution functions for the disk dust mass of our models at different times (0–3 Myr). The dashed lines correspond to the dust mass in the optically thin limit. |
| In the text | |
|
Fig. B.1 Similar to Figs. 1 and 2, but here we artificially remove the trapping of dust at the pressure bump that a giant planet can induce. Consequently, all the dust can pass the planet. |
| In the text | |
Current usage metrics show cumulative count of Article Views (full-text article views including HTML views, PDF and ePub downloads, according to the available data) and Abstracts Views on Vision4Press platform.
Data correspond to usage on the plateform after 2015. The current usage metrics is available 48-96 hours after online publication and is updated daily on week days.
Initial download of the metrics may take a while.