Fig. 3
Download original image
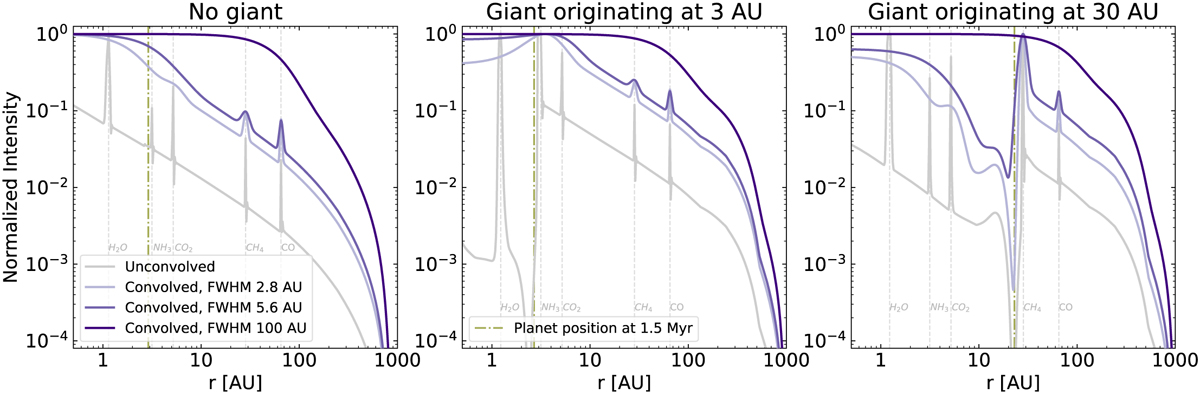
Normalized intensity as a function of orbital distance at 1.5 Myr, comparing the uncolvolved intensity with the ones convolved with three different beams of 0.02′′ and 0.04′′ at 140 pc (2.8 and 5.6 AU), and 0.34″ at 232 pc (100 AU). The gray dashed lines show the evaporation fronts that mainly cause the spikes in the intensity. The examples with a giant correspond to the standard set of parameters (Fig. 1), while the example without a giant corresponds to a low-mass disk (top left plot in Fig. 2).
Current usage metrics show cumulative count of Article Views (full-text article views including HTML views, PDF and ePub downloads, according to the available data) and Abstracts Views on Vision4Press platform.
Data correspond to usage on the plateform after 2015. The current usage metrics is available 48-96 hours after online publication and is updated daily on week days.
Initial download of the metrics may take a while.