Fig. 1
Download original image
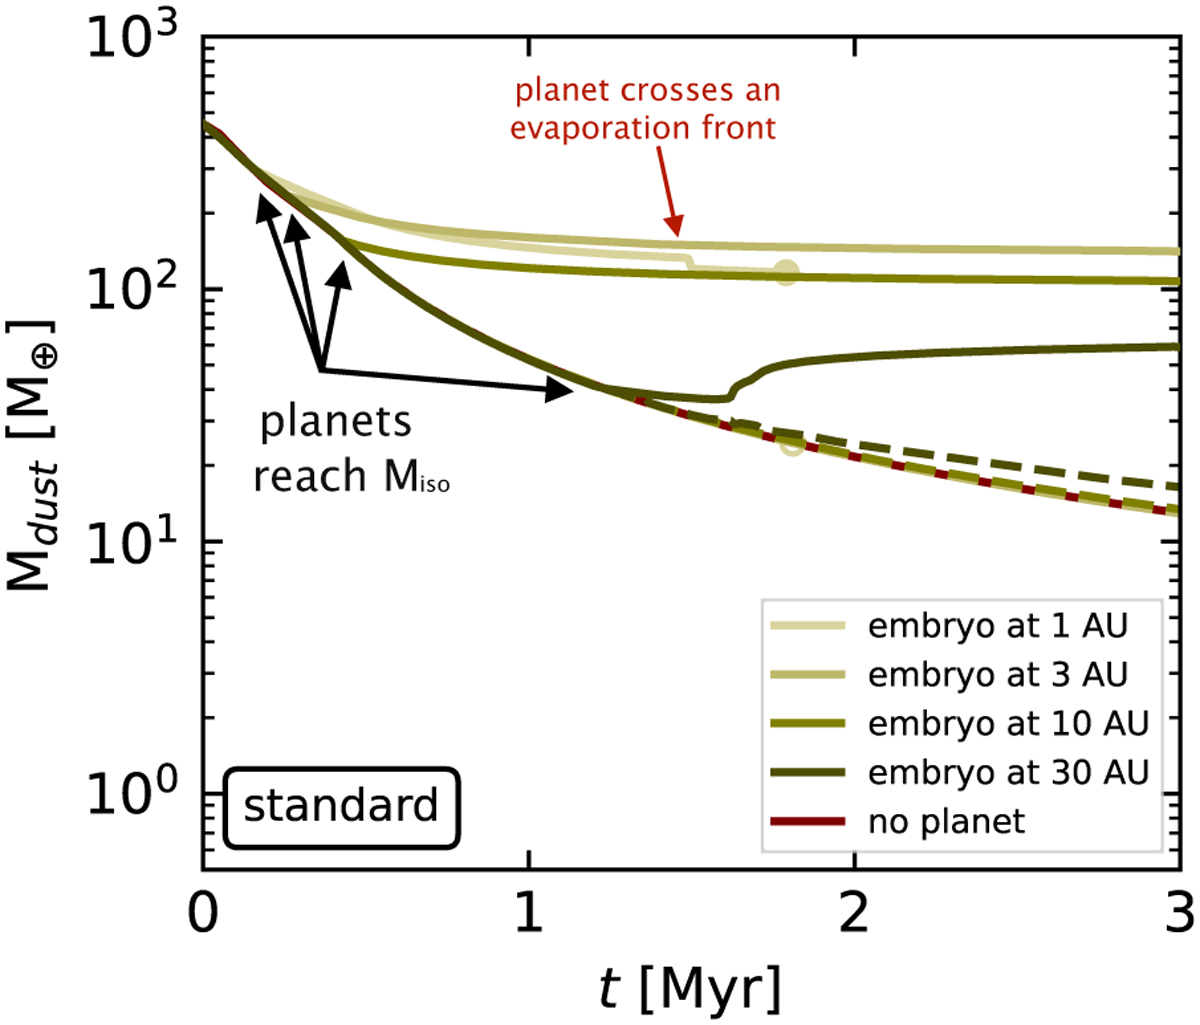
Dust mass as a function of time for the same planets as in Fig. 1 in Savvidou & Bitsch (2023), using the standard set of parameters (Table A.1). The dashed lines show the time evolution of the optically thin dust mass and the red line shows the time evolution of the dust mass for a simulation without a planet. The dot marks the last dust mass if a planet reaches the inner edge of the disk.
Current usage metrics show cumulative count of Article Views (full-text article views including HTML views, PDF and ePub downloads, according to the available data) and Abstracts Views on Vision4Press platform.
Data correspond to usage on the plateform after 2015. The current usage metrics is available 48-96 hours after online publication and is updated daily on week days.
Initial download of the metrics may take a while.