Fig. 3
Download original image
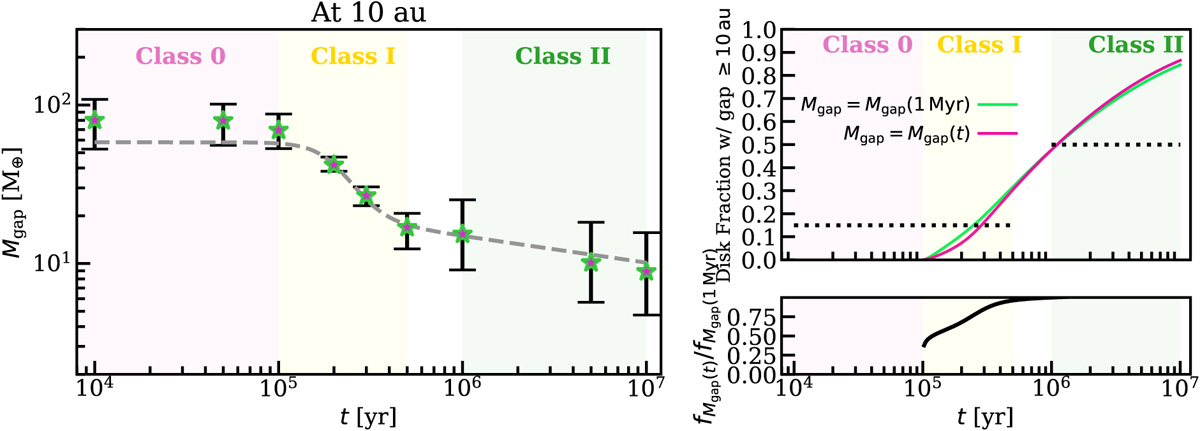
Left: range of minimum gap-opening planet mass from the entire grid of models at 10 au as a function of time. The stars show the mean at each time. A fit function to the results of the models for M⋆, f = 0.5 M⊙ is shown with a dashed gray line. Upper right: fraction of disks that can open a gap at radii ≥ 10 au if planets grow at the maximum rate allowed by pebble accretion (see text for details), assuming a gap-opening mass changing with time (solid pink line) found from the dashed gray line in the left panel. This provides an upper limit on the number of observable substructures that are opened by planets. The green line shows the same but for a gap-opening planet mass at 1 Myr (i.e., ∼15 M⊕). The dotted black lines roughly indicate the substructure occurrence rate in observed disks. Lower right: pink line divided by the green line from the panel above showing the factor by which temperature effects alone reduce the number of gapped disks. The shaded background colors roughly show the different classes.
Current usage metrics show cumulative count of Article Views (full-text article views including HTML views, PDF and ePub downloads, according to the available data) and Abstracts Views on Vision4Press platform.
Data correspond to usage on the plateform after 2015. The current usage metrics is available 48-96 hours after online publication and is updated daily on week days.
Initial download of the metrics may take a while.