| Issue |
A&A
Volume 695, March 2025
|
|
|---|---|---|
| Article Number | A240 | |
| Number of page(s) | 12 | |
| Section | Astrophysical processes | |
| DOI | https://doi.org/10.1051/0004-6361/202452052 | |
| Published online | 25 March 2025 | |
Discovery of large-scale radio emission enveloping the mini-halo in the most X-ray luminous galaxy cluster RX J1347.5–1145
1
Hamburger Sternwarte, Universität Hamburg, Gojenbergsweg 112, 21029 Hamburg, Germany
2
Academia Sinica Institute of Astronomy and Astrophysics No. 1, Section 4, Roosevelt Road, Taipei 10617, Taiwan
3
Thüringer Landessternwarte, Sternwarte 5, 07778 Tautenburg, Germany
4
Dipartimento di Fisica e Astronomia, Universitá di Bologna, via Gobetti 93/2, 40122 Bologna, Italy
5
INAF – Istituto di Radioastronomia di Bologna, Via Gobetti 101, I-40129 Bologna, Italy
6
Max Planck Institute for Extraterrestrial Physics, Giessenbachstrasse 1, 85748 Garching, Germany
7
Institute for Frontiers in Astronomy and Astrophysics, Beijing Normal University, Beijing 102206, China
8
Leiden Observatory, Leiden University, PO Box 9513, NL-2300 RA Leiden, The Netherlands
⋆ Corresponding author; duyhoang.astro@gmail.com
Received:
29
August
2024
Accepted:
5
February
2025
Context. Diffuse radio sources, known as mini-halos and halos, are detected at the centres of galaxy clusters. These centralised diffuse sources are typically observed individually, with both appearing together only in rare cases. The origin of the diffuse radio sources in such systems remains unclear.
Aims. We investigate the formation of large-scale radio emission in the most X-ray luminous, massive galaxy cluster RXJ 1347.5−1145, which is known to host a mini-halo at its centre, and possibly additional and more extended emission.
Methods. We conducted deep multi-frequency observations of the galaxy cluster using MeerKAT at 1.28 GHz and the uGMRT at 1.26 GHz and 700 MHz. We characterised the brightness and spectral properties of the central diffuse sources and combined our radio observations with Chandra X-ray data to explore the correlation between the cluster’s non-thermal and thermal emissions.
Results. We confirm the presence of the diffuse emission and find that it extends up to 1 Mpc in size. Our multi-wavelength data reveal that the central diffuse emission consists of two distinct components: a mini-halo located in the cluster core and a larger radio halo extending around it. The correlation between radio and X-ray surface brightness in the two sources indicates a strong connection between the non-thermal and thermal properties of the intracluster medium (ICM). The differing slopes in the IR − IX and α − IX relations suggest that distinct mechanisms are responsible for the formation of the mini-halo and the halo. The properties of the halo align with the turbulent model, while both turbulent and hadronic processes may contribute to the formation of the mini-halo.
Key words: acceleration of particles / radiation mechanisms: non-thermal / turbulence / galaxies: clusters: intracluster medium / galaxies: clusters: individual: RX J1347.5–1145
© The Authors 2025
 Open Access article, published by EDP Sciences, under the terms of the Creative Commons Attribution License (https://creativecommons.org/licenses/by/4.0), which permits unrestricted use, distribution, and reproduction in any medium, provided the original work is properly cited.
This article is published in open access under the Subscribe to Open model. Subscribe to A&A to support open access publication.
1. Introduction
Galaxy clusters are gravitationally bound systems, containing hundreds to thousands of individual galaxies (e.g. Abell et al. 1989; Wen et al. 2012). In the context of hierarchical formation, massive clusters (M ≈ 1014 − 1015 M⊙) form through a series of energetic mergers of smaller clusters and release up to ∼1064 erg during a timescale of a few Gigayears (e.g. Hoeft et al. 2008). The cluster-cluster collisions generate turbulence and shocks in the intracluster medium (ICM) that are observable with X-ray and radio telescopes (e.g. Brunetti & Jones 2014; van Weeren et al. 2019).
Most of the gravitational energy released during the cluster formation is converted into the thermal motions of particles, which emit Bremsstrahlung X-ray emission in the ICM. Consequently, the morphology of the diffuse X-ray emission serves as a reliable tracer for cluster dynamics (e.g. Buote & Tsai 1995; Poole et al. 2006; Santos et al. 2008). Simultaneously, a small portion of this gravitational energy is channelled into non-thermal components through the acceleration of cosmic-ray electrons (CRes) and the amplification of magnetic fields, resulting in diffuse synchrotron emission in the ICM (e.g. Enßlin et al. 1998; van Weeren et al. 2010; Cassano et al. 2013).
Central diffuse radio sources have been increasingly detected in galaxy clusters thanks to advancements of low-frequency radio telescopes. These sources are classified as mega-halos, halos, or mini-halos, depending on their observed properties such as size and synchrotron emissivity. These diffuse synchrotron sources exhibit steep (α ≲ −1) spectra1 and are unpolarised (up to a few percent; e.g. Feretti et al. 2001). Radio halos typically span about ∼1 Mpc in size (or largest linear size, LLS), have radio surface brightness (SB) profiles following an exponential function, and are typically detected in disturbed galaxy clusters (for a review, see e.g. van Weeren et al. 2019). A few halos with exceptionally larger sizes have also been observed in massive merging clusters, including Abell 2142, Abell 2163, and 1E0657−56 with a LLS of 2.4 Mpc, 2.9 Mpc, and 2.1 Mpc, respectively (Bruno et al. 2023; Liang et al. 2000; Feretti et al. 2001). The unusually large sizes of these radio halos might be due to the high-end masses of the dynamically disturbed host clusters (i.e. mass of (8.77 ± 0.19)×1014 M⊙ for Abell 2142, (1.61 ± 0.03)×1015 M⊙ for Abell 2163 and (1.31 ± 0.03)×1015 M⊙ for 1E0657−56; Planck Collaboration XXIV 2016) that release more energy during the cluster-cluster merger. Recently, a few clusters have been identified that host centralised diffuse emission with a LLS of larger than 2 Mpc using the LOw Frequency Array (LOFAR) at 144 MHz (Cuciti et al. 2022). These diffuse sources are found to surround the existing radio halos and have a lower emissivity than the halos by a factor of ∼20; hence, they are known as mega-halos. A large diffuse emission with a LLS of 5 Mpc, likely classified as a mega-halo, has also been reported in Abell 2255 (Botteon et al. 2022). Mini-halos, on the other hand, are usually smaller (i.e. typically less than ∼500 kpc) and significantly brighter (by an order of magnitude) compared to radio halos (e.g. Cassano et al. 2008; Murgia et al. 2009). Mini-halos are often detected in the relaxed cool-core clusters, whereas radio halos are predominantly observed in dynamically disturbed clusters, suggesting a link between their formation and the cluster’s dynamical state.
Due to energy losses through synchrotron and inverse-Compton radiation, the radio-emitting CRes in halos and mini-halos have a lifetime of 100 Myr in typical ICM conditions. This suggests that the CRes are either locally (re-)accelerated or continuously injected throughout the ICM volume. Two main mechanisms, including turbulent or hadronic processes, have been proposed for the generation of these CRes. In the turbulent scenario, primary CRes are (re-)accelerated by the multi-scale turbulence induced by cluster-cluster mergers (e.g. Brunetti et al. 2001; Petrosian 2001; Brunetti & Lazarian 2007). In the hadronic scenario, CRes are secondary products (along with gamma rays) resulting from inelastic collisions between cosmic-ray protons (CRps) and thermal protons within the ICM (e.g. Dennison 1980; Blasi & Colafrancesco 1999; Dolag & Ensslin 2000). Additionally, a hybrid model suggests both primary and secondary CRes contribute to the radio emission observed in halos (Brunetti & Blasi 2005; Brunetti & Lazarian 2011; Zandanel et al. 2014; Pinzke et al. 2017). In the presence of magnetic fields, these primary and secondary CRes emit synchrotron emission, which is detectable in the radio band (see e.g. Brunetti & Jones 2014, for a review of the models).
The pure hadronic model is disfavoured by the detection of ultra-steep spectrum radio halos (USSRHs), which exhibit spectral indices steeper than ∼ − 1.5, as this model typically predicts flatter spectral indices (between −1.2 and −1) (i.e. Pfrommer et al. 2004; Brunetti & Jones 2014; ZuHone et al. 2015). In contrast, the presence of USSRHs is consistent with the turbulent model (Cassano & Brunetti 2005; Cassano et al. 2010; Brunetti et al. 2008; ZuHone et al. 2013; Brunetti & Jones 2014). Additionally, the predicted gamma rays from hadronic interactions in radio halos have not been detected by the Fermi Gamma-ray Space Telescope (Jeltema & Profumo 2011; Brunetti et al. 2012, 2017; Zandanel et al. 2014; Ackermann et al. 2016; Adam et al. 2021). However, the hadronic mechanism has not been ruled out for mini-halos, even when excluding the contribution from primary processes (Ignesti et al. 2020).
2. The galaxy cluster RX J1347.5–1145
RX J1347.5−1145 (hereafter RXJ1347, z = 0.451) is noted as the most X-ray luminous cluster, with a luminosity of LX = (6.2 ± 0.6)×1045 erg s−1 in the 0.1 − 2.4 keV energy band (Schindler et al. 1995). Multi-wavelength observations of the cluster have revealed intriguing properties of this cool-core galaxy cluster during its merging process with a sub-cluster of galaxies.
RXJ1347 has an exceptionally high mass of (2.0 ± 0.4) × 1015 ℳ⊙ within the r200 radius and an overall ICM temperature of 10.0 ± 0.3 keV (Gitti & Schindler 2004). X-ray and Sunyaev-Zeldovich (SZ) observations have identified an unusual hot gas region in the SE part of the cluster, approximately ∼150 kpc from the cluster centre (Allen et al. 2002; Gitti & Schindler 2004; Komatsu et al. 2001; Kitayama et al. 2004, 2016; Mason et al. 2010; Ueda et al. 2018). This significant increase in the X-ray and SZ SB is thought to be due to shock-heated gas with a temperature of kBTe > 20 keV, resulting from an off-axis ongoing merger between a low-mass sub-cluster and a cool-core main cluster (e.g. Gitti & Schindler 2004; Mason et al. 2010; Ueda et al. 2018). Using combined SZ (150 and 350 GHz) and X-ray (0.5 − 7.0 keV energy band) data, Kitayama et al. (2004) estimated the temperature of the SE region to be kBTe = 28.5 ± 7.3 keV, the total electron number density to be ne = (1.49 ± 0.59)×10−2 cm−3, and the line-of-sight length to be 240 ± 183 kpc. The study also found a Mach number of 2.1 for the merger shock in the SE region. Subsequent analyses by Ota et al. (2008) using broad-band spectroscopy data from Suzaku and by Ueda et al. (2018) using Chandra X-ray and ALMA SZ observations confirmed the presence of the hot shock gas in the SE region. The gas in the in-falling sub-cluster is stripped behind its mass peak, indicating that the SE emission is likely linked to shock heated gas by the cluster-cluster merger (Ueda et al. 2018). In addition, Ueda et al. (2018) reported the detection of a dipolar pattern in the X-ray emission in the core region after removing the global emission of the cluster. The authors associated this feature with the gas sloshing motion of the cool core at sub-sonic speed.
The non-thermal properties of the galaxy cluster RXJ1347 remains relatively understudied despite their crucial role in understanding the magnetic field structures and the particle acceleration processes in the low-density environments of the ICM. Low-frequency radio observations with the Very Large Array (VLA) at 1.4 GHz by Gitti et al. (2007) and the Giant Metrewave Radio Telescope (GMRT) at 237 and 614 MHz by Ferrari et al. (2011) show that the cluster hosts a central diffused radio source, namely a mini-halo. The main component of the diffuse source has a diameter of 435 kpc (at 1.4 GHz). An additional diffuse emission region towards the S direction is reported in the 1.4 GHz observations, but is not detected in the 237 MHz and 614 MHz images (see Figs. 4 and 5 in Gitti et al. 2007 and Fig. 1 in Ferrari et al. 2011), extending the LLS of the cluster diffuse emission to 640 kpc (Gitti et al. 2007; Ferrari et al. 2011). However, this southern diffuse emission might not be part of the mini-halo, but is related to the merger activity of the cluster as the sub-cluster merges to the main cluster, hosting the mini-halo, from the SW to NE direction (Mason et al. 2010). The spectral index of the mini-halo is estimated to be  (Ferrari et al. 2011). Towards the SE region of the cluster, an additional component of diffuse emission is detected at a distance of ∼125 kpc from the cluster centre. The additional diffuse radio source is spatially coincident with the region where excess X-ray and SZ emission is reported. This radio emission is thought to originate from the merger shock via either the re-acceleration of local electrons (Ferrari et al. 2011; Enßlin et al. 1998) or adiabatic gas compression (Ferrari et al. 2011; Enßlin & Gopal-Krishna 2001). Towards the southern region of the mini-halo, the VLA 1.4 GHz observations show the detection of an extended emission that is not visible in the GMRT 237 MHz and 610 MHz. In this paper our aim is to study the diffuse radio emission from the galaxy cluster RXJ1347 to understand the mechanisms governing the acceleration of the radio-emitting particles in the cluster.
We adopt a flat Λ cold dark matter (ΛCDM) cosmology with parameters H0 = 70 km s−1 Mpc−1, Ωm = 0.3, and ΩΛ = 0.7. At the cluster redshift of = 0.451, an angular separation of 1″ corresponds to a physical distance of 5.767 kpc.
3. Observations and data reduction
3.1. Radio data
3.1.1. MeerKAT 1.28 GHz
MeerKAT L-Band observations of RXJ1347 were conducted on September 24, 2022, with a total on-source observing time of 8.3 hours. The cluster field was observed using full polarisation settings, covering a frequency range from 890 MHz to 1668 MHz, with a channel width of 209 kHz. Compact radio sources including J0408−6545, J1337−1257, and J1939−6342 were observed for calibration purposes. More details on the MeerKAT 1.28 GHz observations are provided in Table 1.
Details of the uGMRT and MeerKAT observations of RXJ1347.
The MeerKAT data were calibrated using the SARAO Science Data Processor (SDP) pipelines2. The initial calibration pipeline was first used to solve and apply gain, bandpass and phase corrections, and to remove radio frequency interference (RFI). For the flux scale and bandpass calibration, the radio galaxies J0408−6545 and J1939−6342 with flux densities of 15.709 Jy and 15.007 Jy, respectively, were utilised. Subsequently, the data were processed with the MeerKAT continuum pipeline, which performs self-calibration to correct for wide-field effects across multiple sub-regions (facets) of the target field. The calibrated data were then deconvolved to create continuum intensity images using the Common Astronomy Software Package (CASA)3. It is worth noting that the attenuation of the MeerKAT primary beam in the outskirts of RXJ1347 is minimal due to the cluster’s small angular size (i.e. 3′). The telescope sensitivity in these outskirts remains up to 99% of that in the pointing centre. Nonetheless, for completeness, we applied the primary beam correction to the final images using the MeerKAT primary beam model described by Asad et al. (2021). To reveal multiple emission scales, we created multiple images with the sets of parameters given in Table 2.
Parameters of the radio imaging of RXJ1347.
3.1.2. uGMRT 700 MHz and 1.26 GHz
RXJ1347 was observed with the upgraded Giant Metrewave Radio Telescope (uGMRT) at 700 MHz (Band 4) and 1.26 GHz (Band 5) for a total duration of 4.5 and 9.5 hours, respectively. The observations have an usable bandwidth of 300 MHz and 394 MHz with the central frequencies at 700 MHz and 1260 MHz, respectively. More details are presented in Table 1.
The uGMRT data were calibrated using the Source Peeling and Atmospheric Modelling (SPAM; Intema et al. 2009) pipeline, which provides high-fidelity images for extended radio emission for interferometric data from the uGMRT. This semi-automatic pipeline corrects for both direction-independent and direction-dependent effects that can distort the propagation of radio signals from astronomical sources to the telescope receivers, given the telescope’s wide field of view, a full width at half maximum (FWHM) of 40′ at 700 MHz and 22′ at 1.26 GHz. To calibrate the wide-band uGMRT data, the data were split into six sub-bands, each with a bandwidth of 33.3 MHz, to minimise the calibration errors caused by the non-uniform flux density of sources across the broader bandwidth (300 MHz for Band 4 and 394 MHz for Band 5). Each sub-band dataset was processed separately with SPAM, using 3C 295 as the primary flux calibrator that is set to the flux scale of Scaife & Heald (2012). Initial phase calibration was performed on the wide-field dataset, followed by multiple iterations of amplitude and phase direction-dependent calibration on various sub-fields (facets) of the target field. The direction-dependent calibration solutions were used to derive the ionospheric corrections that were applied to the data. We note that we skipped the ionospheric corrections for some of the uGMRT 1.26 GHz sub-datasets, due to the minor effects of the ionosphere on the radio signal at this frequency range (i.e. using the option allow_selfcal_skip = True). The sub-band datasets then underwent through a phase and amplitude self-calibration to minimise the difference due to the calibration of the sub-datasets. The self-calibrated data were concatenated and deconvolved to produce total intensity images of the target field. Finally, primary beam correction was applied using an uGMRT primary beam correction script4 to obtain the final images. The imaging parameters are shown in Table 2.
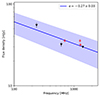 |
Fig. 1. Integrated spectrum for the central radio galaxy. The data points measured in this work are marked in red. The light blue region shows the 1σ uncertainty of the best-fit line. |
3.1.3. Discrete source subtraction
Radio emission from galaxies was observed in the central region of RXJ1347 (see Figs. 2 and 3 in Gitti et al. 2007), with a prominent source originating from the central Brightest Cluster Galaxy (BCG, i.e. the BCG A in Fig. 7 of Mason et al. 2010). To remove these discrete radio sources, primarily focusing on the removal of the central radio galaxy, we created high-resolution models using WSClean (Offringa & Smirnov 2017). To filter out the cluster’s diffuse emission, we generated images with uv minimums between 5 kλ and 19 kλ (in increment of 2 kλ) and applied Briggs weighting with a robust parameter of −2. The models were then subtracted from the uv data.
In Fig. A.1 we show the MeerKAT images of the cluster central region before and after the subtraction, which show the detection of the central radio galaxy as a point-like source. This is consistent with the VLA 1.4 GHz observations (Gitti et al. 2007) and the Gaussian model of the source at 614 MHz (Ferrari et al. 2011). The images also show the present of the diffuse emission from the ICM which becomes less prominent in the images with higher uv cuts (uvmin ≥ 13 kλ). The flux densities of the central radio galaxy measured in these images remain relatively constant (see Fig. A.1). Its flux density, obtained from the 13 kλuv cut-off image where the radio galaxy begins to separate from the diffuse emission, is 31.7 ± 1.6 mJy.
Similarly, we measured the flux density of the central radio galaxy from the uGMRT 700 MHz and 1.26 GHz images with a uv minimum cut of 13 kλ. Our measurements, along with those reported by Gitti et al. (2007) and Ferrari et al. (2011), are given in Table 3 and are fitted with an exponential function. The spectrum of the radio galaxy is plotted in Fig. 1. Our measurements align with the previous ones and fall within the 1σ uncertainty range of the best-fit power-law line, indicating that the central radio galaxy is effectively modelled and subtracted from the data.
Flux density of the central radio galaxy.
3.2. Chandra X-ray data
RXJ1347 was observed multiple times with the Advanced CCD Imaging Spectrometer (ACIS), totalling 234 ks of observing time. Details of the observations are given in Table 4. We reprocessed the archival data using the ClusterPyXT package (Alden et al. 2019), which makes use of the Chandra Interactive Analysis of Observations (CIAO) package and the Chandra Calibration Database (CalDB; version 4.9.2). During the reprocessing, compact sources in the observing field were visually identified and masked out. No compact source is found within the radius of 500 kpc from the cluster centre (i.e. the X-ray SB peak). The observations were then merged to generate a combined image of the cluster field. For more details on the processing, we refer to Alden et al. (2019).
Details of the Chandra observations of RXJ1347.
4. Results
In Figs. 2 and 3, we present the multi-wavelength radio maps of the galaxy cluster RXJ1347, taken with the MeerKAT at 1.28 GHz and the uGMRT at 1.26 GHz and 700 MHz. Figure 4 shows the Chandra X-ray map overlaid with the MeerKAT radio emission contours. The following sub-sections detail the observed properties of the cluster’s diffuse radio emission and its correlation with the thermal X-ray diffuse emission.
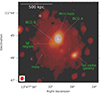 |
Fig. 2. MeerKAT 1.28 GHz image of RXJ1347 overlaid with the HST RGB-band colour image. The radio emission from the central BCG has not been subtracted in this image. The radio contour starts from 3σ, where σ = 10 μJy beam−1, and are subsequently spaced by a factor of 2. The synthesis beam of 9.5″ × 8.9″ (position angle of −23) for the radio data is shown in the bottom left corner. |
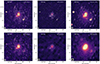 |
Fig. 3. Radio intensity maps of RXJ1347 at 700 MHz (left column), 1.26 GHz (middle column), and 1.28 GHz (right column). The discrete sources including the central BCG are removed in the second row. The first thick contours are drawn at 3σ, and the subsequent contours are multiplied by a factor of 2. The thin contour levels are at 2σ. Here σ is 20 μJy beam−1 (and 32 μJy beam−1) at 700 MHz, 18 μJy beam−1 (and 121 μJy beam−1) at 1.26 GHz, and 10 μJy beam−1 (and 15 μJy beam−1) at 1.28 GHz for the first (and second) row images. The SE region where excess radio and X-ray emission is observed is marked with the plus sign (+). The beam is displayed in the lower left-hand corner in each panel. |
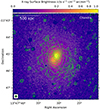 |
Fig. 4. Chandra X-ray image overlaid with its grey contours. The MeerKAT 1.28 GHz (green) contours are also displayed. The discrete sources are removed from the Chandra and MeerKAT data. |
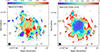 |
Fig. 5. Left: Distribution of spectral indices between 700 MHz and 1.28 GHz. The overlaid contours are drawn from the corresponding MeerKAT 1.28 GHz map. The contours start from 3σ, and are spaced by a factor of 2. Right: Associated spectral index error. |
4.1. Diffuse radio emission
The MeerKAT 1.28 GHz images in Figs. 2 and 3 (right panels) show the extended radio emission in the central region of the cluster, known as a mini-halo (Gitti et al. 2007; Ferrari et al. 2011). With our sensitive observations the diffuse emission is detected further to the cluster periphery, which is beyond the reported size (i.e. LLS = 640 kpc). The largest linear projected size of the diffuse radio emission in the MeerKAT image in Fig. 3 (bottom right panel) is 1 Mpc. Located in the centre of the cool-core main cluster is the BCG that hosts a radio-loud AGN galaxy (Gitti et al. 2007; Mason et al. 2010). As seen in Fig. 2, approximately 100 kpc to the eastern side from the main BCG is a radio-quiet AGN galaxy (i.e. the second BCG) belonging to the sub-cluster merging from the SW direction towards the NE (Gitti et al. 2007; Mason et al. 2010). An excess of diffuse radio emission is detected in the region about 125 kpc towards the SE from the centre of the main cluster, where excess X-ray emission was also reported (e.g. Ota et al. 2008).
Figure 3 displays the uGMRT images (left and middle panels) at the frequency of 700 MHz and 1.26 GHz. In the second row, the discrete sources including the central AGN radio galaxy are removed. In the uGMRT images, diffuse radio emission is detected in the central region of the cluster and has a LLS of 550 kpc and 380 kpc, respectively. The source projected size in the uGMRT 1.26 GHz image is half of that in the MeerKAT 1.28 GHz image at equivalent frequency and resolution. This is likely due to the missing short baselines and/or the low sensitivity of the uGMRT observations. Towards the SE region of the cluster, additional diffuse emission is also seen in the uGMRT images (marked with the plus sign in Fig. 3). This is coincident with that in the MeerKAT image and with the reports in the literature (Gitti et al. 2007; Ferrari et al. 2011).
In Fig. 5 we show a spectral index map that was made with the uGMRT 700 MHz and MeerKAT 1.28 GHz datasets. To ensure equivalent sensitivity to diffuse emission across different scales, the uGMRT and MeerKAT intensity images are created with a common uv range between 0.120 kλ and 41 kλ (see Table 2). The spectral index map reveals a patchy distribution in the cluster central region, but it remains relatively flat with a mean value of α = −1.10 and a standard deviation of 0.08. This variation is still within the typical spectral index error of ∼0.12 in the region. In the cluster outskirts, the spectral index becomes steeper, down to ∼ − 3. Behind the SE shock-heated region, the spectral index does not indicate any clear spatial gradient trends.
4.2. Radial SB profiles
The MeerKAT 1.28 GHz discrete-source-subtracted image in Fig. 3 (right panels) indicates the possible existence of different radial gradients in the SB of the diffuse radio emission. To further examine this, we made the radial SB profile using the MeerKAT 1.28 GHz data. The SB was extracted within the annuli centred on the peak emission of the radio image (see Fig. 6, left panel). The width of the annulus is set at 9″ which is equal to the size of the synthesised beam of the image. To avoid the contamination from imperfect source subtraction, we masked out the radio emission from discrete sources and the SE excess diffuse emission. In Fig. 6 (right panel) we show the extracted radio SB profile.
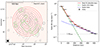 |
Fig. 6. Radial SB profiles. Left: Annular regions (in red) where SB is extracted. The widths of the annuli are equal to 9″. The radio emission from the discrete sources are masked with the green regions and are not used in the analysis. Right: Radio radial profile and the best-fit model. |
Diffuse radio emission in the cluster central regions, known as mini-halos and halos, generally follows the exponential functions of the form

where I0 is the peak intensity and re is the e-folding radius that qualifies how fast the SB decreases as a function of radius (e.g. Murgia et al. 2009). We fit the radio SB profile of RXJ1347 to a double exponential function,

where Iinner and Iouter, given individually in Eq. (1), are the mean radial intensity for the inner and outer components of the diffuse emission. We list the best-fit parameters for the double exponential model in Table 5. The best-fit lines for the SB profile are presented in Fig. 6 (right panel). The peak intensity for the inner component is a factor of 20 times brighter than the outer component: I0, inner ≈ 20 I0, outer. The inner e-folding radius is roughly seven times smaller than that in the outer component: re, inner ≈ re, outer/5.
Radial SB profile fitting results for the MeerKAT 1.28 GHz data.
Following Murgia et al. (2009), we used the best-fit parameters to estimate the flux densities for the diffuse sources by integrating the flux densities (i.e. Eq. 1) to a radius of 3 re. These flux densities are equal to 80 percent of the total flux density when integrating to infinity. We obtain flux densities of 20.4 ± 1.7 mJy and 21.8 ± 11.0 mJy at 1.28 GHz for the inner and outer components, respectively. These correspond to the k-corrected radio power of (15.9 ± 1.7)×1024 W Hz−1 and (19.0 ± 10.0)×1024 W Hz−1. Here we used the spectral indices of −1.1 ± 0.2 and −1.4 ± 0.2 for the inner and outer regions, respectively.
4.3. Spatial radio–X-ray SB correlation
Radio and X-ray diffuse emission from cluster central regions are known to correlate, thus probing the connection between the non-thermal (i.e. relativistic electrons and magnetic fields) and thermal components (e.g. Govoni et al. 2001a; Ignesti et al. 2020; Botteon et al. 2020; Biava et al. 2021; Riseley et al. 2022; Bonafede et al. 2022; Lusetti et al. 2024). This correlation is generally described with a power-law relation of the form5
where a and b are free parameters. The slope b indicates how tightly the radio and X-ray emission are correlated. The radio SB reduces more quickly (or slowly) compared with the X-ray SB for larger (or smaller) values of b. The radio and X-ray SB is linearly related in the case of b = 1. The relation is super-linear for b > 1 and sub-linear for b < 1.
We examined the spatial relation between the radio and X-ray diffuse emission in RXJ1347. We extracted the SB within the square boxes from the radio (uGMRT 700 MHz and MeerKAT 1.28 GHz) and X-ray (Chandra) images. The box size is equal to the resolution (9″) of the radio images. The boxes in black and magenta are placed within the 3σ X-ray contour that fully covers the area of the radio emission (see Figs. 4 and 7). The regions of discrete sources (i.e. radio galaxies and the SE excess emission; see Fig. 7, left panel) are masked and are excluded from the analysis. In Fig. 7 (middle panel), we present the scatter plot of the radio and X-ray SB extracted from the square boxes. The data points that have SB below 2σ in the radio maps are considered as non-detections and are indicated by downward arrows in Fig. 7 (middle panel).
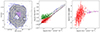 |
Fig. 7. Spatial radio–X-ray SB correlation. Left: Box regions, within the 3σChandra (blue) contour, where the SB is extracted. The first Chandra (blue) and MeerKAT (black) contours are levelled at 3σ, where σ = 2 × 10⁻⁸ and σ = 12 μJy beam−1, respectively. The next contours are spaced by a factor of 2. Discrete sources are masked and indicated by black dashed lines. Middle: Radio–X-ray correlation for the uGMRT 700 MHz data (i.e. green and blue points) and the MeerKAT 1.28 GHz data (i.e. red and magenta points) with the Chandra data. The thin and thick solid lines are the best-fit lines for the uGMRT and MeerKAT data, respectively. The dash-dotted and dashed lines are from the data in the inner (magenta) and outer regions, respectively. Right: Correlation between the spectral index and the X-ray SB. The data points with the best-fit (dashed and dash-dotted lines) for the inner and outer regions are shown in red and magenta, respectively. |
We fit Eq. (3) with the extracted radio and X-ray SB within the boxes using the linmix6 package that implements a hierarchical Bayesian model taking into account the uncertainties in both dependent and independent variables (Kelly 2007). In addition, linmix allows the fitting with datasets consisting of non-detections or missing data points. We obtained a sub-linear slope of b700 MHz = 0.82 ± 0.04 for the uGMRT 700 MHz–X-ray dataset and a linear slope of b1.28 GHz = 0.98 ± 0.03 for the MeerKAT 1.28 GHz–X-ray dataset.
The radio–X-ray SB scatter plot in Fig. 7 (middle panel) shows possible different slopes in the inner and outer regions of the cluster. To examine this possibility, we separately fit the power-law relation in Eq. (3) with the sub-datasets for the inner and outer clusters. The inner and outer regions are shown in Fig. 7 (left panel) in magenta and black, respectively. We obtained the best-fit slopes for the sub-datasets, and show them in Table 6. The best-fit slope of b700 MHz = 0.87 ± 0.09 for the inner region is steeper than that of b700 MHz = 0.56 ± 0.06 for the outer region. However, across the large area of the diffuse emission the slope at 1.28 GHz remains unchanged (i.e. b1.28 GHz = 0.91 ± 0.09 for the centre and b1.28 GHz = 0.89 ± 0.05 for the outskirts).
Best-fit slope for the spatial radio vs X-ray SB relation.
The correlation between spectral index and X-ray SB has been reported in a number of clusters (e.g. Botteon et al. 2020; Rajpurohit et al. 2021; Biava et al. 2021). The relation is described as
where a′ and b′ are free parameters. To examine the correlation in RXJ1347, we present a scatter plot between the 700 MHz–1.28 GHz spectral index and X-ray SB in Fig. 7 (right panel). The square regions where the data is extracted are identical to those used in the radio–X-ray SB analysis (see Fig. 7, left panel). Interestingly, the scatter plot shows two distinct regions (i.e. in red and magenta) with different slopes for the X-ray SB below and above IX = 12.6 × 10⁻⁶ cts s−1 arcmin−2 cm−2 (or log(IX) = −5.9). The data points with low X-ray SB (i.e. outer region of the cluster) follow a super-linear relation with a slope of b′=1.22 ± 0.23, indicating a tight correlation between the spectral index and X-ray SB. However, the correlation slope flattens to b′=0.16 ± 0.14 in the inner region (i.e. high X-ray SB), implying extremely weak α − IX correlation.
5. Discussion
5.1. Multi-component diffuse emission
Mini-halos and radio halos are usually not observed in the same galaxy cluster. While mini-halos are predominantly found in relaxed cool-core systems, radio halos are often associated with dynamically disturbed galaxy clusters. Thanks to advancements in radio telescopes, particularly at sub-GHz frequencies, fainter diffuse steep-spectrum (α ≲ −1) radio emission has been recently observed in several systems. This has led to the detection of multiple central diffuse radio components within a handful of galaxy clusters. For instance, a combination of mini-halo and halo-like emission has been found in some galaxy clusters with LOFAR at 144 MHz (Savini et al. 2019; Lusetti et al. 2024; Biava et al. 2024; van Weeren et al. 2024). These include the dynamically relaxed clusters hosting cool cores (PSZ1 G139.61+24, RX J1720.1+2638, PSZ1 G139.61+24, Abell 1068, MS 1455.0+2232, RX J1720.1+2638, and Perseus cluster) and non-cool cores (Abell 1413). Cuciti et al. (2022) also discovered ≳2 Mpc mega radio halos enveloping ≲1 Mpc radio halos in some merging galaxy clusters (Abell 665, Abell 697, Abell 2218, and ZwCl 0634.1+4750) using the LoTSS 144 MHz data.
Our deep MeerKAT observations of RXJ1347 at 1.28 GHz show that the radial radio SB profile is consistent with a double exponential model (see Sect. 4.2). The e-folding radii for the inner (re, inner = 43 ± 5 kpc) and outer (re, outer = 204 ± 58 kpc) components are within the typical ranges for those in mini-halos and halos, respectively. Previous observations found that the e-folding radius is typically smaller than ∼100 kpc for mini-halos and is larger, up to ∼500 kpc, for radio halos (e.g. Murgia et al. 2009; Lusetti et al. 2024; Biava et al. 2024; Balboni et al. 2024). In addition, the best-fit SB peak for the inner component of RXJ1347 is significantly higher than that for the outer component, a factor of 20 at 1.28 GHz. In other similar cases hosting both a mini-halo and a halo, this ratio at 144 MHz ranges between 7 in MS 1455.0+2232 and 340 in RX J1720.1+2638 (e.g. Lusetti et al. 2024; Biava et al. 2024). Moreover, the different dependence of the spectral index on the X-ray SB for the inner and outer regions through the α − IX slopes (binner′=0.16 ± 0.14 and bouter′=1.22 ± 0.23, respectively) indicates the different natures of the diffuse components. Furthermore, the flux densities for the mini-halo and halo we obtained in Sect. 4.2 are translated to volume emissivities of (6.0 ± 2.2)×10−40 erg s−1 Hz−1 cm−3 and (6.7 ± 6.8)×10−42 erg s−1 Hz−1 cm−3, respectively. These are in line with the values of ∼10−40 erg s−1 Hz−1 cm−3 and ∼10−42 erg s−1 Hz−1 cm−3 for mini-halos and halos reported in literature (e.g. Murgia et al. 2009). In short, these results suggest that the cool-core galaxy cluster RXJ1347 hosts both a radio mini-halo and a radio halo.
5.2. Particle acceleration mechanisms
The spatial correlation between radio and X-ray emissions indicates a connection between the cluster’s non-thermal components (CRes and magnetic fields) and its thermal components. This correlation has proved to be a valuable tool for investigating the mechanisms driving the acceleration of relativistic electrons in the ICM (e.g. Govoni et al. 2001b). In a merging galaxy cluster, a fraction of the gravitational energy dissipated during the collision can be converted into non-thermal components through the acceleration of CRes and the amplification of magnetic fields. The radio emissivity is given by
where B is the magnetic field strength, ν is the frequency, and α = (1 − δ)/2 is the spectral index with δ being the index of the power-law energy distribution of N(ϵ)dϵ = N0ϵ−δdϵ; here ϵ is the energy and N0 is the normalisation (e.g. Govoni & Feretti 2004). The emissivity of the thermal Bremsstrahlung producing X-rays is a function of the thermal electron density ne and temperature kTe:
Hence, a connection between the radio and X-ray emissions may suggest a relationship between the non-thermal and thermal components of the cluster:
It is important to note that the spatial distribution of the spectral index of the radio-emitting electrons also plays a significant role in this correlation, a factor that is often overlooked.
In the central mini-halo region of RXJ1347, we find a best-fit slope of b700 MHz = 0.87 ± 0.09 for the IR − IX correlation. At the higher frequency of 1.28 GHz, the slope increases slightly to b1.28 GHz = 0.91 ± 0.09, although it remains within the 1σ uncertainty. While the high-frequency slope does not clearly indicate a sub-linear relation, the slope at low frequency shows a sub-linear relation. To our knowledge, this mini-halo is the first to show a sub-linear slope in the radio and X-ray SB correlation.
A recent study by Riseley et al. (2024) reports a sub-linear slope for the IR − IX correlation for the central region of the merging galaxy cluster Abell 2142. However, the nature of the diffuse radio emission in this cluster remains uncertain; it could be a mix of a mini-halo and a halo (Venturi et al. 2017) or simply a multi-component radio halo (Bruno et al. 2023). Previous studies of confirmed mini-halos have consistently found linear or super-linear IR − IX relations (Biava et al. 2021; Ignesti et al. 2020; Riseley et al. 2022; Lusetti et al. 2024), which implies that the hadronic model for the acceleration of the CRes cannot be ruled out in these systems (Govoni et al. 2001b).
The sub-linear relation observed in the RXJ1347 mini-halo suggests that the particle acceleration mechanism may involve more than just hadronic processes. It is possible that additional mechanisms, such as turbulence, also contribute to the diffuse radio emission. Thus, a combination of particle acceleration processes, including both hadronic and turbulent processes, might be at play in this mini-halo.
In the outer halo region, we observe a slope of b700 MHz = 0.56 ± 0.06 at 700 MHz, which increases to b1.28 GHz = 0.89 ± 0.05 at the higher frequency. Both slopes are sub-linear, consistent with previous studies that have reported sub-linear correlations between the radio and X-ray SB emission in dynamically disturbed galaxy clusters (e.g. Giacintucci et al. 2005; Cova et al. 2019; Xie et al. 2020; Hoang et al. 2021; Santra et al. 2024). This sub-linear scaling in radio halos suggests that purely hadronic processes are unlikely to account for the observed correlation as such processes would require a non-physically high contribution from CRps (e.g. Brunetti & Jones 2014).
An investigation by Balboni et al. (2024) finds that the non-thermal and thermal relation in five clusters hosting radio halos, using the LoTSS 144 MHz and CHEX-MATE (Cluster HEritage project with XMM-Newton – Mass Assembly and Thermodynamics at the Endpoint of structure formation; Arnaud et al. 2021) data. The authors find that the IR − IX correlation is sub-linear and varies with radius, differing across clusters. In two relatively relaxed clusters, Abell 2244 and Abell 2409, the slope decreases in the outer region, indicating that the diffuse radio emission flattens with radius in these clusters. This pattern is also observed in RXJ1347 at 700 MHz, where the slope decreases from 0.87 ± 0.09 in the inner region to 0.56 ± 0.06 in the outer region. However, at the higher frequency of 1.28 GHz the slope remains unchanged with radius, around 0.9 ± 0.1.
The spectrum steepens from ∼ − 1 in the centre of the cluster to ∼ − 3 in the outskirts (see Fig. 7, right panel). This could be due to the lower levels of turbulent energy flux that is channelled into the particle acceleration and is typically found in the outskirts of relaxed clusters. In contrast, moving towards the cluster centre the turbulence is expected to increase, possibly resulting from past merging activities. Alternatively, the radial spectral steepening could be caused by the decrease in the magnetic field strength in the cluster outskirts (e.g. Brunetti et al. 2001; Bonafede et al. 2022). Within the central mini-halo region, the spectral index shows a slight increase towards the centre, but still remains relatively flat, at ∼ − 1. This spectral feature may suggest a connection between the mini-halo and the gas sloshing around the central radio galaxy and/or the radio-emitting CRes being additionally generated through the hadronic processes.
6. Conclusions
We provide a detailed analysis of multi-wavelength radio observations of the most X-ray luminous galaxy cluster RXJ1347, using the data from the MeerKAT at 1.28 GHz and the uGMRT at 700 MHz and 1.26 GHz. In combination with the Chandra archival data, we investigated the correlation between the cluster’s diffuse radio and X-ray diffuse emission. The key findings are summarised below:
-
We confirmed the existence of diffuse radio emission in the cluster’s central region. Our observations reveal that the diffuse emission extends over a much larger area, approximately 1 Mpc, compared to the previously reported extent of 640 kpc in the literature.
-
The radial SB of the diffuse radio emission can be modelled by a double exponential model, with the inner component being notably brighter and smaller than the outer component. Based on their brightness, size, and emissivity, the inner component is classified as a mini-halo, while the outer component fits the profile of a radio halo.
-
Our radio and X-ray point-to-point analysis reveals distinct characteristics for the radio mini-halo and halo. For the mini-halo, we observe a sub-linear slope of b700 MHz = 0.87 ± 0.09 at 700 MHz; however, the slope at 1.28 GHz, b1.28 GHz = 0.91 ± 0.09, does not show a clear sub-linear trend. In contrast, the halo exhibits a sub-linear relation at both frequencies, with a flatter slope at 700 MHz (b700 MHz = 0.56 ± 0.06) compared to the steeper slope at 1.28 GHz (b1.28 GHz = 0.89 ± 0.05).
-
The correlation between the spectral index and X-ray emission reveals distinct trends for the mini-halo and halo. In the mini-halo region, the spectral index shows a slight increase towards the cluster centre, with a slope of b′inner = 0.16 ± 0.14. In contrast, the halo has a clear spectral steepening, with a slope of b′outer = 1.22 ± 0.23. These findings indicate that different mechanisms are likely responsible for the formation of the mini-halo and the halo within the cluster.
-
Our results on the sub-linear slopes observed in the radio versus X-ray relation for the radio halo are in line with the re-acceleration scenario in which the radio-emitting CRes are energised by turbulent processes. The observed spectral index steepens with radial distance, which we interpret as a result of turbulent energy from a past merger decreasing with distance from the cluster centre. In the mini-halo, however, the spectral index remains relatively constant with respect to the X-ray SB, indicating that the acceleration of the radio-emitting CRes is uniformly distributed across the mini-halo region, which spans approximately ∼100 kpc in radius. It is not entirely clear whether this acceleration is primarily due to hadronic processes or re-acceleration origin. The slightly sub-linear slope in the radio versus X-ray relation suggests that while the turbulent model might contribute to the (re-) acceleration of the CRes in the mini-halo, it could be working in conjunction with hadronic processes, as has been proposed in other galaxy clusters.
Acknowledgments
DNH is supported by the Deutsche Forschungsgemeinschaft (DFG, German Research Foundation) under research unit FOR 5195: “Relativistic Jets in Active Galaxies”. DNH, AB acknowledge support from the ERC through the grant ERC-Stg DRANOEL n. 714245. MB acknowledges funding by the DFG under Germany’s Excellence Strategy – EXC 2121 “Quantum Universe” – 390833306. The MeerKAT telescope is operated by the South African Radio Astronomy Observatory, which is a facility of the National Research Foundation, an agency of the Department of Science and Innovation. We thank the staff of the GMRT who made these observations possible. The GMRT is run by the National Centre for Radio Astrophysics of the Tata Institute of Fundamental Research. The scientific results reported in this article are based on data obtained from the Chandra Data Archive. This research has made use of software provided by the Chandra X-ray Center (CXC) in the application packages CIAO, ChIPS, and Sherpa.
References
- Abell, G. O., Corwin, H. G., & Olowin, R. P. 1989, ApJS, 70, 1 [Google Scholar]
- Ackermann, M., Ajello, M., Albert, A., et al. 2016, ApJ, 819, 149 [Google Scholar]
- Adam, R., Goksu, H., Brown, S., Rudnick, L., & Ferrari, C. 2021, A&A, 648, A60 [NASA ADS] [CrossRef] [EDP Sciences] [Google Scholar]
- Alden, B., Hallman, E. J., Rapetti, D., Burns, J. O., & Datta, A. 2019, Astron. Comput., 27, 147 [NASA ADS] [Google Scholar]
- Allen, S. W., Schmidt, R. W., & Fabian, A. C. 2002, MNRAS, 335, 256 [NASA ADS] [CrossRef] [Google Scholar]
- Arnaud, M., Ettori, S., Pratt, G. W., et al. 2021, A&A, 650, A104 [NASA ADS] [CrossRef] [EDP Sciences] [Google Scholar]
- Asad, K. M. B., Girard, J. N., de Villiers, M., et al. 2021, MNRAS, 502, 2970 [CrossRef] [Google Scholar]
- Balboni, M., Gastaldello, F., Bonafede, A., et al. 2024, A&A, 686, A5 [NASA ADS] [CrossRef] [EDP Sciences] [Google Scholar]
- Biava, N., De Gasperin, F., Bonafede, A., et al. 2021, MNRAS, 508, 3995 [NASA ADS] [CrossRef] [Google Scholar]
- Biava, N., Bonafede, A., Gastaldello, F., et al. 2024, A&A, 686, A82 [NASA ADS] [CrossRef] [EDP Sciences] [Google Scholar]
- Blasi, P., & Colafrancesco, S. 1999, Astropart. Phys., 12, 169 [Google Scholar]
- Bonafede, A., Brunetti, G., Rudnick, L., et al. 2022, ApJ, 933, 218 [NASA ADS] [CrossRef] [Google Scholar]
- Botteon, A., Brunetti, G., van Weeren, R. J., et al. 2020, ApJ, 897, 93 [Google Scholar]
- Botteon, A., van Weeren, R. J., Brunetti, G., et al. 2022, Sci. Adv., 8, eabq7623 [NASA ADS] [CrossRef] [Google Scholar]
- Brunetti, G., & Blasi, P. 2005, MNRAS, 363, 1173 [Google Scholar]
- Brunetti, G., & Jones, T. W. 2014, Int. J. Mod. Phys. D, 23, 1430007 [Google Scholar]
- Brunetti, G., & Lazarian, A. 2007, MNRAS, 378, 245 [Google Scholar]
- Brunetti, G., & Lazarian, A. 2011, MNRAS, 412, 817 [NASA ADS] [Google Scholar]
- Brunetti, G., Setti, G., Feretti, L., & Giovannini, G. 2001, MNRAS, 320, 365 [Google Scholar]
- Brunetti, G., Giacintucci, S., Cassano, R., et al. 2008, Nature, 455, 944 [Google Scholar]
- Brunetti, G., Blasi, P., Reimer, O., et al. 2012, MNRAS, 426, 956 [Google Scholar]
- Brunetti, G., Zimmer, S., & Zandanel, F. 2017, MNRAS, 472, 1506 [Google Scholar]
- Bruno, L., Botteon, A., Shimwell, T., et al. 2023, A&A, 678, A133 [NASA ADS] [CrossRef] [EDP Sciences] [Google Scholar]
- Buote, D. A., & Tsai, J. C. 1995, ApJ, 452, 522 [Google Scholar]
- Cassano, R., & Brunetti, G. 2005, MNRAS, 357, 1313 [Google Scholar]
- Cassano, R., Gitti, M., & Brunetti, G. 2008, A&A, 486, L31 [NASA ADS] [CrossRef] [EDP Sciences] [Google Scholar]
- Cassano, R., Ettori, S., Giacintucci, S., et al. 2010, ApJ, 721, L82 [Google Scholar]
- Cassano, R., Ettori, S., Brunetti, G., et al. 2013, ApJ, 777, 141 [Google Scholar]
- Cova, F., Gastaldello, F., Wik, D. R., et al. 2019, A&A, 628, A83 [NASA ADS] [CrossRef] [EDP Sciences] [Google Scholar]
- Cuciti, V., de Gasperin, F., Brueggen, M., et al. 2022, Nature, 609, 911 [NASA ADS] [CrossRef] [Google Scholar]
- Dennison, B. 1980, ApJ, 239, L93 [Google Scholar]
- Dolag, K., & Ensslin, T. A. 2000, A&A, 157, 151 [Google Scholar]
- Enßlin, T. A., & Gopal-Krishna 2001, A&A, 366, 26 [NASA ADS] [CrossRef] [EDP Sciences] [Google Scholar]
- Enßlin, T. A., Biermann, P. L. P., Klein, U., et al. 1998, A&A, 409, 395 [Google Scholar]
- Feretti, L., Fusco-Femiano, R., Giovannini, G., & Govoni, F. 2001, A&A, 373, 106 [NASA ADS] [CrossRef] [EDP Sciences] [Google Scholar]
- Ferrari, C., Intema, H. T., Orrù, E., et al. 2011, A&A, 534, L12 [NASA ADS] [CrossRef] [EDP Sciences] [Google Scholar]
- Giacintucci, S., Venturi, T., Brunetti, G., et al. 2005, A&A, 440, 867 [NASA ADS] [CrossRef] [EDP Sciences] [Google Scholar]
- Gitti, M., & Schindler, S. 2004, A&A, 427, L9 [NASA ADS] [CrossRef] [EDP Sciences] [Google Scholar]
- Gitti, M., Ferrari, C., Domainko, W., Feretti, L., & Schindler, S. 2007, A&A, 470, L25 [NASA ADS] [CrossRef] [EDP Sciences] [Google Scholar]
- Govoni, F., & Feretti, L. 2004, Int. J. Mod. Phys. D, 13, 1549 [Google Scholar]
- Govoni, F., Feretti, L., Giovannini, G., et al. 2001a, A&A, 819, 803 [CrossRef] [EDP Sciences] [Google Scholar]
- Govoni, F., Enßlin, T. A., Feretti, L., & Giovannini, G. 2001b, A&A, 369, 441 [NASA ADS] [CrossRef] [EDP Sciences] [Google Scholar]
- Hoang, D. N., Zhang, X., Stuardi, C., et al. 2021, A&A, 656, A154 [NASA ADS] [CrossRef] [EDP Sciences] [Google Scholar]
- Hoeft, M., Brüggen, M., Yepes, G., Gottlöber, S., & Schwope, A. 2008, MNRAS, 391, 1511 [NASA ADS] [CrossRef] [Google Scholar]
- Ignesti, A., Brunetti, G., Gitti, M., & Giacintucci, S. 2020, A&A, 640, A37 [NASA ADS] [CrossRef] [EDP Sciences] [Google Scholar]
- Intema, H. T., van der Tol, S., Cotton, W. D., et al. 2009, A&A, 501, 1185 [NASA ADS] [CrossRef] [EDP Sciences] [Google Scholar]
- Jeltema, T. E., & Profumo, S. 2011, ApJ, 728, 53 [Google Scholar]
- Kelly, B. C. 2007, ApJ, 665, 1489 [Google Scholar]
- Kitayama, T., Komatsu, E., Ota, N., et al. 2004, PASJ, 56, 17 [NASA ADS] [Google Scholar]
- Kitayama, T., Ueda, S., Takakuwa, S., et al. 2016, PASJ, 68, 88 [Google Scholar]
- Komatsu, E., Matsuo, H., Kitayama, T., et al. 2001, PASJ, 53, 57 [Google Scholar]
- Liang, H., Hunstead, R. W., Birkinshaw, M., & Andreani, P. 2000, ApJ, 544, 686 [Google Scholar]
- Lusetti, G., Bonafede, A., Lovisari, L., et al. 2024, A&A, 683, A132 [NASA ADS] [CrossRef] [EDP Sciences] [Google Scholar]
- Mason, B. S., Dicker, S. R., Korngut, P. M., et al. 2010, ApJ, 716, 739 [NASA ADS] [Google Scholar]
- Murgia, M., Govoni, F., Markevitch, M., et al. 2009, A&A, 499, 679 [NASA ADS] [CrossRef] [EDP Sciences] [Google Scholar]
- Offringa, R., & Smirnov, O. 2017, MNRAS, 471, 301 [NASA ADS] [CrossRef] [Google Scholar]
- Ota, N., Murase, K., Kitayama, T., et al. 2008, A&A, 491, 363 [NASA ADS] [CrossRef] [EDP Sciences] [Google Scholar]
- Petrosian, V. 2001, ApJ, 557, 560 [Google Scholar]
- Pfrommer, C., Enßlin, T. A., & Ensslin, T. A. 2004, MNRAS, 352, 76 [NASA ADS] [CrossRef] [Google Scholar]
- Pinzke, A., Oh, S. P., & Pfrommer, C. 2017, MNRAS, 465, 4800 [Google Scholar]
- Planck Collaboration XXIV. 2016, A&A, 594, A24 [NASA ADS] [CrossRef] [EDP Sciences] [Google Scholar]
- Poole, G. B., Fardal, M. A., Babul, A., et al. 2006, MNRAS, 373, 881 [Google Scholar]
- Rajpurohit, K., Brunetti, G., Bonafede, A., et al. 2021, A&A, 646, A135 [NASA ADS] [CrossRef] [EDP Sciences] [Google Scholar]
- Riseley, C. J., Rajpurohit, K., Loi, F., et al. 2022, MNRAS, 512, 4210 [NASA ADS] [CrossRef] [Google Scholar]
- Riseley, C. J., Bonafede, A., Bruno, L., et al. 2024, A&A, 686, A44 [NASA ADS] [CrossRef] [EDP Sciences] [Google Scholar]
- Santos, J. S., Rosati, P., Tozzi, P., et al. 2008, A&A, 483, 35 [NASA ADS] [CrossRef] [EDP Sciences] [Google Scholar]
- Santra, R., Kale, R., Giacintucci, S., et al. 2024, ApJ, 962, 40 [NASA ADS] [CrossRef] [Google Scholar]
- Savini, F., Bonafede, A., Brüggen, M., et al. 2019, A&A, 622, A24 [NASA ADS] [CrossRef] [EDP Sciences] [Google Scholar]
- Scaife, A. M. M., & Heald, G. H. 2012, MNRAS, 423, 30 [Google Scholar]
- Schindler, S., Guzzo, L., Ebeling, H., et al. 1995, A&A, 299, L9 [NASA ADS] [Google Scholar]
- Ueda, S., Kitayama, T., Oguri, M., et al. 2018, ApJ, 866, 48 [NASA ADS] [CrossRef] [Google Scholar]
- van Weeren, R. J., Rottgering, H. J. A., Bruggen, M., & Hoeft, M. 2010, Science, 330, 347 [Google Scholar]
- van Weeren, R. J., de Gasperin, F., Akamatsu, H., et al. 2019, Space Sci. Rev., 215, 16 [Google Scholar]
- van Weeren, R. J., Timmerman, R., Vaidya, V., et al. 2024, A&A, 692, A12 [NASA ADS] [CrossRef] [EDP Sciences] [Google Scholar]
- Venturi, T., Rossetti, M., Brunetti, G., et al. 2017, A&A, 603, A125 [NASA ADS] [CrossRef] [EDP Sciences] [Google Scholar]
- Wen, Z. L., Han, J. L., & Liu, F. S. 2012, ApJS, 199, 34 [Google Scholar]
- Xie, C., van Weeren, R. J., Lovisari, L., et al. 2020, A&A, 636, A3 [NASA ADS] [CrossRef] [EDP Sciences] [Google Scholar]
- Zandanel, F., Pfrommer, C., & Prada, F. 2014, MNRAS, 438, 124 [Google Scholar]
- ZuHone, J. A., Markevitch, M., Brunetti, G., & Giacintucci, S. 2013, ApJ, 762, 78 [Google Scholar]
- ZuHone, J. A., Brunetti, G., Giacintucci, S., & Markevitch, M. 2015, ApJ, 801, 146 [Google Scholar]
Appendix A: Discrete source subtraction
Figures A.1 (left panels) show the radio images of the cluster RXJ1347 that were obtained with different uv minimum cut-off between 5 kλ and 19 kλ. The image with uv cut-off of 13 kλ shows clear separation between the central BCG and the surrounding diffuse emission. The BCG is subtracted from the data and are shown in the right panels. In Fig. A.2 we plot the radio flux density of the BCG measured measured from these uv cut-off images.
The models of the central radio galaxy that were obtained with uv minimum cut-off of 13 kλ were subtracted from the MeerKAT and uGMRT uv data. In Fig. A.3, we show the high-resolution images of the cluster central region with the BCG (left panels) and without (right panels).
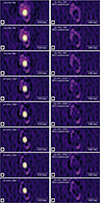 |
Fig. A.1. MeerKAT images of the centre region of RXJ1347 were created using a range of uv minimums from 5 kλ to 19 kλ. The first row shows the detection of the central BCG (A), which is removed in the second row. |
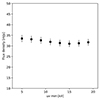 |
Fig. A.2. Flux density of the central BCG (A) measured from the images created with various uv minimums (see Fig. A.1). |
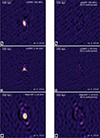 |
Fig. A.3. High-resolution images of the cluster central region with (left column) and without (right column) the radio galaxy. The synthesis beams are shown in the bottom left corners. The X-ray peak location is marked with the red cross. The contours start at 5σ and are spaced by a factor of 2. |
All Tables
All Figures
|
Fig. 1. Integrated spectrum for the central radio galaxy. The data points measured in this work are marked in red. The light blue region shows the 1σ uncertainty of the best-fit line. |
| In the text | |
|
Fig. 2. MeerKAT 1.28 GHz image of RXJ1347 overlaid with the HST RGB-band colour image. The radio emission from the central BCG has not been subtracted in this image. The radio contour starts from 3σ, where σ = 10 μJy beam−1, and are subsequently spaced by a factor of 2. The synthesis beam of 9.5″ × 8.9″ (position angle of −23) for the radio data is shown in the bottom left corner. |
| In the text | |
|
Fig. 3. Radio intensity maps of RXJ1347 at 700 MHz (left column), 1.26 GHz (middle column), and 1.28 GHz (right column). The discrete sources including the central BCG are removed in the second row. The first thick contours are drawn at 3σ, and the subsequent contours are multiplied by a factor of 2. The thin contour levels are at 2σ. Here σ is 20 μJy beam−1 (and 32 μJy beam−1) at 700 MHz, 18 μJy beam−1 (and 121 μJy beam−1) at 1.26 GHz, and 10 μJy beam−1 (and 15 μJy beam−1) at 1.28 GHz for the first (and second) row images. The SE region where excess radio and X-ray emission is observed is marked with the plus sign (+). The beam is displayed in the lower left-hand corner in each panel. |
| In the text | |
|
Fig. 4. Chandra X-ray image overlaid with its grey contours. The MeerKAT 1.28 GHz (green) contours are also displayed. The discrete sources are removed from the Chandra and MeerKAT data. |
| In the text | |
|
Fig. 5. Left: Distribution of spectral indices between 700 MHz and 1.28 GHz. The overlaid contours are drawn from the corresponding MeerKAT 1.28 GHz map. The contours start from 3σ, and are spaced by a factor of 2. Right: Associated spectral index error. |
| In the text | |
|
Fig. 6. Radial SB profiles. Left: Annular regions (in red) where SB is extracted. The widths of the annuli are equal to 9″. The radio emission from the discrete sources are masked with the green regions and are not used in the analysis. Right: Radio radial profile and the best-fit model. |
| In the text | |
|
Fig. 7. Spatial radio–X-ray SB correlation. Left: Box regions, within the 3σChandra (blue) contour, where the SB is extracted. The first Chandra (blue) and MeerKAT (black) contours are levelled at 3σ, where σ = 2 × 10⁻⁸ and σ = 12 μJy beam−1, respectively. The next contours are spaced by a factor of 2. Discrete sources are masked and indicated by black dashed lines. Middle: Radio–X-ray correlation for the uGMRT 700 MHz data (i.e. green and blue points) and the MeerKAT 1.28 GHz data (i.e. red and magenta points) with the Chandra data. The thin and thick solid lines are the best-fit lines for the uGMRT and MeerKAT data, respectively. The dash-dotted and dashed lines are from the data in the inner (magenta) and outer regions, respectively. Right: Correlation between the spectral index and the X-ray SB. The data points with the best-fit (dashed and dash-dotted lines) for the inner and outer regions are shown in red and magenta, respectively. |
| In the text | |
|
Fig. A.1. MeerKAT images of the centre region of RXJ1347 were created using a range of uv minimums from 5 kλ to 19 kλ. The first row shows the detection of the central BCG (A), which is removed in the second row. |
| In the text | |
|
Fig. A.2. Flux density of the central BCG (A) measured from the images created with various uv minimums (see Fig. A.1). |
| In the text | |
|
Fig. A.3. High-resolution images of the cluster central region with (left column) and without (right column) the radio galaxy. The synthesis beams are shown in the bottom left corners. The X-ray peak location is marked with the red cross. The contours start at 5σ and are spaced by a factor of 2. |
| In the text | |
Current usage metrics show cumulative count of Article Views (full-text article views including HTML views, PDF and ePub downloads, according to the available data) and Abstracts Views on Vision4Press platform.
Data correspond to usage on the plateform after 2015. The current usage metrics is available 48-96 hours after online publication and is updated daily on week days.
Initial download of the metrics may take a while.