Fig. 3.

Download original image
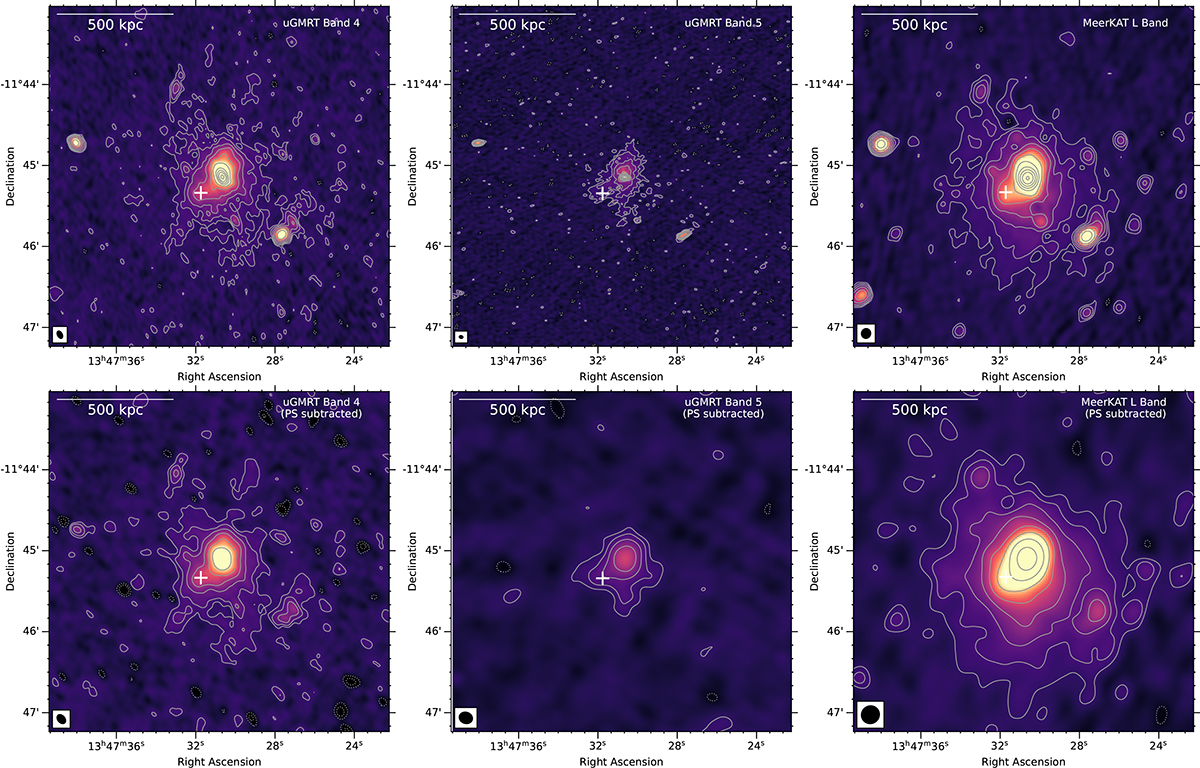
Radio intensity maps of RXJ1347 at 700 MHz (left column), 1.26 GHz (middle column), and 1.28 GHz (right column). The discrete sources including the central BCG are removed in the second row. The first thick contours are drawn at 3σ, and the subsequent contours are multiplied by a factor of 2. The thin contour levels are at 2σ. Here σ is 20 μJy beam−1 (and 32 μJy beam−1) at 700 MHz, 18 μJy beam−1 (and 121 μJy beam−1) at 1.26 GHz, and 10 μJy beam−1 (and 15 μJy beam−1) at 1.28 GHz for the first (and second) row images. The SE region where excess radio and X-ray emission is observed is marked with the plus sign (+). The beam is displayed in the lower left-hand corner in each panel.
Current usage metrics show cumulative count of Article Views (full-text article views including HTML views, PDF and ePub downloads, according to the available data) and Abstracts Views on Vision4Press platform.
Data correspond to usage on the plateform after 2015. The current usage metrics is available 48-96 hours after online publication and is updated daily on week days.
Initial download of the metrics may take a while.


