| Issue |
A&A
Volume 694, February 2025
|
|
|---|---|---|
| Article Number | A28 | |
| Number of page(s) | 20 | |
| Section | Cosmology (including clusters of galaxies) | |
| DOI | https://doi.org/10.1051/0004-6361/202451066 | |
| Published online | 30 January 2025 | |
Cosmic dance in the Shapley Concentration Core
II. The uGMRT-MeerKAT view of filaments in the brightest cluster galaxies and tailed radio galaxies in the A3528 cluster complex
1
Hamburger Sternwarte, Universität Hamburg, Gojenbergsweg 112, 21029 Hamburg, Germany
2
INAF-Istituto di Radioastronomia, via Gobetti 101, I-40129 Bologna, Italy
3
Department of Physics and Electronics, Rhodes University, PO Box 94 Makhanda 6140, South Africa
4
Naval Research Laboratory, 4555 Overlook Avenue SW, Code 7213, Washington, DC 20375, USA
5
MaxPlanck Institute for Extraterrestrial Physics, Giessenbachstrasse 1, 85748 Garching, Germany
6
INAF-Osservatorio Astronomico di Capodimonte, salita Moiariello 16, I-80131 Napoli, Italy
7
Dipartimento di Fisica e Astronomia, Università di Bologna, via Gobetti 93/2, 40129 Bologna, Italy
8
South African Radio Astronomy Observatory, 2 Fir Street, Black River Park, Observatory Cape Town 7925, South Africa
⋆ Corresponding author; gabriella.digennaro@inaf.it
Received:
11
June
2024
Accepted:
26
August
2024
Superclusters represent the largest-scale environments where a number of galaxy clusters interact with each other through minor and major mergers and grow via accretion along cosmic filaments. We focus on the A3528 cluster complex in the core of the Shapley Supercluster (z ∼ 0.05). This chain includes three clusters: A3528 (which is itself composed of two sub-clusters, namely A3528N and A3528S), and A3532 and A3530, which present a mildly active dynamical state.
Key words: radiation mechanisms: non-thermal / galaxies: clusters: general / galaxies: clusters: intracluster medium / galaxies: clusters: individual: A3528 / galaxies: clusters: individual: A3532
© The Authors 2025
 Open Access article, published by EDP Sciences, under the terms of the Creative Commons Attribution License (https://creativecommons.org/licenses/by/4.0), which permits unrestricted use, distribution, and reproduction in any medium, provided the original work is properly cited.
This article is published in open access under the Subscribe to Open model. Subscribe to A&A to support open access publication.
1. Introduction
Galaxy clusters form during the last stages of the evolutionary ladder, by accretion of gas from the cosmic web and/or by collision with other clusters or galaxy groups (Press & Schechter 1974; Springel et al. 2006). Overdense regions such as superclusters (e.g. Liu et al. 2024) represent unique places to study systems at different evolutionary stages, from groups of galaxies, fairly massive clusters with ongoing accretion activity, and smaller systems located in filaments in the regions between the main clusters. All this makes such environments the perfect test bed where we can investigate the effects of mildly interacting clusters on the cluster galaxy population.
Although most energy is released during major mergers (i.e. those involving at least two massive clusters), which can then result in megaparsec-scale diffuse radio emission such as giant radio halos and radio relics (Brunetti & Jones 2014; van Weeren et al. 2019), the most common interactions between large-scale structures involve groups, where less energy is involved (Cassano et al. 2011), or collisions with a large impact parameter, often causing gas sloshing in the central core (Markevitch & Vikhlinin 2007; ZuHone et al. 2015). These events are usually referred to as minor mergers. Major and minor mergers are thought to play an important role in shaping the morphology of cluster radio galaxies. Compared to field radio galaxies, cluster radio galaxies can display asymmetric structures, caused by the bending of the jets by ram pressure. These are then classified as head tail (HT), narrow-angle tail (NAT), or wide-angle tail (WAT) based on the opening angle between the two jets (Miley 1980; O’Dea & Owen 1985). The direction and the opening angle of the tails can be used to retrieve information on the cluster dynamics and local density, although projection effects can play an important role and are often not easy to assess. Normally, the radio emission of the radio galaxy lobes fades away on a timescale of a few tens of millions of years as the plasma loses energy due to synchrotron and inverse Compton (IC) emission (Jaffe & Perola 1973). The rate of energy loss mostly depends on the magnetic field (B) and on the energy of the relativistic particles (E ∝ γL, with γL the Lorentz factor). This results in steep spectra (α ≲ −1, being Sν ∝ να), and sometimes these sources become undetectable at ∼GHz frequencies. This can change if relativistic electrons are re-supplied by the active galactic nucleus (AGN) or if the relativistic electrons are re-energised by shocks, turbulence, or adiabatic compression (e.g. Enßlin & Gopal-Krishna 2002; Enßlin & Brüggen 2002; Markevitch & Vikhlinin 2007). In these cases, some boost in surface brightness and flattening of spectral index is expected (e.g. de Gasperin et al. 2017; van Weeren et al. 2021).
As the relativistic electrons are ejected from the inner AGN, either in single or multiple activity events, bubbles of plasma can rise and be displaced in the intracluster medium (ICM; e.g. ZuHone et al. 2013, 2021; Vazza et al. 2021). Recent observations by Brienza et al. (2021) have shown that radio bubbles of past AGN activity can be ejected in the ICM up to the virial radius, therefore providing relativistic electron seeds for the formation of the large-scale diffuse emission. Additionally, sources of steep-spectrum fossil plasma on scales of a few tens of kiloparsec (i.e. radio phoenices with α ≲ −2; see Mandal et al. 2020) are also thought to be related to past AGN radio activity (e.g. Slee et al. 2001). Finally, filaments of diffuse radio emissions in the surroundings of radio galaxies are also visible (Giacintucci et al. 2022; Rudnick et al. 2022). These radio sources are usually extremely collimated and show signs of polarisation, which indicates coherent magnetic field structure (e.g. Condon et al. 2021).
Minor mergers are also thought to be able to re-accelerate particles on scales of hundreds of kiloparsec (Brunetti & Jones 2014). Several observational studies have shown that clusters in this dynamical stage host diffuse radio emission in the form of mini radio halos (e.g. Gitti et al. 2007; Savini et al. 2019; van Weeren et al. 2019, and references therein). These halos have sizes between 50 kpc and 0.2R500 (Giacintucci et al. 2017), where R500 is the radius within which the cluster mean total density is 500 times the critical density of the universe. Mini radio halos are characterised by steep spectra (i.e. α ≲ −1). Although not directly associated with the emission of the inner brightest cluster galaxies (BCGs; see Richard-Laferrière et al. 2020), it is thought that they could contribute to the powering of mini halos, either by providing seed cosmic-ray electrons (CRe) that are re-accelerated by turbulence in the wake of sloshing (Mazzotta & Giacintucci 2008; ZuHone et al. 2015) or by providing cosmic-ray protons (CRp), which then hadronically collide with ICM protons (Pfrommer & Enßlin 2004).
In this context, the new generation of radio telescopes, such as the LOw Frequency ARray (LOFAR; van Haarlem et al. 2013), the upgraded Giant Metrewave RadioTelescope (uGMRT; Gupta et al. 2017), Australia SKA Pathfinder (ASKAP; Hotan et al. 2021), and MeerKAT (Jonas & MeerKAT Team 2016), have been crucial in revealing an increasing number of clusters hosting these sources with low surface brightness radio emission, thanks to their impressive high sensitivity and high resolution. It has become clear that a hidden population of (mildly and highly) relativistic electrons exists in the ICM.
2. The Shapley Concentration Core and the A3528 cluster complex
The Shapley Supercluster (Shapley 1930) hosts a variety of systems that are in the early stages of their assembly or are already merged systems. It is identified as the richest and most massive system in the eRASS1 supercluster catalogue (Liu et al. 2024), with an estimated total mass of 2.6 ± 0.5 × 10¹⁶ M⊙ and 45 member clusters. In particular, the inner part of the supercluster (i.e. the Shapley Concentration Core) is dominated by two main chains of Abell clusters: one at its centre, namely the A3558 complex, which includes two additional clusters (A3556 and A3562) and two galaxy groups (SC1327-312 and SC1329-313), and one to the north-west of the centre, namely the A3828 complex, which includes the A3530 and A3532 clusters. They have a similar projected linear size of about 7.5 Mpc to the east–west and in the north–south (Jones et al. 2009) at the mean redshift of 0.048 and 0.054, respectively (Bardelli et al. 1998, 2001).
The multi-wavelength observations (from X-ray to radio) over the past decades have revealed the dynamically disturbed nature of the A3558 complex (and especially the region between A3558 and A3562; see Markevitch & Vikhlinin 1997; Bardelli et al. 1998; Ettori et al. 2000; Venturi et al. 2000, 2003; Finoguenov et al. 2004; Giacintucci et al. 2004, 2005; Rossetti et al. 2007; Ghizzardi et al. 2010; Merluzzi et al. 2015; Venturi et al. 2017; Haines et al. 2018; Higuchi et al. 2020; Giacintucci et al. 2022) with the recent detection of a diffuse radio bridge between A3562 and SC1329-313 and other pieces of diffuse emission (Venturi et al. 2022). Instead, the individual clusters in the A3528 cluster complex are in an overall relaxed state (Bardelli et al. 2001). XMM-Newton X-ray observations of A3528 show the presence of two sub-cores, namely A3528N and A3528S (Gastaldello et al. 2003), both characterised by temperature and abundance profiles typical of cool-core clusters. Between these two sub-cores, Gastaldello et al. (2003) also detected a bridge of thermal emission that, together with the asymmetric thermal distribution of the two sub-clusters, pointed to an off-axis post-merger scenario in A3528, where the closest core encounter happened about 1–2 Gyrs ago. On the other side, Chandra observations revealed the non cool-core nature, and the possible presence of cavities in the distribution of the thermal gas (Lakhchaura et al. 2013) of A3532 which is thought to be in the pre-merger phase with A3530. Finally, no diffuse radio emission on cluster scales (e.g. radio halos and radio relics) was found in previous radio observations (Venturi et al. 2001; Di Gennaro et al. 2018).
In the A3528 cluster complex the radio galaxy population appears to be substantially different from A3558. In particular, the BCGs in the former chain is dynamically younger, more powerful than the latter, and with possible hints of re-started activity (i.e. the BCGs in A3528S and A3532, see Di Gennaro et al. 2018). Finally, the presence of several tailed radio galaxies in the two sub-cores in A3528, despite their cool cores, suggests some form of interaction between A3528 N and A3528 S (Di Gennaro et al. 2018).
All these pieces of evidence point to a more complex dynamical state of the A3528 cluster complex that needs to be better explored. The ultra-relativistic electrons associated with the radio galaxies (both tails and BCGs) possibly interact with the surrounding environment through sloshing and feedback. In this paper we focus on the total intensity emission of the three radio-loud clusters of the A3528 cluster complex, namely A3528 N, A3528 S, and A3532 (Table 1), to shed light on such interactions, on the duty cycle of the BCGs, and on the dynamics within A3528. We combined radio observations with uGMRT Band 3 (250–500 MHz), Band 4 (550–900 MHz), Band 5 (1000–1460 MHz), and MeerKAT L-band (900–1670 MHz). Moreover, we compared the radio footprint of the three clusters with the thermal ICM emission taken from the eROSITA Western All-Sky Survey (eRASS; Bulbul et al. 2024; Merloni et al. 2024; Kluge et al. 2024, Sanders et al. in prep.).
Cluster information.
The paper is organised as follows. In Sect. 3 we describe our observations and the radio data calibration. In Sects. 4 and 5 we describe and discuss the results of our analysis. We conclude with a summary in Sect. 6. Throughout the paper we assume a standard ΛCDM cosmology, with H0 = 70 km s−1 Mpc−1, Ωm = 0.3, and ΩΛ = 0.7. This translates to a luminosity distance of DL = 240.8 Mpc, and a scale of 1.051 kpc/″at the mean redshift of the cluster complex (i.e. z = 0.054).
3. Observations and data reduction
In this section we describe the radio (Table 2) and the eROSITA X-ray observations and data reduction strategy for the A3528 cluster complex.
Radio observation details.
3.1. Radio data
The radio observations cover a frequency range between 250 and 1670 MHz and were analysed separately.
3.1.1. uGMRT
The A3528 cluster complex was observed with the upgraded Giant Metrewave Radio Telescope (uGMRT) in Band 3 (250–500 MHz; project 32_024, PI: T. Venturi), Band 4 (550–900 MHz; project 43_012, PI: G. Di Gennaro), and Band 5 (1000–1460 MHz; project 32_024, PI: T. Venturi). In each band the single cluster was observed for a total of 8 hours, including the time on the calibrators. For observations in Band 3, given the large field of view, only one pointing was chosen to cover A3528 ( ). For observations in Band 4 and 5, the pointing centres were the same as the cluster coordinates listed in Table 1. The data were recorded in 2048 frequency channels (Band 4) and 4096 frequency channels (Bands 3 and 5), with an integration time of 5.3 seconds (Band 4) and 4 seconds (Bands 3 and 5) in full Stokes mode. For all the observations, we used 3C286 as the primary calibrator.
Radio imaging details.
We processed the data in a similar way for the three targets. First, we ran the Source Peeling and Atmospheric Modeling (SPAM;1 Intema et al. 2009) pipeline on the narrow-band (i.e. gsb) data. These provide the models for the wide-band (i.e. gwb) phase calibration. For the Band 4 observation of A3532, we also included the sky model from Band 3 in the gsb data, as there were not sufficient peeled sources to perform the direction-dependent calibration and modelling of ionospheric effects.2 For the same reason, and due to the small field of view (i.e. 23′), the same Band 3 model was applied to all the targets, also to those in Band 5, together with the option allow_selfcal_skip=True. The latter allows the calibration to be continued in SPAM in case there are too few peeling sources. It does not affect our final calibration as the effect of the ionosphere is negligible at these high frequencies. The wide-band data were then split into four to six sub-bands, which were then processed separately.
Finally, for each target the sub-bands were imaged together at the same central frequency with WSClean v3.4
(Offringa et al. 2014), using Briggs (Briggs 1995) weighting and robust=−0.5 (Bands 3 and 4) and robust=0 (Band 5), and multiscale deconvolution with scales of [1, 4, 8, 16]×pixelscale, where pixelscale is the size of the pixel in arcseconds (i.e. 2″, 1″, and 0.5″, for Band 3, 4, and 5, respectively). Additionally, we created the highest resolution Band 4 images using robust=−2. For Bands 3 and 4 we produced images at different resolutions, tapering the uv plane at 10″, 15″, and 30″, with the same multiscale deconvolution setting (and pixelscale of 2″). To emphasise the possible presence of diffuse emission, we removed the contribution of compact sources: first we created a clean model only including compact sources, by excluding from the visibilities all the emission with linear sizes ≥100 kpc at the clusters redshift (i.e. ∼2000λ); then we subtracted this model and re-imaged the data at the same resolution as mentioned above. For all the images, the final reference frequencies are 410 MHz for Band 3, 700 (650) MHz for Band 4 (A3528 N), and 1260 MHz for Band 5 (see Table 2). All the images were corrected for the primary beam attenuation (i.e. using EveryBeam in WSClean; Offringa et al. 2014), which were used for the flux density estimation. The systematic uncertainties due to residual amplitude errors are set to 8% for the observations in Band 3 and 5% for the observations in Bands 4 and 5 (Chandra et al. 2004).
3.1.2. MeerKAT L-band
MeerKAT observations of the A3528 cluster complex were performed in L-band (900–1670 MHz) on 15 July 2019 for a total of 8 hours, including the calibrators (e.g. J1311-222 as phase calibrator, and PKS1934-63 and PKS0408-65 as flux and bandpass calibrators). The data were recorded in 4096 frequency channels, with a width of ∼210 kHz each. The three clusters in the A3528 cluster complex were imaged in the same observation, with the pointing centre on A3528S at  .
.
For each target the standard data reduction was performed using the Containerized Automated Radio Astronomy Calibration (CARACal) pipeline3 (Józsa et al. 2020a,b), which includes different flagging steps (e.g. tricolour, see Hugo et al. 2022, for radio frequency interferences, and auto-correlations, shadowed antennas, and channels/spw in CASA) and delay, bandpass, and gain calibrations on PKS1934-63. The solutions were then transferred to the target, channel-averaged by a factor of four, and followed by a second round of flagging. Several rounds of phase and amplitude+phase self-calibrations were done by means of WSClean, using Briggs (Briggs 1995) weighting and robust=0, join-channel deconvolution and fourth-order polynomial fitting options, and using the CubiCal package (Kenyon et al. 2018).
In the same way as the uGMRT observations, the final images were done with WSClean v3.4 (Offringa et al. 2014), using Briggs (Briggs 1995) weighting and robust=−0.5 and multiscale deconvolution with scales of [1, 4, 8, 16]×pixelscale, where the pixel scale equal to 1″. Similarly to the uGMRT imaging, low-resolution images at 10″, 15″, and 30″ were produced, as well as those without compact sources to emphasise the diffuse emission. Primary beam correction was also applied, and those corrected images were used for the flux density estimation. The final uncertainty was set to 5% (Knowles et al. 2022).
3.2. eROSITA
The Shapley Supercluster region (and therefore the A3528 cluster complex) was scanned by the Spectrum Roentgen Gamma (SRG)/eROSITA X-ray telescope (Predehl et al. 2021), over the five cycles of the All-Sky Survey (eRASS:5), between December 2019 and February 2022. The data were processed with the eROSITA Science Analysis Software System (eSASS, Brunner et al. 2022) pipeline version 020, which has improved boresight correction, detector noise suppression, and subpixel position computation over version c010 (which was used for the first All-Sky Survey release; Merloni et al. 2024). The data from telescope modules (TMs) 1, 2, 3, 4, 5, 6, and 7 (Predehl et al. 2021) are co-added to generate the images of the two clusters. The images were created using the eSASS tool evtool, from event files, which were corrected for good time intervals, dead times, and bad pixels.
The final images were created in the 0.2–2.3 keV energy band. Moreover, to emphasise the dynamics of the three clusters, we also produced Gaussian gradient magnitude (GGM) filtered images (Sanders et al. 2016) with σ = 10 pixels.
4. Results
When compared with the previously published observations (i.e. Venturi et al. 2001; Di Gennaro et al. 2018), the new high-fidelity uGMRT and MeerKAT images (Figs. 1 and 2, and Table 3) reveal a plethora of new diffuse radio sources and new details of the radio galaxies in the three clusters of the A3528 cluster complex. Here we describe the radio emission for each cluster and the comparison with the X-ray thermal emission. Finally, we also measure the integrated flux densities of the radio sources.
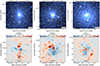 |
Fig. 1. Full-resolution images of the central region of A3528N (top row), A3528S (centre row), and A3532 (bottom row). From left to right: uGMRT Band 3 (410 MHz), uGMRT Band 4 (650/700 MHz), and MeerKAT (1284 MHz). Radio contours are displayed at 3σrms, ν × [ − 1, 1, 2, 4, 8, 16, 32] levels (when present, negative contours are shown as dashed lines), where σrms, ν is the map noise at the different frequencies (see Table 3). The radio sources and features are labelled in the right panel. The beams are displayed in the bottom left corner of each panel (see Table 3). The white cross (×) shows the location of the X-ray peak. |
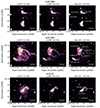 |
Fig. 2. High-resolution images of the cluster radio sources. Top left: J1254-2900 and J1254-2901a (A3528N); Top right: J1254-2901b (A3528N); Centre left: J1254-2904 (A3528N); Centre right: J1254-2913 (A3528S); Bottom left: J1254-2916 (A3528S); Bottom right: J1257-3021 (A3532). For each radio galaxy, the uGMRT Band 4 (robust=−2; left) and the uGMRT Band 5 (robust=0; right) are displayed. The beam is displayed in the bottom left corner of each panel (see Table 3). |
4.1. Radio morphology
4.1.1. A3528N
The BCG in A3528N, namely J1254-2900, does not show any additional diffuse radio emission at full or low resolution (top panels in Fig. 1 and Fig. A.1, respectively). At the uGMRT Band 5 high resolution (Θ1260 = 2.9″ × 2.2″; see top left panels in Fig. 2), J1254-2900 presents the same ‘S’ shape that was detected at 8.4 GHz (Di Gennaro et al. 2018). This source is also totally embedded in the inner core of the ICM, where the gas density is higher (left panel in Fig. 4).
South of the BCG, we find two tailed radio galaxies: the head tail (HT) J1254-2901a and the narrow-angle tail (NAT) J1254-2904 (see top panels in Fig. 1). The head and the core of J1254-2901a remain unresolved even at the uGMRT Band 5 high resolutions (top left panel in Fig. 2). The length of the tail reaches ∼130 kpc in the 410 MHz low-resolution image. On the other hand, J1254-2904 shows an asymmetric length of the two jets, with the western one ending in a sharp barred lobe that extends in the north-east–south-west direction for ∼80 kpc. At the highest resolution (see centre left panel in Fig. 2), we distinguish the two unresolved jets that expand first into two small bubbles and then turn into a plume (eastern jet) and the barred lobe (western jet). Not accounting for projection, we measure a length of ∼45 kpc and ∼95 kpc for the eastern and western (including the sharp lobe) jet, respectively. Interestingly, the barred lobe of J1254-2094 does not coincide with any particular thermal discontinuity, even in the GGM-filtered X-ray contours (left panel in Fig. 4). Finally, Di Gennaro et al. (2018) found an additional WAT radio galaxy, J1254-2901b, east of the cluster centre, at the edge of the sloshed core (left panel in Fig. 4). For the first time at low frequencies, we clearly detect the C-shaped tail that was only visible at 8.4 GHz, with the southern jet turning into a twirled lobe (see top right panel in Fig. 2).
4.1.2. A3528S
The most remarkable diffuse radio source in the A3528 cluster complex is associated with the wide-angle tail (WAT) BCG in A3528S: J1254-2913 (centre panels in Figs. 1 and A.2). We confirm the detection of two mushroom-shaped radio sources, north-east and south-east of the radio galaxy, which were previously marginally detected only at the lowest frequency (i.e. 235 MHz, Di Gennaro et al. 2018). The new detailed radio images reveal the mushroom-shaped sources at all three frequencies (i.e. up to 1.28 GHz), and also their filamentary structure (Fig. 3). This emission resembles, on smaller scales, that detected in the Virgo cluster (Owen et al. 2000). Moreover, we detect two thin radio filaments pointing towards the south-west (see centre panels in Fig. 1). The northern filament extends further west than the southern filament, breaking into a ‘V’ shape which is mostly visible at 410 MHz (e.g. uGMRT Band 3) for a total length of ∼390 kpc. On the other hand, the southern filament seems to start directly from the core of the WAT, bending 90° in the south-east direction (the ‘bay’; see centre right panel Fig. 1), and then turning westward again for ∼200 kpc. Between the two radio filaments, additional diffuse radio emission is present at low resolutions (see Fig. A.2). The high-resolution high-frequency image (i.e. uGMRT Band 5; see centre right panels in Fig. 2) of the BCG reveals a more complex morphology than the lower-frequency observations: two unresolved jets are ejected from the north and south of the inner core; the southern jet shows an ‘S’ shape towards the west (see dashed line in the centre right panels in Fig. 2), where both turn into a lobe.
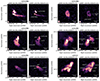 |
Fig. 3. Unsharped Gaussian Gradient Magnitude (GGM; Sanders et al. 2016) filtered images with σ = 2 pixels of the central region of A3528S. From left to right: uGMRT Band 3 (410 MHz), uGMRT Band 4 (700 MHz) and MeerKAT L-band (1284 MHz), at full resolution (see Table 3). On the top right corner of each panel, a zoom-in on the WAT, at the same resolution and frequency. |
South of the complex, diffuse radio emission of J1254-2913, we find the NAT radio galaxy J1254-2916. The extent of the tail is substantially longer than was found in previous observations (∼80 kpc; Di Gennaro et al. 2018), at all frequencies. In particular, we clearly see the tail changing direction from south-west to west, ∼80 kpc from the core. It then bifurcates at a distance of ∼160 kpc from the core and reaches the terminal point of the southern filament in J1254-2913, for a total projected length of ∼280 kpc. At the high resolution of the uGMRT Band 5 observations (bottom left panels in Fig. 2), it appears that this long tail is connected only to the northern jet of J1254-2916.
4.1.3. A3532
Similarly to the BCG in A3528S, that in A3532 (i.e. J1257-3021) shows a filament in the north at all frequencies. At ∼80 kpc from its start, the filament bifurcates and generates two additional filaments, the western BCG becomes comma-shaped (bottom panels in Fig. 1). Interestingly, the 410 MHz full-resolution image reveals an additional piece of diffuse emission south of the BCG with no clear optical counterpart. This becomes more visible in the low-resolution images, also at higher frequencies, where the two sources connect at the 3σrms level (Fig. A.3). If associated with J1257-3021, this kind of emission could be caused by an earlier episode of activity of the BCG. Moreover, hints of the presence of diffuse radio emission around the BCG (e.g. mini radio halo) are visible at 410 MHz (at both full and low resolutions), although there is no clear detection at higher frequencies.
The uGMRT Band 5 image (bottom right panels in Fig. 2) shows impressive details of the BCG. Two jets are ejected in the north-west–south-east direction, turning into two plumes that get distorted and dragged towards the east. This suggests a motion of the radio galaxies in the ICM towards the west, in the direction of the radio-quiet member of the A3528 cluster complex (i.e. A3530), as also suggested in Di Gennaro et al. (2018).
4.2. Morphology of the ICM
We used the data from the first eROSITA Western All-Sky Survey (eRASS1; Bulbul et al. 2024; Merloni et al. 2024; Kluge et al. 2024, Sanders et al. in prep.) to estimate the dynamical state of the three clusters in the A3528 cluster complex. From this catalogue, we obtained the concentration parameter (c), the centroid shift (w), and the power ratio (P3/P0), which indicate how strong the X-ray peak is compared with the rest of the cluster surface brightness, how much the X-ray peak is shifted from the cluster centroid, and how many X-ray peaks are present in the cluster, respectively. These parameters are commonly used in the literature to investigate the dynamical state of a cluster (e.g. Santos et al. 2008; Lovisari et al. 2017; Andrade-Santos et al. 2017; Rossetti et al. 2017). Relaxed clusters are usually found in the parameter space bound by c > 0.2, w < 0.012, and P3/P0 < 1.2 × 10⁻⁷ (e.g. Cassano et al. 2010, 2013; Cuciti et al. 2021). We find c = 0.31, w = 0.006, and P3/P0 = 1.2 × 10⁻⁷ for A3528N; c = 0.34, w = 0.004, and P3/P0 = 3.7 × 10⁻⁷ for A3528S; and c = 0.75, w = 0.05, and P3/P0 = 2.7 × 10⁻⁷ for A3532. These values indicate a complex morphology of the clusters, with A3528N and A3528S being in line with undisturbed systems according to the c-w plot, but not with the c-P3/P0 and w-P3/P0 plots. On the other hand, A3532 is compatible with the disturbed morphological classification according to the c-w and c-P3/P0 plots, but not with the w-P3/P0 plot. These results point to a more complex dynamical state than previously studied.
We therefore produced the residual images of the three clusters, after subtracting an isothermal β-model (see Appendix B) which usually describes a relaxed system (Cavaliere & Fusco-Femiano 1976). A3528N appears to have positive residuals along the north–south direction (bottom left panel in Fig. 4), which reflects the elongated morphology also highlighted by the GGM contours (top left panel in Fig. 4). A3528S presents the typical traits of a sloshing core, with a spiral shape of negative and positive residuals (bottom centre panel in Fig. 4), as also suggested by previous studies (Gastaldello et al. 2003). The extended radio emission associated with the BCG J1254-2913 lies in the region of negative residual region, with the northern filament of J1254-2913 and the long tail in J1254-2916 partially following the northern and southern edges of the region, respectively. Similarly, the two filaments in A3532 fill the two regions of negative residuals (bottom right panel in Fig. 4), with the comma-shaped radio feature that is probably produced by hitting the excess of surface brightness of the ICM.
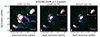 |
Fig. 4. Radio/X-ray/optical comparison. Top panels: Optical (VLT Survey Telescope gri; Merluzzi et al. 2015) and X-ray (0.2–2.3 keV eROSITA All-Sky Survey (eRASS), blue; Bulbul et al. 2024; Kluge et al. 2024, Sanders et. al. in prep.) composite images of A3528N (left), A3528S (centre), and A3532 (right) with uGMRT Band 3 radio contours (white) drawn at 4σrms × [2, 4, 8, 16, 36, 128, 256]. To emphasise the X-ray features, we also overplot the contours of the unsharped Gaussian gradient magnitude filtered image (Sanders et al. 2016) at [3,6,20] × 10−6 photons cm−2 s−1 levels (light blue). Bottom panels: Residual X-ray images after subtracting a standard β-model (Cavaliere & Fusco-Femiano 1976). The radio contours are from the uGMRT Band 3 taper=10″ image (beam in the bottom left corners), at the 4σrms × [1, 2, 4, 8, 16, 36, 128, 256] levels. |
Finally, we also give the eRASS1 masses (M500), average temperature (T500), and bolometric luminosities (L500) at R500 (Bulbul et al. 2024):  , T500 < 4.9 keV, and
  for A3528N (with R500 = 1.0 Mpc);
  ,
,  keV, and
  for A3528S (with R500 = 1.1 Mpc); and
  ,
,  keV and
  for A3532 (with R500 = 1.1 Mpc). These values are slightly above those reported from the literature (e.g. Piffaretti et al. 2011; Gastaldello et al. 2003), as also reported by Liu et al. (2023) and Migkas et al. (2024).
4.3. Integrated flux densities and spectra
In order to study the radio spectral properties of all the radio galaxies and radio features in the A3528 cluster complex, we measured the total flux densities at 410 MHz (uGMRT Band 3), 650/700 MHz (uGMRT Band 4), and 1284 MHz (MeerKAT L-band). To this end, we used images corrected for the primary beam, at the common intermediate resolution of Θ ∼ 12″ (i.e. taper=10″). This resolution was chosen as it provides a good compromise between separating the individual sources (i.e. J1254-2900 and J1254-2901a) and recovering the largest extension of the diffuse radio emission (i.e. the radio filaments in A3528S and A3532, and the long tail in J1254-2916). We also applied an inner uv-cut at 200λ, which represents the shortest baseline of the uGMRT Band 4 observations (see Table 2), to assure the recovery of flux density on the same maximum spatial scales. Regions of flux density measurements were chosen starting from the lowest frequency observation (see bottom panels in Fig. 5), and then kept constant for all the observing frequencies. Uncertainties of the flux density measurements are given by
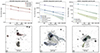 |
Fig. 5. Integrated spectra of the radio sources in the A3528 cluster complex. Top row: Flux densities were measured after convolving all the frequencies at the same resolution. Different dashed lines in each panel are colour-coded based on the region where the flux density was extracted (see bottom panels), and describe the fitted α (see Column 6 in Table 4). Bottom row: uGMRT Band 3 images of the three clusters (from left to right: A3528N, A3528S and A3532) at ∼12″ (see beam in the bottom-left corner of each panel). Radio contours start at the 3σrms level, which was used as reference for drawing the regions. |
where f describes the systematic uncertainties of the observation (i.e. 8% for the uGMRT Band 3 observations and 5% for the uGMRT Band 4 and MeerKAT L-band observations), Nbeam the number of beams covering the selected region, and σν, rms the noise level at each observation. The resulting flux density measurements and their errors are listed in Table 4. We then fit our measurements of the radio spectrum with a first-order polynomial in logarithmic space (i.e. log Sν = β + α log ν, with β the flux normalisation parameter) in order to obtain the integrated spectrum (α) of each source.
Integrated radio fluxes and radio power at 1.28 GHz.
The integrated spectra for the radio galaxies in the three clusters (reds, A3528N; blues, A3528S; greens, A3532) are shown in Fig. 5, top panel, where we display BCGs with squares, radio tails with circles, filaments with up- and down-pointing triangles, and ‘mushrooms’ with thin and large diamonds, all colour-coded based on the host cluster. All these regions are well described by a power-law spectrum. The three BCGs show standard spectral indices, with α = −0.77 ± 0.07, α = −1.09 ± 0.07, and α = −0.75 ± 0.07, for J1254-2900, J1254-2913, and J1257-3021, respectively. The slightly steeper spectrum for J1254-2913 is probably due to the fact that we integrated over the lobes of the WAT (see darkest blue region in the bottom panel in Fig. 5). The emission of this source gets steeper in the two mushroom-shaped sources (respectively α = −1.96 ± 0.13 and α = −2.23 ± 0.15 for the north-east and the south-east). Interestingly, the two filaments in A3528S have even steeper spectra: α = −2.34 ± 0.33 and α = −1.93 ± 0.36 for the northern and southern filament. Similarly, the northern filament in A3532 has a spectral index of α = −2.38 ± 0.20, while the candidate filament in the south of the BCG has a spectral index of α = −2.49 ± 0.71 (see Table 4).
We also determined the radio power at 1.28 GHz, using the integrated spectral index listed in Table 4,
![$$ \begin{aligned} P_{1284} = \frac{4\pi D_L^2}{(1+z)^{\alpha +1}}\, S_{1284} \quad [\mathrm{W\,Hz^{-1}}] , \end{aligned} $$](/articles/aa/full_html/2025/02/aa51066-24/aa51066-24-eq13.gif)
where DL is the luminosity distance of the cluster. Uncertainties on the radio power take into account both the uncertainties on the flux density and on the spectral index measurement, and they were obtained through Monte Carlo simulations.
5. Discussion
In recent years, extended radio emission associated with cluster galaxies have been found, either long radio tails associated with the AGN or filaments and bubbles in the AGN proximity. However, it is still not clear how they form, what their magnetic field properties are, and how the CRe can get re-accelerated. In the following sections we investigate the spectral properties of the diffuse emission associated with the radio galaxies in the A3528 cluster complex.
5.1. Spectral index maps
We obtained spectral index maps using the primary beam corrected images, with a common uv-cut of 200λ (e.g. the uGMRT Band 4 observation; see Table 2), pixel scale, and angular resolution. Before any convolution and regridding, we also checked our images for the astrometry precision, using the FIRST survey as reference (de Gasperin et al. 2023). For each cluster, the first-order polynomial in logarithm space (i.e. log S = β + α log ν, with β the flux normalisation parameter) was fit in those pixels where all images have a signal above the 3σrms threshold. Uncertainties on the fit were obtained as the standard deviation of 150 Monte Carlo simulations, assuming the flux uncertainty as the sum in quadrature of the noise map and the systematic flux uncertainties:  .
.
Spectral index maps of the inner part of the three clusters in the A3528 cluster complex at full and low resolutions (i.e. ∼7″ and ∼18″ respectively) are shown in the top and bottom panels in Fig. 6. The corresponding uncertainties maps are given in Fig. C.1. Additionally, we used the uGMRT Band 4 with robust=−2.0 and Band 5 images to produce the highest resolution (∼4″) spectral index maps of the radio galaxies (see Fig. 7, and C.2 for the corresponding error maps).
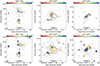 |
Fig. 6. Spectral index maps of the inner region of the three clusters in the A3528 cluster complex. From left to right: A3528N, A3528S, and A3532. Top rows: High resolution (Θ ∼ 7″); bottom rows: Low resolution (Θ ∼ 19″, i.e. taper=15″). The corresponding uncertainty error maps are shown in Fig. C.1 Radio contours are drawn at 3σrms × [1, 2, 4, 8, 16, 32] of the uGMRT Band 4 observations at the same resolution (not primary beam corrected; see Table 3 for the noise level). |
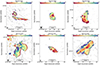 |
Fig. 7. Spectral index maps between uGMRT Band 4 (robust=−2.0) and Band 5 (robust=0.0) of the radio galaxies in the three clusters in the A3528 cluster complex, namely J1254-2900 and J1254-2901a (top left panel), J1254-2901b (top centre panel), J1254-2904 (top right panel), J1254-2913 (bottom left panel), J1254-2916 (bottom centre panel), and J1257-3021 (bottom right panel). The resolutions of the maps are 4.5″ (A3528N), 3.9″ (A3528S), and 3.7″ (A3532). The corresponding uncertainty error maps are shown in Fig. C.2. The radio contours are drawn at 3σrms × [1, 2, 4, 8, 16, 32, …] of the uGMRT Band 5 observations at the same resolution (not primary beam corrected; see Table 3 for the noise level). |
In A3528N the spectral index distribution of the BCG (J1254-2900) is well resolved only at the highest frequency using uGMRT Band 4 and Band 5 observations (upper left panel in Fig. 7). At the location of the core, we measure a spectral index α ∼ −0.7, which then steepens (α ∼ −1.0) in the two S-shaped lobes. The two radio tails (J1254-2901a and J1254-2904) show standard spectral index values and gradients at all resolutions (Fig. 6, and top left and right panels in Fig. 7), with the starting point of the head–narrow-angle tail being α ∼ −0.4 and then steepening along the tail up to α ∼ −1.2. On the contrary, J1254-2901b has an overall homogeneous flat spectrum (i.e. α ∼ −0.7; see top centre panel in Fig. 7) along the C-shaped tails.
For the BCG WAT in A3528S (J1254-2913), we can clearly distinguish an inner core with flat spectral index (α ∼ −0.7) from the two lobes with steeper spectra (α ∼ −1.5), see centre column in Fig. 6. The 4″ resolution spectral index map (Fig. 7) reveals interesting substructures in the SE and NW lobes of the wide angle tail, with the SW jet being flatter than the NW jet (i.e. αjet, SW ∼ −0.7 and αjet, NW ∼ −1.7). The diffuse radio emission associated with this radio galaxy is only visible at intermediate and low resolutions. The two mushroom-shaped sources north-east and south-east of the WAT present rather homogeneous spectral index distribution of ∼ − 2 (see centre column in Fig. 6), with hints of steepening in the SSE (α ∼ −2.5). Different behaviour is seen for the two filaments: while the northern one is rather constant at values of ∼ − 2.5, the southern one seems to be characterised by a gradient, from ∼ − 1.5 around the bay to values of ∼ − 2. A peculiar spectral index distribution is also seen in J1254-2916. The high resolution shown by the combination of the uGMRT Band 4 and Band 5 observations (bottom centre panel in Fig. 7) reveal a standard value of the core (α ∼ −0.4) and of the two jets (α ∼ −0.7) up to α ∼ −1.3 in the inner part of the radio tail. At lower resolutions, this radio tail steepens up to α ∼ −2 for about 200 kpc.
Finally, the radio jets and lobes of the BCG in A3532 (J1257-3021, right column in Fig. 6) have a standard spectra index for a radio sources (i.e. α ∼ −0.8), with increasing steepening visible at high resolution in the plumes (α ∼ −1.5; see bottom left panel in Fig. 7). The northern filament presents a gradient from −1.5 to −3 when approaching the fork and the comma. Similarly, the southern filament has steep spectra, ∼ − 2, with no clear gradients, which possibly exclude the association with a radio galaxy.
5.2. Spectral index profiles
To investigate the spectral properties of the radio emission associated with the radio galaxies in the A3528 cluster complex, we extracted the flux densities and spectral index profiles along the radio tails (e.g. J1254-2901a, J1254-2904 and J1254-2916) and from the north and south filaments in J1254-2913 and J1257-3021. These profiles were obtained from the uGMRT Band 3, uGMRT Band 4, and MeerKAT L-band observations, convolved at the same intermediate resolution of ∼12″ (i.e. taper=10″), from beam-size circles following the brightest edge of the uGMRT Band 3 radio contours (Edler et al. 2022). These regions correspond to ∼12 kpc each at the cluster redshift. The profiles are shown in Figs. 8–13, where we also show the distance travelled by the plasma, after the injection, using the conversion kpc/″ in Table 1. As for the spectral index maps and integrated spectral indices, a single power law was also assumed in each beam-size circle.
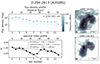 |
Fig. 8. Flux density and spectral index profiles of the WAT J1254-2913 in A3528S. 4″ resolution images of the uGMRT Band 4 (top right) and uGMRT Band 5 (bottom right) are shown to the right of the profiles. |
At the time of the injection, the relativistic plasma is described by a single power law of the type N(E)∝E−δinj, where the power-law index (δinj) is related to the injected spectral index according to δinj = 1 − 2αinj. The radiative loss time can then be estimated as
![$$ \begin{aligned} t_{\rm rad} = 1.6\times 10^3 \, \frac{B^{1/2}}{B^2 +B_{\rm CMB}^2} \, [\nu _{\rm break}(1+z)]^{-1/2} \quad [\mathrm {Myr}] , \end{aligned} $$](/articles/aa/full_html/2025/02/aa51066-24/aa51066-24-eq15.gif)
where B and z are the magnetic field and redshift of the AGN, respectively, and BCMB = 3.25(1 + z)2μGauss is the equivalent magnetic fields of the cosmic microwave background (CMB).
In order to investigate the radiative loss time of each source, we derived profiles of the spectral index. We assumed a standard Jaffe-Perola (JP; Jaffe & Perola 1973) model, which assumes a single burst of cosmic-ray injection, a radiative time that lasts much longer than the electron isotropisation, and a uniform and non-evolving magnetic field. In particular, in our modelling we use αinj from the spectral index profiles at the location of the core of each radio galaxy, and we assume the minimum condition for magnetic fields to maximise the age of the particles. The latter requirement means that we can estimate the magnetic fields as  Gauss, which corresponds to B ∼ 2.1 μGauss at the redshift of our sources. We then use the synage package (Murgia et al. 1999) to obtain the evolution of the spectral index, up to 500 Myr after the burst of particles. The theoretical time-evolution of the spectral index and the observed profile were then compared to determine the theoretical spatial evolution of α, and to estimate the source projected velocity (v⊥), which is assumed to be constant for the entire time. Using the spectral index profile for this kind of analysis is particularly useful, as we remove the contribution of the flux normalisation in the analysis (Edler et al. 2022).
5.2.1. J1254-2913
The new high-resolution uGMRT Band 4 and uGMRT Band 5 observations (see centre right panel in Fig. 2) have shown an interesting and peculiar morphology of the wide-angle tail (WAT) in J1253-2913, with two jets being ejected from the inner core and deviating towards the west, ending in the W lobe.
To understand the physical behaviour of this radio galaxy as shown in the high-resolution images (Fig. 2), we extracted the flux density and spectral index profile from 4″ circles (i.e. the common resolution of the 700 MHz and 1260 MHz observations). We traced the path along the S-shaped SW jet, from the inner region (core, Fig. 2) to the western lobe (Fig. 8). The spectral profile of the source is well described by a standard JP model with αinj = −0.9 and v⊥ = 140 km s−1, from the inner core up to the start of the SW jet (i.e. α ∼ −2, box #6-7; see solid line in Fig. 8). This velocity is typical of the WAT associated with BCGs in cluster centres (i.e. vgal ∼ 100 km s−1; O’Dea & Baum 2023). At the location where the southern jet deviates towards the west (boxes #8–10), the spectral index flattens back to α ∼ −1 for ∼10 kpc, and then steepens again when the jet turns into the lobe (up to α ∼ −2). Interestingly, this second steepening could be explained by a JP ageing model with same injected spectral index but with a higher velocity (i.e. ∼340 km s−1, see dashed line in Fig. 8), or with a shifted JP model with the same velocity as the inner core (i.e. v⊥ = 140 km s−1; see dot-dashed line in Fig. 8). This latter explanation would imply multiple events of activity of the AGN. If we consider the projected distance from the core to the location of the spectral flattening (i.e. ∼10 kpc) and the projected velocity v⊥ = 140 km s−1, we find that the time interval between the two activity events is about 70 Myr. At the location of the spectral flattening, hints of flux flattening are also present. On the other hand, the flux density profile along the SW jet appears to be rather constant up to the edge of the western lobe.
Alternatively, the S-shaped jet could be explained as a filament connecting the two lobes, as also seen in ESO 137-G006 (Koribalski et al. 2024). However, the thin threads in ESO 137-G006 have a steep spectral index (α ∼ −2.5) and no signs of flattening, as we instead measure in boxes #9–10 in J1254-2913 (α ∼ −1; Figs. 7 and 8). Considering the small opening angle of J1254-2913, and the limitation due to the projection on the plane of the sky, it is non-trivial to determine the nature of the thread or jet in this WAT.
5.2.2. Radio tails
The two radio tails in A3528N (see Fig. 9) have brightness and spectral profiles that are typical of tailed radio galaxies, with a standard spectral index at the position of the AGN (∼ − 0.45) which then steepens at the end of the tail (up to ∼ − 1.1) (i.e. after ∼120 kpc and ∼70 kpc for J1254-2901a and J1254-2904, respectively). We note the complex and asymmetric morphology of the two jets in J1254-2904, which probably outlines the combination of the cluster bulk motion and the galaxy’s orbit in the cluster potential well. For this source, the profiles were extracted following only the western longer jet, up to the barred lobe. The profiles are typical for sources that follow the expected JP ageing model. For both, we assume a distribution of electrons with αinj = −0.45 (i.e. the spectral index value at the head of the tails) and a velocity v⊥ ∼ 634 km s−1. Considering the position in the cluster (i.e. the galaxy redshifts of z = 0.0545), these velocities appear high, although they are still in line with the velocity dispersion of the cluster (i.e. ∼900 km s−1 for A3528N) (Bardelli et al. 2001). Under these assumptions, we estimate that it takes about 150 Myr and 100 Myr for the plasma to age from the head to the end of the tail in J1254-2901a and J1254-2904, respectively.
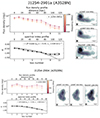 |
Fig. 9. Flux density and spectral index profiles of the radio tails in A3528N: J1254-2901a (top row) and J1254-2904 (bottom row). 12″ resolution images of the uGMRT Band 3 (top right), uGMRT Band 4 (centre right), and MeerKAT L-band (bottom right) are shown to the right of the profiles. |
The flux density and spectral index profiles for J1254-2916 in A3528S are shown in Fig. 10. For the first ∼70 kpc (i.e. just before the fork, box #7), the JP model with αinj = −0.4 and v⊥ ∼ 390 km s−1 reproduces the spectral index profile well, with values from −0.4 ± 0.1 to −1.6 ± 0.1. As in the fork (boxes #7–10) the spectrum is constant around values of −1.5 ± 0.1, and then successively steepens again up to −3.0 ± 0.4, after ∼60 kpc. From box #15 to #20 (i.e. ∼60 kpc, where the tail disappears in the uGMRT Band 4 and MeerKAT observations) we estimate an upper limit on the spectral index of α = −2.4. Interestingly, we note that the second steepening in the tail (i.e. those from box #10 to #15) could be explained by the JP ageing model with a different HT projected velocity: v⊥ ∼ 620 km s−1 (see dashed line in Fig. 10). Similarly, the third steepening (boxes #20–23) would agree with a source velocity of v⊥ ∼ 1000 km s−1 (see dot-dashed line in Fig. 10). This change in velocity, which is not included in our simple modelling, could occur during the galaxy motion in the cluster, which would decelerate after leaving the minimum point of the cluster potential well. This velocity would be more than twice the velocity dispersion of the sub-cluster (i.e. ∼454 km s−1; see Bardelli et al. 2001). Moreover, the change in velocity would not explain the inverse gradient profile of the spectral index from boxes #16 to #20 (i.e. 175–220 kpc from the head of the tail). This flattening could be explained by re-acceleration processes triggered by the turbulence generated during the sloshing event between A3528S and A3528N, as also suggested for other literature examples such as Abell 1033 (de Gasperin et al. 2017; Edler et al. 2022). In support of that, we note that the long tail of J1254-2916 lies in the proximity of the southern edge in the X-ray, which is highlighted in the Gaussian gradient magnitude (GGM; Sanders et al. 2016) image with σ = 10 pixels and in the comparison with the X-ray residual map (see centre panels in Fig. 4).
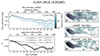 |
Fig. 10. Flux density and spectral index profiles of J1254-2916 in A3528S. 12″ resolution images of the uGMRT Band 3 (top right), uGMRT Band 4 (centre right), and MeerKAT L-band (bottom right) are shown to the right of the profiles. |
5.2.3. Mushrooms in J1254-2913
J1254-2913 is surrounded in the north-east and south-east by two mushrooms of emission. For these radio features, we extracted the flux density and spectral index profiles from rectangular boxes, with a height equal to the beam size (∼12″) and width to cover the emission up to the 3σrsm level, paying attention to avoid, in the SE mushroom, the emission associated with the southern filament (see Fig. 11).
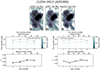 |
Fig. 11. Flux density and spectral index profiles of the two mushrooms in J1254-2913. 12″ resolution images of the uGMRT Band 3 (top left) uGMRT Band 4 (top centre) and MeerKAT L-band (top right) are shown at the top of the profiles. |
The flux density profiles appear to be constant for the full extent of the two structures (∼35 kpc and ∼50 kpc, for the NE and SE mushroom, respectively), at all observing frequencies. Interestingly, while the SE mushroom seems to have a quite constant spectral index profile (α ∼ −2.1), with a hint of a dip in box #2, for the NE mushroom we detect a flattening towards the edge of the radio emission, from α = 2.1 ± 0.1 to α = −1.8 ± 0.1. Hints of cavities, or depressions in the X-ray surface brightness distribution, are visible at the location of the two mushrooms in the X-ray residuals (bottom row in Fig. 4), with the radio emission in the NE mushroom being confined by the positive residuals due to the sloshing motion. Assuming that these radio bubbles have been ejected by the AGN in J1254-2913, we can calculate the raising time as t = H/vmushroom, where H is the position of the mushrooms with respect to the AGN (being 35 kpc and 45 kpc for the NE and SE mushrooms, respectively) and vmushroom their raising velocity. This latter parameter can be calculated using buoyancy arguments (e.g. Brienza et al. 2021):
where g = 2σ2/H (with σ the cluster velocity dispersion, being ∼454 km s−1 for A3528S; see Bardelli et al. 2001) is the gravitational acceleration assuming hydrostatic equilibrium, V = 4/3πab2, and Φ = πab the volume and the cross-section of the mushroom, assuming ellipsoidal geometry (with b = 35 kpc the minor semi-axis of the mushroom4), and C = 0.75 the drag coefficient (Churazov et al. 2001; Brienza et al. 2021). Using these parameters, we obtain vmushroom ∼ 1200 − 1100 km s−1. Here we also assume a volume filling factor of 1, which is probably an overestimation, given the filamentary structure highlighted by the GGM image (Fig. 3). Assuming a filling factor of 0.5, the velocity of the mushroom would decrease to ∼700 km s−1.
Alternatively, we can assume that the mushrooms are moving at the sound speed cs:
Here Γ = 5/3 is the adiabatic index; kBT is the ICM temperature at the location of the mushroom, which can be obtained from the X-ray observations; μ = 0.62 is the mean molecular weight; and mp = 1.67 × 10⁻²⁴ g is the proton mass. Using XMM-Newton observations, Gastaldello et al. (2003) measured a temperature of kBT = 4 − 4.5 keV at the mushroom locations, leading to vmushroom ∼ 1000 km s−1, in line with the velocity found using buoyancy arguments. With this velocity and assuming that the mushrooms are in the same plane of the sky as the cluster centre and neglecting the velocity of the radio galaxy, the raising time of the NE and SE mushroom-shaped sources is ∼30 Myr and ∼40 Myr, respectively.
5.2.4. Filaments around the BCG
For both filaments in A3528S, we extracted the flux density and spectral index profiles starting from the location of the J1243-2913 core. For the northern filament, we proceeded within the NW lobe (boxes 2 and 3 in the top panels in Fig. 12) and then proceeded for the full extent of the filament (∼350 kpc). The spectral index profile (bottom left panel in Fig. 12) is consistent with a JP model with αinj = −0.9 for these first three boxes, namely for the WAT source, assuming a projected velocity of ∼240 km s−1 (consistent with the finding shown in Sect. 5.2.1). These values translate to a radiative ageing time of trad ∼ 100 Myr for the WAT.
The filament does not follow the predicted ageing profile of a JP model, but the spectral index reaches a plateau around α ∼ −2.5 and remains constant for about 200 kpc (until the filament breaks into the ‘V’ shape; box #21). Similarly, the flux density profiles also remain approximately constant along the full extent of the filament, and well above the noise level (see Table 3). At the location of the V-shaped break, we measure a mild steepening of the spectrum (α ∼ −2.8), which gets flatter again to values of α ∼ −2 for an additional ∼100 kpc. A steepening occurs again after box #32 (i.e. after ∼100 kpc, with α ∼ −3), although here the filament is only clearly detected in the uGMRT Band 3 image. On the other hand, the morphology of the southern filament in A3528S is more complex, as presented in Sect. 4. In this case the radio filament does not seem to be ejected directly from the radio galaxy lobe, but it proceeds south-west the galaxy (i.e. in the opposite direction of its putative motion). We therefore follow this morphology, and then follow the bay and the rest of the filament (see top panels in Fig. 12). The same JP ageing model assumed for the northern filament (i.e. αinj = −0.9 and v⊥ ∼ 240 km s−1) explains the spectral profile well up to the beginning of the bay (i.e. box #5; see bottom right panel in Fig. 12). The filament bay (boxes #5–8) shows a constant spectral index profile, with values of ∼ − 2.2; then the spectral index flattens (α ∼ −1.6) and gradually steepens again to α ∼ −2.3 at the end of the filament (i.e. ∼100 kpc).
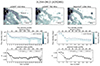 |
Fig. 12. Flux density and spectral index profiles of the two filaments in A3528S. Top row: 12″ resolution images of the uGMRT Band 3 (left), uGMRT Band 4 (centre), and MeerKAT L-band (right). Bottom left: Profiles for the northern filament; bottom right: Profiles for the southern filament. |
The filaments in A3532 also have complex morphology. The BCG, J1257-3021, is supposedly moving towards the west, as also suggested by the direction of the two lobes (see bottom right panels in Fig. 2). Although the two filaments do not start from the outermost edge of the two lobes, we extracted the profile starting from the location of the core. For both filaments the first three boxes (i.e. those tracing the ∼30 kpc of the two lobes) display a flat spectral index and flux density profiles, then steepening towards the external edges of the lobes (Fig. 13). These are well described by a JP model with αinj = −0.7 and v⊥ ∼ 320 − 340 km s−1. The two filaments then start to deviate from this model, presenting a plateau in the flux density profiles. The spectral index profile in the northern filament still shows a gradient, although it steepens more slowly than the JP model, and it flattens around α ∼ −2.7, as in the comma feature. For the southern filaments, the spectral index profiles are less trivial to interpret, as it is undetected in the uGMRT Band 4 and, partly, in the MeerKAT observations. If we only take into account boxes #10–14, where we detect the filament at least at two observing frequencies, we measure a constant spectral index of α ∼ −2.4.
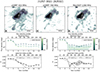 |
Fig. 13. Flux density and spectral index profiles of the two filaments in A3532. Top row: 12″ resolution images of the uGMRT Band 3 (left), uGMRT Band 4 (centre), and MeerKAT L-band (right). Bottom left: Profiles for the northern filament; bottom right: Profiles for the southern filament. |
The spectral index profile in the radio filaments in A3528S and A3532 suggests that they are unlikely simply aged plasma from the AGN. Assuming they are moving at the same velocity as the galaxies (i.e. v⊥ ∼ 140 km s−1 for J1254-2913 and v⊥ ∼ 300 − 340 km s−1 for J1257-3021), it would imply an age of the plasma of about 1.2 Gyr and 400 Myr for the northern and southern filaments in A3528S, and about 300 Myr for the northern and southern filaments in A3532. These plasma ages, and particularly that for the northern filament in A3528S, are unrealistic. This, together with the spectral properties of the two filaments, suggests that some form of re-acceleration must have occurred in these two clusters.
Shocks, cold fronts, and adiabatic compression have been observed to play a role in (re-)accelerating electrons, and displacing the relativistic plasma in the ICM (e.g. radio phoenices; Enßlin & Gopal-Krishna 2002). The coincidence with these kinds of discontinuities, and their interplay with the cluster magnetic field lines, were a possible explanation for the brightness and spectral profiles in the two jets in the BCG in A3376 (Chibueze et al. 2021), and in the radio filament detected at the edge of the HT J1333-3141 in another cluster in the Shapley Supercluster: A3562 (Giacintucci et al. 2022). For these cases, the radio emission associated with the radio galaxies is explained with magnetic reconnection (and therefore in situ re-acceleration) between the radio jets and the cold front or with fast diffusion of cosmic-ray electrons along magnetic field lines stretched under the sloshing cold front, respectively. However, these processes are unlikely to explain steep and uniform spectral indices in region of radio emission that extend for a few hundreds of kiloparsec, as they would require a simultaneous particle re-acceleration by the shock for the full extension of the filaments. One clear example are called gently re-energized tails (GReETs; see de Gasperin et al. 2017), where a mild and continuous re-acceleration of aged (fossil) relativistic electrons in the tails and lobes of radio galaxies (and balancing their radiative losses) is thought to arise from merger-induced turbulence. A case similar to this was also reported in A1550 (Pasini et al. 2022).
In order to investigate the possible presence of disturbed ICM in the clusters, we compared the thermal emission from new eROSITA observations (Merloni et al. 2024; Bulbul et al. 2024; Kluge et al. 2024, Sanders et al. in prep.) with our radio images (Fig. 4). Although it is clear that two peaks (A3528N and A3528S) are in an off-axis merging state (see Appendix B and Fig. B.1), with A3528N falling from NW to SE and A3528S moving from NE to SW (as also shown by Gastaldello et al. 2003), the two radio filaments in A3528S and the long tail in J1254-2916 do not coincide with any clear thermal discontinuities (e.g. cold front or shock front). It is important to note that, contrary to the cases described above, we only have available shallow X-ray observations of the A3528 cluster complex, which can hide potential faint thermal discontinuities. Using the residual maps shown in the bottom row in Fig. 4, we searched for hints of a correlation between X-ray fluctuations and the radio emission. The fluctuations in the X-ray surface brightness were quantified as the sum of the residuals squared within cluster-centred annuli: ΔSX = ∑δSX2/A, where δSX is the residual after subtracting the β-model (see Appendix B) and A is the number of pixel in the annulus. We normalised the fluctuations to the number of pixels in the region to take the different areas into account. Specifically, we investigated the case of A3528S as it represents the clearest example of extended emission covering strong X-ray fluctuations (bottom centre panel in Fig. 4). In this case we derived ΔSX ∼ 0.25 for radius r < 5′ (i.e. r ≲ 350 kpc), where there is the radio emission, and ΔSX ∼ 0.07 for 5′< r < 9′ (i.e. 350 < r < 600 kpc; see red annuli in Fig. B.3). Although this is a simplified approach, this finding supports the idea that the radio emission in the A3528 cluster complex is associated with disturbed ICM (where the highest fluctuations are). In Appendix B we also show the correlation between the radio flux density and the X-ray surface brightness fluctuations from the taper=10″ beam-size annuli (Fig. B.3). The estimation of the power spectra, P(k), which is also linked to the X-ray surface brightness fluctuations, is beyond the scope of this paper.
Finally, it is also unclear whether these filaments are polarised as no polarisation signal has been recorded in our MeerKAT observations. Similarly collimated radio filaments have been observed outside of radio galaxies, and have been shown to have a high polarisation fraction (up to 50%) and small variations in Faraday rotation (Rudnick et al. 2022). An estimate of the magnetic fields in these filaments can be obtained assuming equipartition arguments
![$$ \begin{aligned} B_{\rm eq} = \sqrt{ \frac{24\pi }{7} \frac{E_{\rm tot,min}}{V} } \quad [\mathrm{G}] , \end{aligned} $$](/articles/aa/full_html/2025/02/aa51066-24/aa51066-24-eq19.gif)
where Etot, min/V = 8.6 × 10⁻²⁴(1 + k)4/7(P1.4GHz/V)4/7. In this calculation, we assume a cylindrical geometry (V = πr2L, where r is the width and L the length of the filaments in kpc) and an electron-to-ion ratio of k = 1. This latter assumption is probably an underestimation as it refers to the ratio at the time of the injection when the electrons have not yet suffered energy losses, whilst the measurements from spectral indices in the filaments suggest old plasma. For A3528S, we obtain Beq ∼ 1 μG and Beq ∼ 1.5 μG for filament N (r = 12 kpc and L = 350 kpc) and S (r = 12 kpc and L = 100 kpc), respectively. For A3532, we obtain Beq ∼ 1.7 μG and Beq ∼ 0.9 μG for filament N and S (r = 12 kpc and L = 100 kpc), respectively. These values would increase by a factor of 3 at least, if we assumed k ≫ 1 (Rybicki & Lightman 1986).
Halo-FDCA elliptical fitting results, as well as the ‘manual’ flux densities.
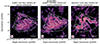 |
Fig. 14. Source subtracted (with inner uv-cut of 2000λ, i.e. 100 kpc) images of A3528S with a taper of 30″. Radio contours are drawn at 3σrms × [ − 1, 1, 2, 4, 8, 16, 32], with σrms,410 = 260 μJy beam−1, σrms,7000 = 144 μJy beam−1, and σrms,1280 = 48 μJy beam−1. The solid white regions show the location of the radio galaxies from the image with the same resolution, which are masked for the Halo-FDCA fitting (Boxelaar et al. 2021, see Appendix D). The dashed region is the area used to calculate the flux density of the candidate mini halo from the image. |
5.3. A possible displaced radio mini halo
The low-resolution images of A3528S (see Appendix A, Fig. A.2) also revealed the presence of additional diffuse radio emission with physical size of about 200 kpc between the two filaments (Figs. 1 and A.2). At 410 MHz and 700 MHz, the emission becomes more prominent after the subtraction of compact sources (i.e. with the inner uv-cut of ∼2000λ to exclude all the emission below 100 kpc) after convolving to 30″ resolution (see Fig. 14). At MeerKAT frequencies this radio emission disappears, either because it becomes too faint at 1.28 GHz to be detected or because the size of the emission is included in the subtracted visibilities. This emission seems to extend in the north-west–south-east direction, and does not seem to coincide with the peak of the thermal emission (see centre panel in Fig. 4).
Following Murgia et al. (2009) for the description of the radial brightness profile of radio (mini-)halos, we assumed that the extended diffuse radio emission between the two filaments in A3528S could be modelled as I(r) = I0exp(−|r|/re), where I0 is the central surface brightness and re the e-folding radius (i.e. the radius at which the brightness drops to I0/e), which is linked with the physical size of the extended diffuse emission according to R = 3re. For this analysis, we used the Halo-Flux Density CAlculator (Halo-FDCA;5 Boxelaar et al. 2021) fitting procedure, assuming elliptical geometry due to the elongated shape of the emission. We used the source-subtracted 30″ uGMRT Band 3 and uGMRT Band 4 images, after masking the region where the diffuse emission associated with J1254-2913 and J1254-2916 were located (see white masks in Fig. 14), and then integrating up to 3re. The fitting results at the two frequencies, are shown in Appendix D. For comparison, we also estimated the flux density from the radio images (Simg). In this case, we defined a region around the diffuse radio emission in the 30″ uGMRT Band 3, uGMRT Band 4, and MeerKAT L-band images (see dashed region in Fig. 14), and then we manually subtracted the flux density associated with the diffuse emission in J1254-2913 and J1254-2916 (see solid regions in Fig. 14). The results of the two analyses are listed in Table 5. For the uGMRT Band 3 measurements we find a good agreement (i.e. S< 3re = 158.9 ± 7.8 and Simg = 185.7.6 ± 15.1); however, the flux densities at 700 MHz have a large discrepancy (i.e. S< 3re = 111.9 ± 8.2 and Simg = 66.1 ± 3.6). This could be due to a less accurate source subtraction outside the diffuse radio emission and could also explain why the major axis of the ellipse (i.e. re, 1) is larger at 700 MHz than at 410 MHz. Using the flux densities at 410 MHz and 700 MHz, we obtain αfit = −0.66 ± 0.16 and αimg = −1.9 ± 0.2. The spectral index value from the fit is flatter than that usually reported from mini halos (Giacintucci et al. 2019). However, contrary to the image flux density measurements where the halo region is fixed, the Halo-FDCA fit is sensitive to different region (see re in Table 5).
The flux density from the 1280 MHz image is Simg = 8.4 ± 1.0 mJy, corresponding to a radio luminosity of P1.4GHz = (4.4 ± 0.6)×1022 W Hz−1, assuming the α = −1.9 ± 0.2. This radio power and the eROSITA bolometric luminosity LX, 500 = (1.8 ± 0.2)×1044 erg s−1 would be in line with the correlation found for the literature sample of mini halos, although in the low-luminosity regime (radio and X-ray) (Giacintucci et al. 2019). We also compared this extended radio emission with the largest sample of giant halos and mini halos in the framework of the LOFAR Two-Meter Sky Survey (LoTSS; Shimwell et al. 2019) sample. Scaling the radio power to 150 MHz (assuming α in the range [ − 1.9, −0.6]), the candidate mini halo would agree well with the P150MHz − kBT2 Mgas relation presented in Zhang et al. (2023), which unifies the diffuse radio emission over small (i.e. mini halos) and large (i.e. giant-halos) scales.
Despite the unusual location with respect to the ICM, and the challenges to completely remove the radio emission associated with the radio galaxies, the shape and the spectral properties support the scenario where this radio source is a candidate mini halo.
6. Conclusion
In this paper we presented a multi-frequency study of the A3528 cluster complex in the Shapley Concentration Core, which includes four clusters: A3528N, A3528S, A3532, and A3530. Particularly, we focused on the radio emission associated with the brightest cluster galaxies (BCGs) and tailed radio galaxies, using data from the uGMRT Band 3 (250–500 MHz), Band 4 (550–900 MHz), and Band 5 (1000–1460 MHz), and MeerKAT L-band (900–1670 MHz) observations. These were complemented with the thermal information given by five observing cycles of the eROSITA All-Sky Survey (eRASS:5). We summarise the results of our work as follows:
-
We detect a plethora of diffuse radio emission in the three radio-loud clusters in the complex, namely A3528N, A3528S, and A3532. Part of this radio emission had never been detected in previous radio observations (Venturi et al. 2001; Di Gennaro et al. 2018). Given its radio-quiet nature, A3530 was excluded by the observations.
-
The morphological parameters of the intracluster medium (ICM) and the residual maps (after subtracting a standard β-model for the ICM surface brightness, as inferred from the eROSITA images; (Merloni et al. 2024; Bulbul et al. 2024; Kluge et al. 2024, Sanders et al. in prep.)) indicate that the three clusters are mildly disturbed, in agreement with a previous analysis with XMM-Newton (Gastaldello et al. 2003) and Chandra (Lakhchaura et al. 2013).
-
We find different morphologies and spectral characteristics in the BCGs of the three clusters. J1254-2900 in A3528N is S-shaped and has no further diffuse radio emission. J1254-2913 in A3528S is a wide-angle tail with opening angle of ∼120°. The highest resolution image (Θ1260 = 2.9″ × 2.2″) reveals the presence of two collimated unresolved jets: the southern one is being ejected towards the south-east and is then turning west. Additionally, we detect two mushrooms to the north-east and south-east of this radio source, and two radio filaments to the south-west. Finally, J1257-3021 in A3532 is also a wide-angle tail with opening angle of 180° and with the two lobes pointing towards the east. For J1254-2913, we detect the presence of two radio filaments, to the north and to the south of the radio source. All these filaments extend over large scales, ranging from ∼200 up to ∼400 kpc. No particular thermal features are revealed from the eRASS:5 image, at the location of this diffuse radio emission.
-
The tailed radio galaxies in A3528N present a standard spectral index profile from the head (α ∼ −0.4) to the end of the tail (α ∼ −1.0). This profile can be explained by standard ageing models, for example a Jaffe-Perola (JP) model. On the contrary, the long head-tail in A3528S can be explained by a JP ageing model only for the first ∼60 kpc. The spectral index profile of the remaining part of the tail can be explained by re-acceleration due to a sloshing core or by a change in the projected velocity of the galaxy within the ICM.
-
We confirm the presence of two mushrooms around J1254-2913, with spectral index values of ∼ − 2. Assuming buoyancy arguments, we obtain rising velocities of ∼1000 km s−1.
-
We measured steep spectra for the radio filaments in J1254-2913 and in J1257-3021, with values of α ∼ −2, −2.5 that remain almost constant over the filament length. If we assume that these filaments are ejected from the radio galaxies, the spectral index profile strongly deviates from the standard JP models. Assuming equipartition arguments, we also estimated a lower limit of Beq ∼ 1 − 2 μG for these filaments.
-
We also find hints of further diffuse emission between the two filaments of A3528S at all radio frequencies. Despite the uncertainties due to the subtraction of the extended emission associated with the radio galaxies and despite the displacement of this emission with respect to the thermal footprint of the cluster, we classified this emission as a candidate mini halo. The position of this radio source in the standard P1.4GHz − LX, 500 diagram, and in the P150MHz − (kBT)2Mgas are consistent with the literature studies (Giacintucci et al. 2019; Zhang et al. 2023, respectively).
Our results show that the presence of diffuse radio emission in the form of filaments and bubbles of plasma can be common in undisturbed or mildly disturbed galaxy clusters. The spatial proximity with radio galaxies strongly supports the scenario where these are the main sources of populations of fossil plasma in clusters. Despite the lack of clear thermal discontinuities for the X-ray images in the A3528 cluster complex, the flatter spectral index of these diffuse radio emission than that expected from ageing models and the hints of correlations with increasing X-ray fluctuations suggest some form of particle (mild) re-acceleration. This could also explain the origin of additional diffuse radio emission, such as mini halos.
Data availability
The appendix to this manuscript is available on Zenodo (https://doi.org/10.5281/zenodo.13380225).
Acknowledgments
We thank the referee for the suggestions which improved the quality of the manuscript. GDG and MB acknowledges funding by the DFG under Germany’s Excellence Strategy – EXC 2121 “Quantum Universe” – 390833306. GDG also acknowledges support from the ERC Consolidator Grant ULU 101086378. EB, AL, and XZ acknowledge financial support from the European Research Council (ERC) Consolidator Grant under the European Union’s Horizon 2020 research and innovation program (grant agreement CoG DarkQuest No 101002585). KT acknowledges financial assistance by the SARAO (http://www.sarao.ac.za). This paper is based on data obtained with the Giant Metrewave Radio Telescope (GMRT). We thank the staff of the GMRT that made these observations possible. GMRT is run by the National Centre for Radio Astrophysics of the Tata Institute of Fundamental Research. The MeerKAT telescope is operated by the South African Radio Astronomy Observatory, which is a facility of the National Research Foundation, an agency of the Department of Science and Innovation. This work is based on data from eROSITA, the soft X-ray instrument aboard SRG, a joint Russian-German science mission supported by the Russian Space Agency (Roskosmos), in the interests of the Russian Academy of Sciences represented by its Space Research Institute (IKI), and the Deutsches Zentrum für Luft- und Raumfahrt (DLR). The SRG spacecraft was built by Lavochkin Association (NPOL) and its subcontractors, and is operated by NPOL with support from the Max Planck Institute for Extraterrestrial Physics (MPE). The development and construction of the eROSITA X-ray instrument was led by MPE, with contributions from the Dr. Karl Remeis Observatory Bamberg & ECAP (FAU Erlangen-Nuernberg), the University of Hamburg Observatory, the Leibniz Institute for Astrophysics Potsdam (AIP), and the Institute for Astronomy and Astrophysics of the University of Tübingen, with the support of DLR and the Max Planck Society. The Argelander Institute for Astronomy of the University of Bonn and the Ludwig Maximilians Universität Munich also participated in the science preparation for eROSITA. The data published here have been reduced using the CARACal pipeline, partially supported by ERC Starting grant number 679627 “FORNAX”, MAECI Grant Number ZA18GR02, DST-NRF Grant Number 113121 as part of the ISARP Joint Research Scheme, and BMBF project 05A17PC2 for D-MeerKAT. Information about CARACal can be obtained online under the URL: https://caracal.readthedocs.io. This research made use of APLpy, an open-source plotting package for Python (Robitaille & Bressert 2012). Basic research in radio astronomy at the Naval Research Laboratory is supported by 6.1 Base funding.
References
- Andrade-Santos, F., Jones, C., Forman, W. R., et al. 2017, ApJ, 843, 76 [Google Scholar]
- Bardelli, S., Pisani, A., Ramella, M., Zucca, E., & Zamorani, G. 1998, MNRAS, 300, 589 [NASA ADS] [CrossRef] [Google Scholar]
- Bardelli, S., Zucca, E., & Baldi, A. 2001, MNRAS, 320, 387 [NASA ADS] [CrossRef] [Google Scholar]
- Boxelaar, J., van Weeren, R., & Botteon, A. 2021, Astron. Comput., 35, 100464 [NASA ADS] [CrossRef] [Google Scholar]
- Brienza, M., Shimwell, T. W., de Gasperin, F., et al. 2021, Nat. Astron., 5, 1261 [NASA ADS] [CrossRef] [Google Scholar]
- Briggs, D. S. 1995, BAAS, 27, 1444 [Google Scholar]
- Brunetti, G., & Jones, T. W. 2014, Int. J. Mod. Phys. D, 23, 1430007 [Google Scholar]
- Brunner, H., Liu, T., Lamer, G., et al. 2022, A&A, 661, A1 [NASA ADS] [CrossRef] [EDP Sciences] [Google Scholar]
- Bulbul, E., Liu, A., Kluge, M., et al. 2024, A&A, 685, A106 [NASA ADS] [CrossRef] [EDP Sciences] [Google Scholar]
- Cassano, R., Brunetti, G., Röttgering, H. J. A., & Brüggen, M. 2010, A&A, 509, A68 [NASA ADS] [CrossRef] [EDP Sciences] [Google Scholar]
- Cassano, R., Brunetti, G., & Venturi, T. 2011, JApA, 32, 519 [NASA ADS] [Google Scholar]
- Cassano, R., Ettori, S., Brunetti, G., et al. 2013, ApJ, 777, 141 [Google Scholar]
- Cavaliere, A., & Fusco-Femiano, R. 1976, A&A, 49, 137 [NASA ADS] [Google Scholar]
- Chandra, P., Ray, A., & Bhatnagar, S. 2004, ApJ, 612, 974 [Google Scholar]
- Chibueze, J. O., Sakemi, H., Ohmura, T., et al. 2021, Nature, 593, 47 [NASA ADS] [CrossRef] [Google Scholar]
- Churazov, E., Brüggen, M., Kaiser, C. R., Böhringer, H., & Forman, W. 2001, ApJ, 554, 261 [NASA ADS] [CrossRef] [Google Scholar]
- Condon, J. J., Cotton, W. D., White, S. V., et al. 2021, ApJ, 917, 18 [CrossRef] [Google Scholar]
- Cuciti, V., Cassano, R., Brunetti, G., et al. 2021, A&A, 647, A51 [EDP Sciences] [Google Scholar]
- de Gasperin, F., Intema, H. T., Shimwell, T. W., et al. 2017, Sci. Adv., 3, e1701634 [Google Scholar]
- de Gasperin, F., Edler, H. W., Williams, W. L., et al. 2023, A&A, 673, A165 [NASA ADS] [CrossRef] [EDP Sciences] [Google Scholar]
- Di Gennaro, G., Venturi, T., Dallacasa, D., et al. 2018, A&A, 620, A25 [NASA ADS] [CrossRef] [EDP Sciences] [Google Scholar]
- Edler, H. W., de Gasperin, F., Brunetti, G., et al. 2022, A&A, 666, A3 [NASA ADS] [CrossRef] [EDP Sciences] [Google Scholar]
- Enßlin, T. A., & Brüggen, M. 2002, MNRAS, 331, 1011 [Google Scholar]
- Enßlin, T. A., & Gopal-Krishna, A&A, 366, 26 [Google Scholar]
- Ettori, S., Bardelli, S., De Grandi, S., et al. 2000, MNRAS, 318, 239 [Google Scholar]
- Finoguenov, A., Henriksen, M. J., Briel, U. G., de Plaa, J., & Kaastra, J. S. 2004, ApJ, 611, 811 [NASA ADS] [CrossRef] [Google Scholar]
- Gastaldello, F., Ettori, S., Molendi, S., et al. 2003, A&A, 411, 21 [NASA ADS] [CrossRef] [EDP Sciences] [Google Scholar]
- Ghizzardi, S., Rossetti, M., & Molendi, S. 2010, A&A, 516, A32 [NASA ADS] [CrossRef] [EDP Sciences] [Google Scholar]
- Giacintucci, S., Venturi, T., Bardelli, S., Dallacasa, D., & Zucca, E. 2004, A&A, 419, 71 [NASA ADS] [CrossRef] [EDP Sciences] [Google Scholar]
- Giacintucci, S., Venturi, T., Brunetti, G., et al. 2005, A&A, 440, 867 [NASA ADS] [CrossRef] [EDP Sciences] [Google Scholar]
- Giacintucci, S., Markevitch, M., Cassano, R., et al. 2017, ApJ, 841, 71 [Google Scholar]
- Giacintucci, S., Markevitch, M., Cassano, R., et al. 2019, ApJ, 880, 70 [Google Scholar]
- Giacintucci, S., Venturi, T., Markevitch, M., et al. 2022, ApJ, 934, 49 [NASA ADS] [CrossRef] [Google Scholar]
- Gitti, M., Ferrari, C., Domainko, W., Feretti, L., & Schindler, S. 2007, A&A, 470, L25 [NASA ADS] [CrossRef] [EDP Sciences] [Google Scholar]
- Gupta, Y., Ajithkumar, B., Kale, H. S., et al. 2017, Curr. Sci., 113, 707 [NASA ADS] [CrossRef] [Google Scholar]
- Haines, C. P., Busarello, G., Merluzzi, P., et al. 2018, MNRAS, 481, 1055 [Google Scholar]
- Higuchi, Y., Okabe, N., Merluzzi, P., et al. 2020, MNRAS, 497, 52 [NASA ADS] [CrossRef] [Google Scholar]
- Hotan, A. W., Bunton, J. D., Chippendale, A. P., et al. 2021, PASA, 38, e009 [NASA ADS] [CrossRef] [Google Scholar]
- Hugo, B. V., Perkins, S., Merry, B., Mauch, T., & Smirnov, O. M. 2022, ASP Conf. Ser., 532, 541 [NASA ADS] [Google Scholar]
- Intema, H. T., van der Tol, S., Cotton, W. D., et al. 2009, A&A, 501, 1185 [NASA ADS] [CrossRef] [EDP Sciences] [Google Scholar]
- Jaffe, W. J., & Perola, G. C. 1973, A&A, 26, 423 [NASA ADS] [Google Scholar]
- Jonas, J., & MeerKAT Team 2016, MeerKAT Science: On the Pathway to the SKA, 1 [Google Scholar]
- Jones, D. H., Read, M. A., Saunders, W., et al. 2009, MNRAS, 399, 683 [Google Scholar]
- Józsa, G. I. G., White, S. V., Thorat, K., et al. 2020a, ASP Conf. Ser., 527, 635 [Google Scholar]
- Józsa, G. I. G., White, S. V., Thorat, K., et al. 2020b, CARACal: Containerized Automated Radio Astronomy Calibration pipeline, Astrophysics Source Code Library [record ascl:2006.014] [Google Scholar]
- Kenyon, J. S., Smirnov, O. M., Grobler, T. L., & Perkins, S. J. 2018, MNRAS, 478, 2399 [NASA ADS] [CrossRef] [Google Scholar]
- Kluge, M., Comparat, J., Liu, A., et al. 2024, A&A, 688, A210 [NASA ADS] [CrossRef] [EDP Sciences] [Google Scholar]
- Knowles, K., Cotton, W. D., Rudnick, L., et al. 2022, A&A, 657, A56 [NASA ADS] [CrossRef] [EDP Sciences] [Google Scholar]
- Koribalski, B. S., Duchesne, S. W., Lenc, E., et al. 2024, MNRAS, 533, 608 [NASA ADS] [CrossRef] [Google Scholar]
- Lakhchaura, K., Singh, K. P., Saikia, D. J., & Hunstead, R. W. 2013, ApJ, 767, 91 [NASA ADS] [CrossRef] [Google Scholar]
- Liu, A., Bulbul, E., Ramos-Ceja, M. E., et al. 2023, A&A, 670, A96 [NASA ADS] [CrossRef] [EDP Sciences] [Google Scholar]
- Liu, A., Bulbul, E., Kluge, M., et al. 2024, A&A, 683, A130 [NASA ADS] [CrossRef] [EDP Sciences] [Google Scholar]
- Lovisari, L., Forman, W. R., Jones, C., et al. 2017, ApJ, 846, 51 [Google Scholar]
- Mandal, S., Intema, H. T., van Weeren, R. J., et al. 2020, A&A, 634, A4 [NASA ADS] [CrossRef] [EDP Sciences] [Google Scholar]
- Markevitch, M., & Vikhlinin, A. 1997, ApJ, 474, 84 [NASA ADS] [CrossRef] [Google Scholar]
- Markevitch, M., & Vikhlinin, A. 2007, Phys. Rep., 443, 1 [Google Scholar]
- Mazzotta, P., & Giacintucci, S. 2008, ApJ, 675, L9 [Google Scholar]
- Merloni, A., Lamer, G., Liu, T., et al. 2024, A&A, 682, A34 [NASA ADS] [CrossRef] [EDP Sciences] [Google Scholar]
- Merluzzi, P., Busarello, G., Haines, C. P., et al. 2015, MNRAS, 446, 803 [NASA ADS] [CrossRef] [Google Scholar]
- Migkas, K., Kox, D., Schellenberger, G., et al. 2024, A&A, 688, A107 [NASA ADS] [CrossRef] [EDP Sciences] [Google Scholar]
- Miley, G. 1980, ARA&A, 18, 165 [Google Scholar]
- Murgia, M., Fanti, C., Fanti, R., et al. 1999, A&A, 345, 769 [NASA ADS] [Google Scholar]
- Murgia, M., Govoni, F., Markevitch, M., et al. 2009, A&A, 499, 679 [NASA ADS] [CrossRef] [EDP Sciences] [Google Scholar]
- O’Dea, C. P., & Baum, S. A. 2023, Galaxies, 11, 67 [CrossRef] [Google Scholar]
- O’Dea, C. P., & Owen, F. N. 1985, AJ, 90, 954 [CrossRef] [Google Scholar]
- Offringa, A. R., McKinley, B., Hurley-Walker, N., et al. 2014, MNRAS, 444, 606 [Google Scholar]
- Owen, F. N., Eilek, J. A., & Kassim, N. E. 2000, ApJ, 543, 611 [NASA ADS] [CrossRef] [Google Scholar]
- Pasini, T., Edler, H. W., Brüggen, M., et al. 2022, A&A, 663, A105 [NASA ADS] [CrossRef] [EDP Sciences] [Google Scholar]
- Pfrommer, C., & Enßlin, T. A. 2004, A&A, 413, 17 [NASA ADS] [CrossRef] [EDP Sciences] [Google Scholar]
- Piffaretti, R., Arnaud, M., Pratt, G. W., Pointecouteau, E., & Melin, J. B. 2011, A&A, 534, A109 [NASA ADS] [CrossRef] [EDP Sciences] [Google Scholar]
- Predehl, P., Andritschke, R., Arefiev, V., et al. 2021, A&A, 647, A1 [EDP Sciences] [Google Scholar]
- Press, W. H., & Schechter, P. 1974, ApJ, 187, 425 [Google Scholar]
- Richard-Laferrière, A., Hlavacek-Larrondo, J., Nemmen, R. S., et al. 2020, MNRAS, 499, 2934 [Google Scholar]
- Robitaille, T., & Bressert, E. 2012, APLpy: Astronomical Plotting Library in Python, Astrophysics Source Code Library [record ascl:1208.017] [Google Scholar]
- Rossetti, M., Ghizzardi, S., Molendi, S., & Finoguenov, A. 2007, A&A, 463, 839 [NASA ADS] [CrossRef] [EDP Sciences] [Google Scholar]
- Rossetti, M., Gastaldello, F., Eckert, D., et al. 2017, MNRAS, 468, 1917 [Google Scholar]
- Rudnick, L., Brüggen, M., Brunetti, G., et al. 2022, ApJ, 935, 168 [NASA ADS] [CrossRef] [Google Scholar]
- Rybicki, G. B., & Lightman, A. P. 1986, Radiative Processes in Astrophysics (Wiley-VCH) [Google Scholar]
- Sanders, J. S., Fabian, A. C., Russell, H. R., Walker, S. A., & Blundell, K. M. 2016, MNRAS, 460, 1898 [Google Scholar]
- Santos, J. S., Rosati, P., Tozzi, P., et al. 2008, A&A, 483, 35 [NASA ADS] [CrossRef] [EDP Sciences] [Google Scholar]
- Savini, F., Bonafede, A., Brüggen, M., et al. 2019, A&A, 622, A24 [NASA ADS] [CrossRef] [EDP Sciences] [Google Scholar]
- Shapley, H. 1930, Harvard College Obs. Bull., 874, 9 [NASA ADS] [Google Scholar]
- Shimwell, T. W., Tasse, C., Hardcastle, M. J., et al. 2019, A&A, 622, A1 [NASA ADS] [CrossRef] [EDP Sciences] [Google Scholar]
- Slee, O. B., Roy, A. L., Murgia, M., Andernach, H., & Ehle, M. 2001, AJ, 122, 1172 [NASA ADS] [CrossRef] [Google Scholar]
- Springel, V., Frenk, C. S., & White, S. D. M. 2006, Nature, 440, 1137 [NASA ADS] [CrossRef] [Google Scholar]
- van Haarlem, M. P., Wise, M. W., Gunst, A. W., et al. 2013, A&A, 556, A2 [NASA ADS] [CrossRef] [EDP Sciences] [Google Scholar]
- van Weeren, R. J., de Gasperin, F., Akamatsu, H., et al. 2019, Space Sci. Rev., 215, 16 [Google Scholar]
- van Weeren, R. J., Shimwell, T. W., Botteon, A., et al. 2021, A&A, 651, A115 [NASA ADS] [CrossRef] [EDP Sciences] [Google Scholar]
- Vazza, F., Wittor, D., Brunetti, G., & Brüggen, M. 2021, A&A, 653, A23 [NASA ADS] [CrossRef] [EDP Sciences] [Google Scholar]
- Venturi, T., Bardelli, S., Morganti, R., & Hunstead, R. W. 2000, MNRAS, 314, 594 [NASA ADS] [CrossRef] [Google Scholar]
- Venturi, T., Bardelli, S., Zambelli, G., Morganti, R., & Hunstead, R. W. 2001, MNRAS, 324, 1131 [NASA ADS] [CrossRef] [Google Scholar]
- Venturi, T., Bardelli, S., Dallacasa, D., et al. 2003, A&A, 402, 913 [NASA ADS] [CrossRef] [EDP Sciences] [Google Scholar]
- Venturi, T., Rossetti, M., Brunetti, G., et al. 2017, A&A, 603, A125 [NASA ADS] [CrossRef] [EDP Sciences] [Google Scholar]
- Venturi, T., Giacintucci, S., Merluzzi, P., et al. 2022, A&A, 660, A81 [NASA ADS] [CrossRef] [EDP Sciences] [Google Scholar]
- Zhang, X., Simionescu, A., Gastaldello, F., et al. 2023, A&A, 672, A42 [NASA ADS] [CrossRef] [EDP Sciences] [Google Scholar]
- ZuHone, J. A., Markevitch, M., Ruszkowski, M., & Lee, D. 2013, ApJ, 762, 69 [NASA ADS] [CrossRef] [Google Scholar]
- ZuHone, J. A., Brunetti, G., Giacintucci, S., & Markevitch, M. 2015, ApJ, 801, 146 [Google Scholar]
- ZuHone, J. A., Markevitch, M., Weinberger, R., Nulsen, P., & Ehlert, K. 2021, ApJ, 914, 73 [NASA ADS] [CrossRef] [Google Scholar]
All Tables
All Figures
|
Fig. 1. Full-resolution images of the central region of A3528N (top row), A3528S (centre row), and A3532 (bottom row). From left to right: uGMRT Band 3 (410 MHz), uGMRT Band 4 (650/700 MHz), and MeerKAT (1284 MHz). Radio contours are displayed at 3σrms, ν × [ − 1, 1, 2, 4, 8, 16, 32] levels (when present, negative contours are shown as dashed lines), where σrms, ν is the map noise at the different frequencies (see Table 3). The radio sources and features are labelled in the right panel. The beams are displayed in the bottom left corner of each panel (see Table 3). The white cross (×) shows the location of the X-ray peak. |
| In the text | |
|
Fig. 2. High-resolution images of the cluster radio sources. Top left: J1254-2900 and J1254-2901a (A3528N); Top right: J1254-2901b (A3528N); Centre left: J1254-2904 (A3528N); Centre right: J1254-2913 (A3528S); Bottom left: J1254-2916 (A3528S); Bottom right: J1257-3021 (A3532). For each radio galaxy, the uGMRT Band 4 (robust=−2; left) and the uGMRT Band 5 (robust=0; right) are displayed. The beam is displayed in the bottom left corner of each panel (see Table 3). |
| In the text | |
|
Fig. 3. Unsharped Gaussian Gradient Magnitude (GGM; Sanders et al. 2016) filtered images with σ = 2 pixels of the central region of A3528S. From left to right: uGMRT Band 3 (410 MHz), uGMRT Band 4 (700 MHz) and MeerKAT L-band (1284 MHz), at full resolution (see Table 3). On the top right corner of each panel, a zoom-in on the WAT, at the same resolution and frequency. |
| In the text | |
|
Fig. 4. Radio/X-ray/optical comparison. Top panels: Optical (VLT Survey Telescope gri; Merluzzi et al. 2015) and X-ray (0.2–2.3 keV eROSITA All-Sky Survey (eRASS), blue; Bulbul et al. 2024; Kluge et al. 2024, Sanders et. al. in prep.) composite images of A3528N (left), A3528S (centre), and A3532 (right) with uGMRT Band 3 radio contours (white) drawn at 4σrms × [2, 4, 8, 16, 36, 128, 256]. To emphasise the X-ray features, we also overplot the contours of the unsharped Gaussian gradient magnitude filtered image (Sanders et al. 2016) at [3,6,20] × 10−6 photons cm−2 s−1 levels (light blue). Bottom panels: Residual X-ray images after subtracting a standard β-model (Cavaliere & Fusco-Femiano 1976). The radio contours are from the uGMRT Band 3 taper=10″ image (beam in the bottom left corners), at the 4σrms × [1, 2, 4, 8, 16, 36, 128, 256] levels. |
| In the text | |
|
Fig. 5. Integrated spectra of the radio sources in the A3528 cluster complex. Top row: Flux densities were measured after convolving all the frequencies at the same resolution. Different dashed lines in each panel are colour-coded based on the region where the flux density was extracted (see bottom panels), and describe the fitted α (see Column 6 in Table 4). Bottom row: uGMRT Band 3 images of the three clusters (from left to right: A3528N, A3528S and A3532) at ∼12″ (see beam in the bottom-left corner of each panel). Radio contours start at the 3σrms level, which was used as reference for drawing the regions. |
| In the text | |
|
Fig. 6. Spectral index maps of the inner region of the three clusters in the A3528 cluster complex. From left to right: A3528N, A3528S, and A3532. Top rows: High resolution (Θ ∼ 7″); bottom rows: Low resolution (Θ ∼ 19″, i.e. taper=15″). The corresponding uncertainty error maps are shown in Fig. C.1 Radio contours are drawn at 3σrms × [1, 2, 4, 8, 16, 32] of the uGMRT Band 4 observations at the same resolution (not primary beam corrected; see Table 3 for the noise level). |
| In the text | |
|
Fig. 7. Spectral index maps between uGMRT Band 4 (robust=−2.0) and Band 5 (robust=0.0) of the radio galaxies in the three clusters in the A3528 cluster complex, namely J1254-2900 and J1254-2901a (top left panel), J1254-2901b (top centre panel), J1254-2904 (top right panel), J1254-2913 (bottom left panel), J1254-2916 (bottom centre panel), and J1257-3021 (bottom right panel). The resolutions of the maps are 4.5″ (A3528N), 3.9″ (A3528S), and 3.7″ (A3532). The corresponding uncertainty error maps are shown in Fig. C.2. The radio contours are drawn at 3σrms × [1, 2, 4, 8, 16, 32, …] of the uGMRT Band 5 observations at the same resolution (not primary beam corrected; see Table 3 for the noise level). |
| In the text | |
|
Fig. 8. Flux density and spectral index profiles of the WAT J1254-2913 in A3528S. 4″ resolution images of the uGMRT Band 4 (top right) and uGMRT Band 5 (bottom right) are shown to the right of the profiles. |
| In the text | |
|
Fig. 9. Flux density and spectral index profiles of the radio tails in A3528N: J1254-2901a (top row) and J1254-2904 (bottom row). 12″ resolution images of the uGMRT Band 3 (top right), uGMRT Band 4 (centre right), and MeerKAT L-band (bottom right) are shown to the right of the profiles. |
| In the text | |
|
Fig. 10. Flux density and spectral index profiles of J1254-2916 in A3528S. 12″ resolution images of the uGMRT Band 3 (top right), uGMRT Band 4 (centre right), and MeerKAT L-band (bottom right) are shown to the right of the profiles. |
| In the text | |
|
Fig. 11. Flux density and spectral index profiles of the two mushrooms in J1254-2913. 12″ resolution images of the uGMRT Band 3 (top left) uGMRT Band 4 (top centre) and MeerKAT L-band (top right) are shown at the top of the profiles. |
| In the text | |
|
Fig. 12. Flux density and spectral index profiles of the two filaments in A3528S. Top row: 12″ resolution images of the uGMRT Band 3 (left), uGMRT Band 4 (centre), and MeerKAT L-band (right). Bottom left: Profiles for the northern filament; bottom right: Profiles for the southern filament. |
| In the text | |
|
Fig. 13. Flux density and spectral index profiles of the two filaments in A3532. Top row: 12″ resolution images of the uGMRT Band 3 (left), uGMRT Band 4 (centre), and MeerKAT L-band (right). Bottom left: Profiles for the northern filament; bottom right: Profiles for the southern filament. |
| In the text | |
|
Fig. 14. Source subtracted (with inner uv-cut of 2000λ, i.e. 100 kpc) images of A3528S with a taper of 30″. Radio contours are drawn at 3σrms × [ − 1, 1, 2, 4, 8, 16, 32], with σrms,410 = 260 μJy beam−1, σrms,7000 = 144 μJy beam−1, and σrms,1280 = 48 μJy beam−1. The solid white regions show the location of the radio galaxies from the image with the same resolution, which are masked for the Halo-FDCA fitting (Boxelaar et al. 2021, see Appendix D). The dashed region is the area used to calculate the flux density of the candidate mini halo from the image. |
| In the text | |
Current usage metrics show cumulative count of Article Views (full-text article views including HTML views, PDF and ePub downloads, according to the available data) and Abstracts Views on Vision4Press platform.
Data correspond to usage on the plateform after 2015. The current usage metrics is available 48-96 hours after online publication and is updated daily on week days.
Initial download of the metrics may take a while.