Fig. 14.
Download original image
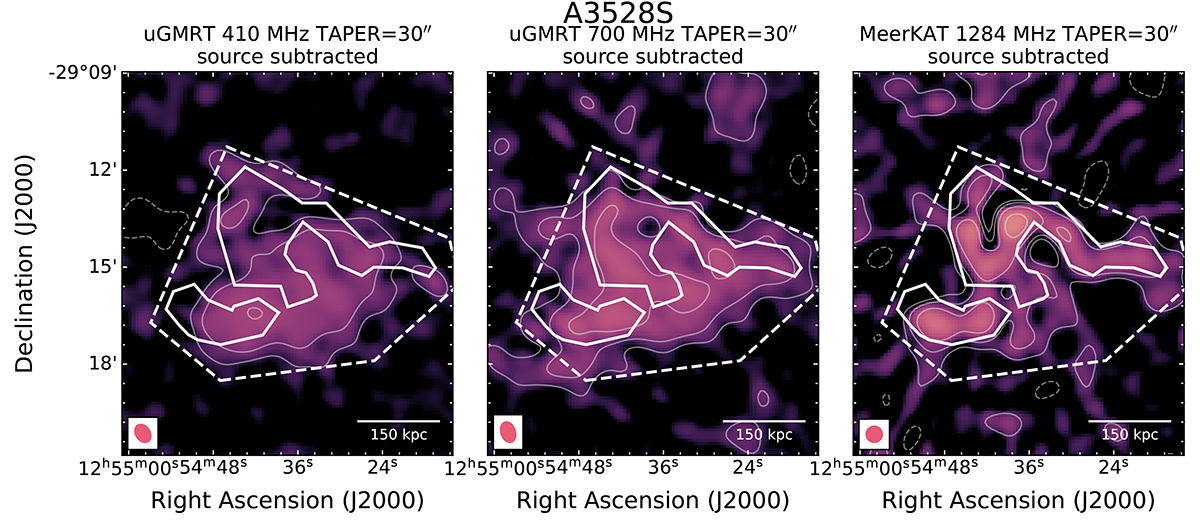
Source subtracted (with inner uv-cut of 2000λ, i.e. 100 kpc) images of A3528S with a taper of 30″. Radio contours are drawn at 3σrms × [ − 1, 1, 2, 4, 8, 16, 32], with σrms,410 = 260 μJy beam−1, σrms,7000 = 144 μJy beam−1, and σrms,1280 = 48 μJy beam−1. The solid white regions show the location of the radio galaxies from the image with the same resolution, which are masked for the Halo-FDCA fitting (Boxelaar et al. 2021, see Appendix D). The dashed region is the area used to calculate the flux density of the candidate mini halo from the image.
Current usage metrics show cumulative count of Article Views (full-text article views including HTML views, PDF and ePub downloads, according to the available data) and Abstracts Views on Vision4Press platform.
Data correspond to usage on the plateform after 2015. The current usage metrics is available 48-96 hours after online publication and is updated daily on week days.
Initial download of the metrics may take a while.