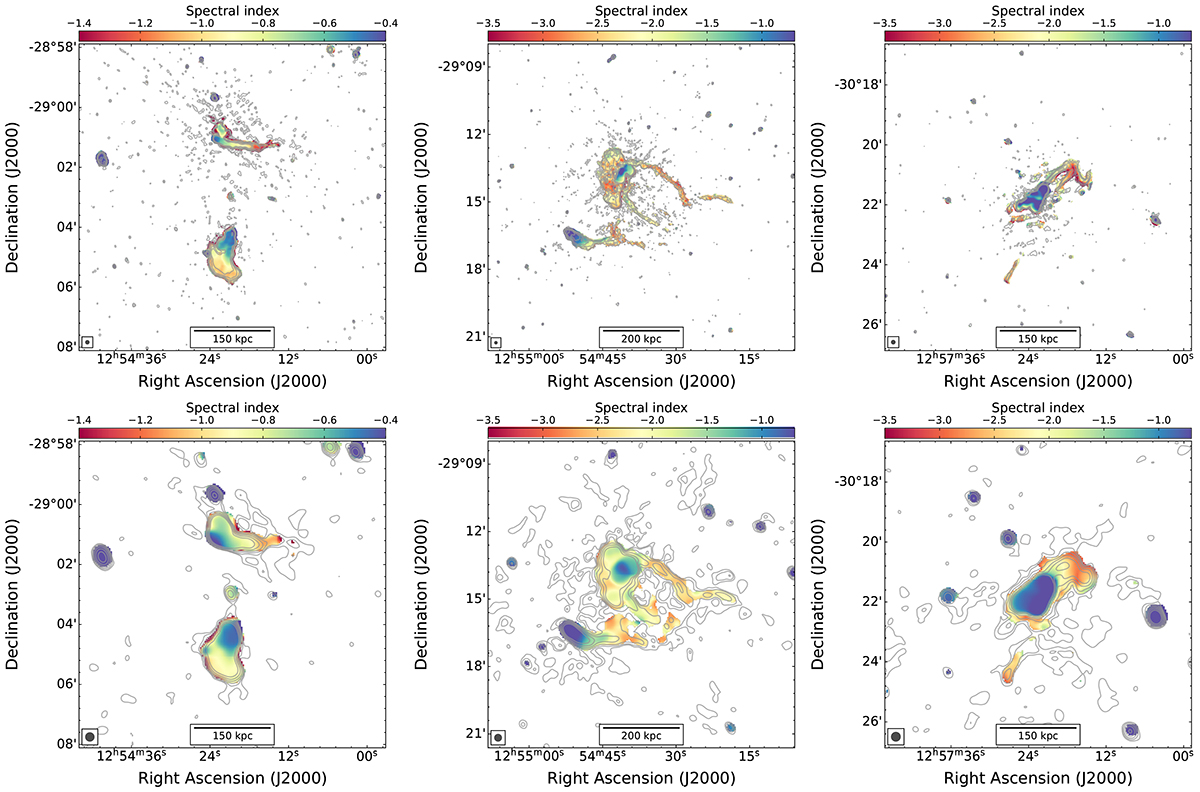
Fig. 6.
Download original image
Spectral index maps of the inner region of the three clusters in the A3528 cluster complex. From left to right: A3528N, A3528S, and A3532. Top rows: High resolution (Θ ∼ 7″); bottom rows: Low resolution (Θ ∼ 19″, i.e. taper=15″). The corresponding uncertainty error maps are shown in Fig. C.1 Radio contours are drawn at 3σrms × [1, 2, 4, 8, 16, 32] of the uGMRT Band 4 observations at the same resolution (not primary beam corrected; see Table 3 for the noise level).
Current usage metrics show cumulative count of Article Views (full-text article views including HTML views, PDF and ePub downloads, according to the available data) and Abstracts Views on Vision4Press platform.
Data correspond to usage on the plateform after 2015. The current usage metrics is available 48-96 hours after online publication and is updated daily on week days.
Initial download of the metrics may take a while.