Open Access
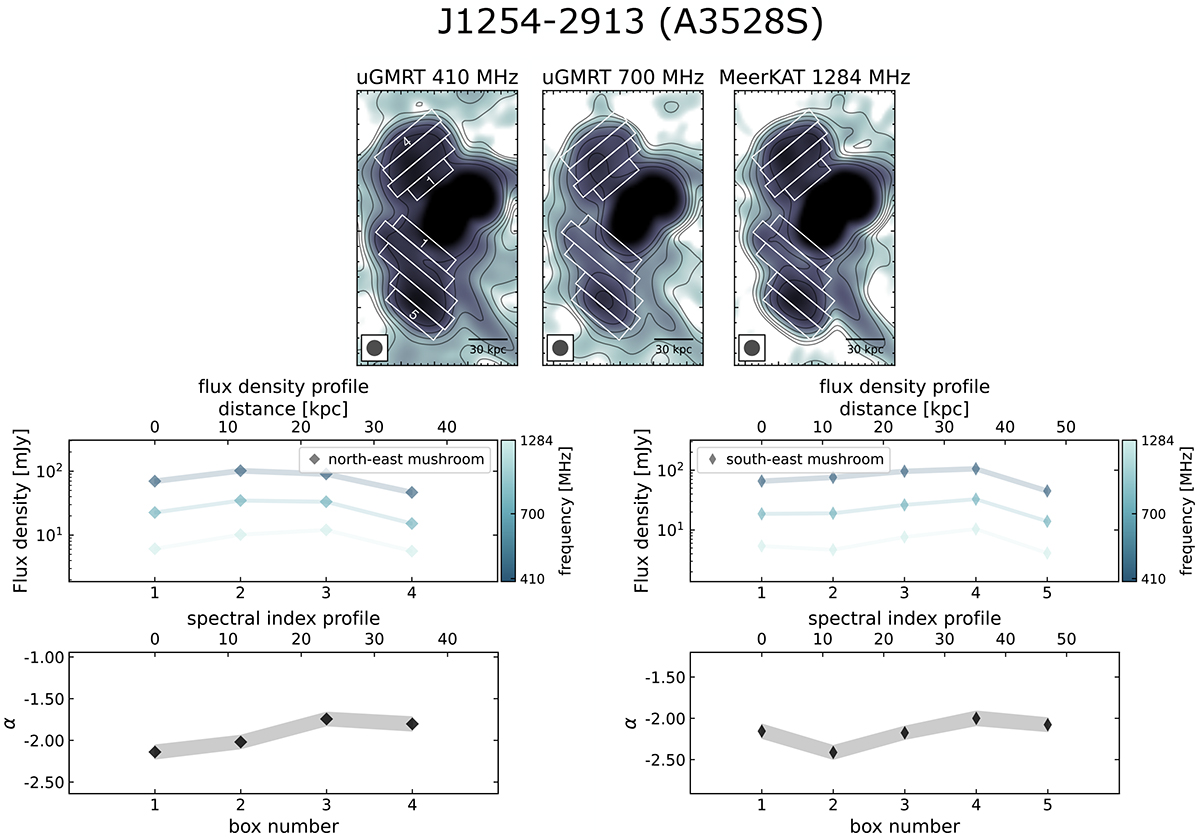
Fig. 11.
Download original image
Flux density and spectral index profiles of the two mushrooms in J1254-2913. 12″ resolution images of the uGMRT Band 3 (top left) uGMRT Band 4 (top centre) and MeerKAT L-band (top right) are shown at the top of the profiles.
Current usage metrics show cumulative count of Article Views (full-text article views including HTML views, PDF and ePub downloads, according to the available data) and Abstracts Views on Vision4Press platform.
Data correspond to usage on the plateform after 2015. The current usage metrics is available 48-96 hours after online publication and is updated daily on week days.
Initial download of the metrics may take a while.