Fig. 5.
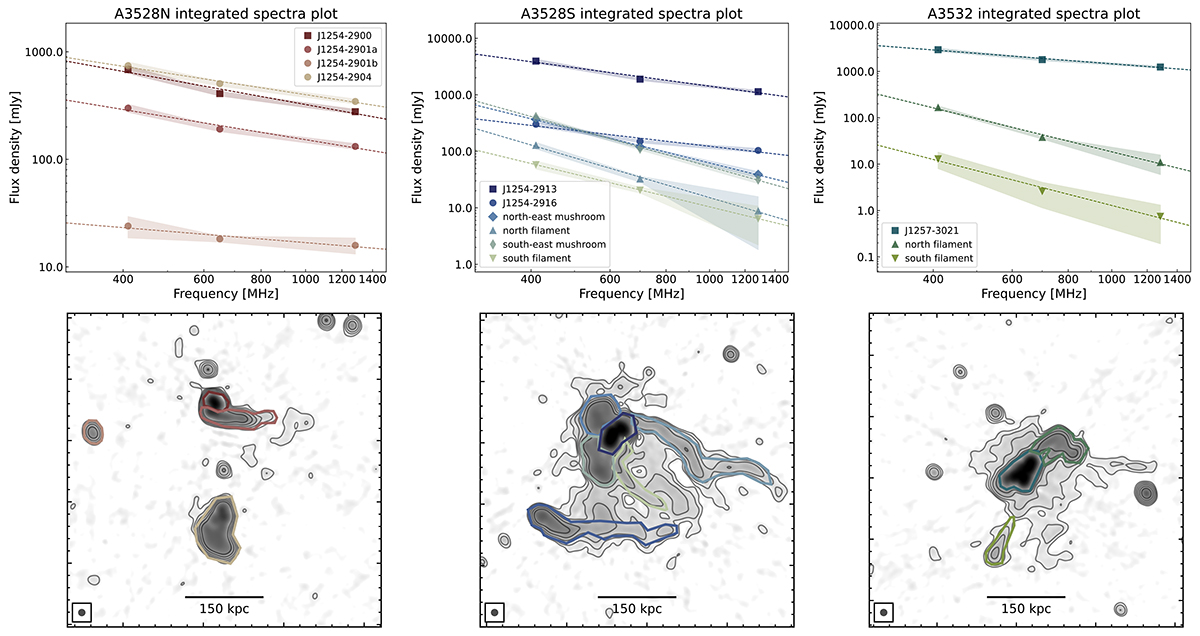
Download original image
Integrated spectra of the radio sources in the A3528 cluster complex. Top row: Flux densities were measured after convolving all the frequencies at the same resolution. Different dashed lines in each panel are colour-coded based on the region where the flux density was extracted (see bottom panels), and describe the fitted α (see Column 6 in Table 4). Bottom row: uGMRT Band 3 images of the three clusters (from left to right: A3528N, A3528S and A3532) at ∼12″ (see beam in the bottom-left corner of each panel). Radio contours start at the 3σrms level, which was used as reference for drawing the regions.
Current usage metrics show cumulative count of Article Views (full-text article views including HTML views, PDF and ePub downloads, according to the available data) and Abstracts Views on Vision4Press platform.
Data correspond to usage on the plateform after 2015. The current usage metrics is available 48-96 hours after online publication and is updated daily on week days.
Initial download of the metrics may take a while.