Open Access
Fig. 5.
Download original image
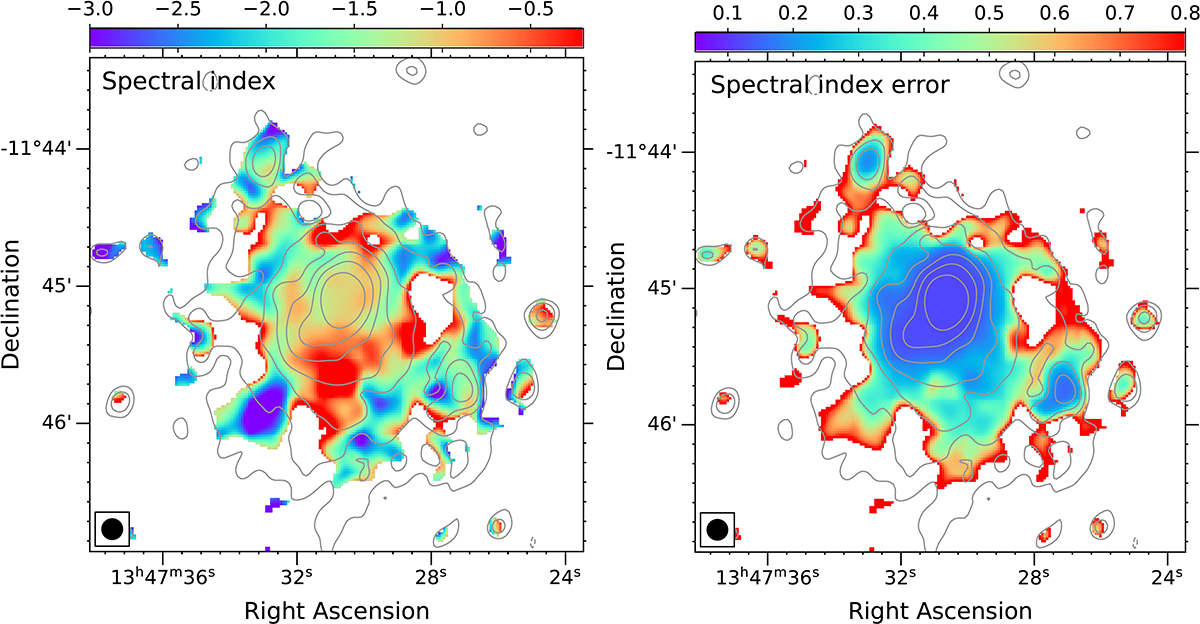
Left: Distribution of spectral indices between 700 MHz and 1.28 GHz. The overlaid contours are drawn from the corresponding MeerKAT 1.28 GHz map. The contours start from 3σ, and are spaced by a factor of 2. Right: Associated spectral index error.
Current usage metrics show cumulative count of Article Views (full-text article views including HTML views, PDF and ePub downloads, according to the available data) and Abstracts Views on Vision4Press platform.
Data correspond to usage on the plateform after 2015. The current usage metrics is available 48-96 hours after online publication and is updated daily on week days.
Initial download of the metrics may take a while.