Fig. 7.
Download original image
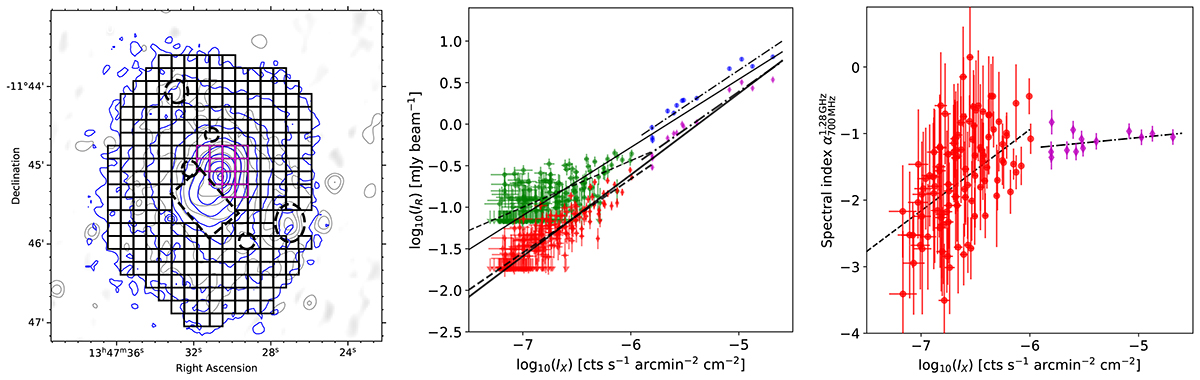
Spatial radio–X-ray SB correlation. Left: Box regions, within the 3σChandra (blue) contour, where the SB is extracted. The first Chandra (blue) and MeerKAT (black) contours are levelled at 3σ, where σ = 2 × 10⁻⁸ and σ = 12 μJy beam−1, respectively. The next contours are spaced by a factor of 2. Discrete sources are masked and indicated by black dashed lines. Middle: Radio–X-ray correlation for the uGMRT 700 MHz data (i.e. green and blue points) and the MeerKAT 1.28 GHz data (i.e. red and magenta points) with the Chandra data. The thin and thick solid lines are the best-fit lines for the uGMRT and MeerKAT data, respectively. The dash-dotted and dashed lines are from the data in the inner (magenta) and outer regions, respectively. Right: Correlation between the spectral index and the X-ray SB. The data points with the best-fit (dashed and dash-dotted lines) for the inner and outer regions are shown in red and magenta, respectively.
Current usage metrics show cumulative count of Article Views (full-text article views including HTML views, PDF and ePub downloads, according to the available data) and Abstracts Views on Vision4Press platform.
Data correspond to usage on the plateform after 2015. The current usage metrics is available 48-96 hours after online publication and is updated daily on week days.
Initial download of the metrics may take a while.