| Issue |
A&A
Volume 691, November 2024
|
|
|---|---|---|
| Article Number | A135 | |
| Number of page(s) | 14 | |
| Section | Cosmology (including clusters of galaxies) | |
| DOI | https://doi.org/10.1051/0004-6361/202451144 | |
| Published online | 06 November 2024 | |
Unveiling the shape: A multi-wavelength analysis of the galaxy clusters Abell 76 and Abell 1307
1
Instituto de Astrofísica de Canarias, C/Vía Láctea s/n, 38205 La Laguna, Tenerife, Spain
2
Universidad de La Laguna, Departamento de Astrofísica, 38206 La Laguna, Tenerife, Spain
3
Dipartimento di Fisica G. Occhialini, Università degli Studi di Milano Bicocca, Piazza della Scienza 3, 20126 Milano, Italy
4
Max-Planck-Institut für Physik, Boltzmannstr. 8, 85748 Garching, Germany
5
Universitäts-Sternwarte München, Fakultät für Physik, Ludwig-Maximilian-Universität München, Scheinerstr. 1, 81679 München, Germany
6
Max-Planck-Institut für extraterrestrische Physik, Gießenbachstraße 1, 85748 Garching, Germany
★ Corresponding author; This email address is being protected from spambots. You need JavaScript enabled to view it.
Received:
17
June
2024
Accepted:
25
September
2024
Abstract
We analyse the dynamical state of the galaxy clusters Abell 76 and Abell 1307 from the optical point of view, presenting a coherent scenario that responds to the X-ray emissions observed in these structures. Our study is based on 231 and 164 spectroscopic redshifts, for the clusters A76 and A1307, respectively, obtained mostly with the Telescopio Nazionale Galileo, and complemented with others collected from the SDSS DR16 spectroscopic database and the literature. We find that A76 and A1307 are two galaxy clusters at z = 0.0390 and 0.0815, respectively, with a velocity dispersion of 650 ± 56 km s−1 and 863 ± 85 km s−1, and they show velocity distributions following, in practice, Gaussian profiles. From our dynamical analysis, X-ray studies and SZ-Planck emission, we obtain a mean total mass M500 = 1.7 ± 0.6 ⋅ 1014 M⊙ and 3.5 ± 1.3 ⋅ 1014 M⊙ for A76 and A1307, respectively. Using the SDSS DR16 photometric database, we find that the spatial distribution of likely cluster members in the case of A76 is very anisotropic, while A1307 shows a compact distribution of galaxies, but it is double peaked and elongated in the south-north direction. Using XMM-Newton X-ray data, we compared the surface brightness maps with galaxy distributions and noticed that both distributions are correlated. We reconstructed the total mass profile and velocity anisotropy of both clusters by analysing the full projected phase space, through the MG-MAMPOSSt code. Our study reveals a slight indication of radial orbits for A76, while A1307 seems to prefer more isotropic orbits in the whole cluster range. In summary, A76 represents a typical young cluster, in an early stage of formation, with a very low X-ray surface brightness but a high temperature showing a very anisotropic galaxy distribution. A1307 is however more consolidated and massive showing in-homogeneous galaxy distribution and an asymmetric X-ray emission, which suggest a scenario characterised by recent minor mergers.
Key words: galaxies: clusters: general / galaxies: clusters: intracluster medium / galaxies: clusters: individual: Abell 76 / galaxies: clusters: individual: Abell 1307
© The Authors 2024
 Open Access article, published by EDP Sciences, under the terms of the Creative Commons Attribution License (https://creativecommons.org/licenses/by/4.0), which permits unrestricted use, distribution, and reproduction in any medium, provided the original work is properly cited.
This article is published in open access under the Subscribe to Open model. This email address is being protected from spambots. You need JavaScript enabled to view it. to support open access publication.
1 Introduction
The formation of galaxy clusters (GCs) is governed by the collapse of the largest gravitationally bound overdensities in the initial density field. These massive structures are composed of dark matter, gas, and galaxies, which gives them an important role in the study of structure formation, galaxy evolution, thermodynamics of the intergalactic medium, and plasma physics. Furthermore, their large mass makes them an essential observational test of the growth of structure over cosmological time. So, the hierarchical models of cluster formation predict that mergers involving small galaxy systems play an important role in the cluster assembly and evolution, mainly in those systems showing low-medium mass (e.g. Berrier et al. 2009; McGee et al. 2009). Cluster merger processes are characterised by the fact that galaxies and gas react at different timescales. Hence the importance of studying galaxy clusters from a multi-wavelength point of view. While the galaxy component is mainly studied using optical photometric and spectroscopic observations, X-ray emission reflects the gas behaviour. In this paper, we analyse the dynamics of two nearby clusters, Abell 76 and Abell 1307 (hereafter A76 and A1307) in order to investigate their formation as low-medium mass clusters in the nearby Universe.
A76 is part of the Extended Northern ROSAT Galaxy Cluster Survey (NORAS II; Böhringer et al. 2017) and named RXCJ0039.9+0650. It has been classified as a galaxy cluster showing one of the lowest X-ray surface brightnesses among the nearby GCs. Its X-ray emission has been extensively studied by Ota et al. (2013) (hereafter OTA13) using Suzaku observations, which reveals a very clumpy shape in surface brightness and an extremly high entropy in the innermost region. Additionally, XMM-Newton observations were carried out by the XMM-Newton Cluster Survey DR1 (XCS-DR1; Mehrtens et al. 2012). These studies suggest that A76 is a young, low-mass GC, at an early stage of cluster formation. A76 was also detected by the Planck satellite as a Sunyaev-Zeldovich (SZ) source (Sunyaev & Zeldovich 1969), named PSZ2 G117.98-55.88, with an estimated SZ mass of MSZ = 1.7 ± 0.2 ⋅ 1014 M⊙ (Planck Collaboration XXVII 2016). The Meta-Catalogue of X-ray detected Clusters of galaxies (MCXC) by Piffaretti et al. (2011) also compiles A76 as MCXC J0040.0+0649 and estimates a radius and mass of R500 = 0.70 Mpc and M500 = 0.99 ⋅ 1014 M⊙, respectively. Finally, we mention that A76 was also detected in the Dark Energy Survey (DES), and in the Sloan Digital Sky Survey (SDSS) DR8 photometric data set, as galaxy overdensity (RMJ003956.0+065054.8) showing a M500 > 1014 M⊙.
Similarly, A1307 is a GC named RXCJ1132.8+1428 in the NORAS/REFLEX sample (Böhringer et al. 2000); MCXC J1132.8+1428 in the MCXC survey, showing a radius and mass R500 = 0.99 Mpc and M500 = 3.0 ⋅ 1014 M⊙, respectively; and PSZ2 G243.64+67.74 in the second Planck SZ source catalogue, with a MSZ = 3.9 ± 0.2 ⋅ 1014 M⊙. In addition, the optical follow-up of Planck SZ sources, performed by Aguado-Barahona et al. (2022) estimates a dynamical mass of M500 = 2.6 ± 0.5 ⋅ 1014 M⊙. This system has not been explored in detail in X-rays, however, Andreon (2016), analysing the galaxy component, suggests certain indications of bimodality.
A1307 is a CHEX-MATE1 target and has been recently observed by the XMM-Newton satellite. In this work, we present a detailed study based on new spectroscopic redshift observations in order to disentangle the dynamics of these two low-medium mass clusters and propose a coherent scenario in order to explain their X-ray emissions. With this aim in mind, we performed a detailed study of the mass profile and velocity anisotropy of the member galaxies in each cluster using the MG-MAMPOSSt code by Pizzuti et al. (2021). This method allowed us to jointly reconstruct the velocity anisotropy profile, β(r), and the cluster total mass profile, which is an excellent approach to obtain a realistic view of the galactic component behaviour of these systems, and compare it with the gas dynamics present in A76 and A1307.
This paper is organised as follows. In Sect. 2, we describe the new spectroscopic observations as well as the X-ray data. We analyse the optical and galaxy properties of A76 and A1307 in Sect. 3, and compare them with X-ray properties in Sect. 4. We present our estimation of the dynamical mass and a more detailed analysis on the mass profile and velocity anisotropy in Sects. 5 and 6, respectively, further discussing our findings in Sect. 7. We conclude this paper by summarising our results in Sect. 8.
In this paper, we assume a flat cosmology with Ωm = 0.3, ΩΛ = 0.7, and H0 = 70 h70 km s−1 kpc−1. Under this cosmology, 1 arcmin corresponds to 46 and  kpc at the redshift of A76 and A1307, at z = 0.0390 and 0.0815, respectively.
2 Data sample
2.1 Optical spectroscopy and photometry
Even though A76 and A1307 have been observed in X-ray, radio frequencies and broad-band optical photometry, the spec-troscopic information available in public databases and in the literature is not enough to perform a detailed study of their galactic component and dynamics. We find 55 spectroscopic red-shifts in the NASA/IPAC Extragalactic Database (NED) for A76, mainly obtained by Rines et al. (2016) using the Hectospec/MMT spectrograph as part of the HeCS-SZ survey. A1307 was spec-troscopycally sampled in the SDSS-DR16 survey, and we find 45 cluster members within a region of 11′ radius with respect to the centre of the cluster. Therefore, in June 2020 and September 2023, in order to extend these samples, we performed spectro-scopic observations at the 3.5 m Telescopio Nazionale Galileo (TNG) telescope, at Roque de los Muchachos Observatory (La Palma), using the DoLoRes multi-object spectrograph.
The multi-object spectroscopic (MOS) observations allows us to obtain a large number of redshifts in a short time and a limited field. Using this technique, we acquired spectroscopic redshifts covering a region of 27′ × 22′ of A76 and a likely circular field of 11′ radius in A1307. The A76 field was mapped using 12 MOS masks including more than 300 slitlets, obtaining good quality redshifts for 221 galaxy targets. Similarly, A1307 was covered with 5 masks containing about 140 slitlets and obtaining 121 spectra with good quality. The slitlets were placed in order to avoid the SDSS and NED redshift samples and so maximise the acquisition of new data. We used the DoLoRes spectrograph, installed in the 3.5 m TNG telescope, in low resolution observing mode with the (low resolution) LR-B grism2. Masks were manufactured with slits of 1.6″ width, which provides a dispersion of 2.75 Å per pixel between 370 and 800 nm of wavelength coverage. We acquired a single frame per mask, with 1200 s exposure time in A76 and 1800 s in A1307, respectively. We processed the spectra using standard IRAF packages and calibrated in wavelength using neon, mercury and helium arcs.
We estimated the spectroscopic redshift by correlating them with a set of templates retrieved from the Kennicutt Spectropho-tometric Atlas of Galaxies (Kennicutt 1992). We applied the technique detailed by Tonry & Davis (1979) and implemented as the task RVSAO.XCSAO in IRAF facility. This procedure detects and correlates the main features registered in the scientific spectra (i.e. the Ca H and K doublet, Hδ, G band, and MgI in absorption, and the OII, OIII doublet, and Hα and Hβ lines in emission) with those present in the template ones. The set of template spectra includes five galaxy morphologies (elliptical, Sa, Sb, Sc, and Irr types) in order to match properly the different shapes of scientific data. This procedure provides a radial velocity estimate and the corresponding correlation error for all spectra observed. We added to our sample the spectroscopic red-shift present in NED and SDSS-DR16 spectroscopic databases. Tables 1 and 2 (the full version of these tables are available electronically at CDS; here we only present a few lines as example of their contain) list the full spectroscopic samples in the A76 and A1307 fields, which compile 231 and 164 spectroscopic redshifts, respectively. The new spectra obtained with the TNG present a mean signal-to-noise ratio (S/N) of 9.5 and a mean error of 57 km s−1. We detected 78 and 32 star-forming galaxies in A76 and A1307 fields, respectively. These galaxies are characterised by the existence of [OII], [OIII] and/or Hα emission lines, that we are able to detect if they have equivalent widths >10 Å.
In the A76 field, we observed repeatedly fourteen galaxies in two different masks. Similarly, in the A1307 field, we acquired double spectra for eight targets. These double-redshift measurements allows us to obtain information about realistic errors (including systematic ones) relative to the redshift estimate procedure. We find a no significant difference, with values of 46 ± 185 km s−1 for spectra in the A76 field, and 42 ± 200 km s−1 in the field of A1307. In addition, comparing our redshift estimates with that retrieved from NED and SDSS database, we find a negligible mean difference of 7 ± 240 km s−1.
The spectroscopic sample is not fully complete. Comparing the photometric sample of likely galaxy members (see Sect. 3.3) with the spectroscopic one, we find that the completeness in the A76 field is about 40% in the central region of the cluster and decreases down to 10% for radii r ~ r200. Similarly, the spectroscopic completeness in A1307 is about 65% in the inner region, while this decreases down to 10% for radii r ~ r200.
Tables 1 and 2 list the spectroscopic redshifts considered in this work. Column 1 lists the ID number, whith cluster members marked with an asterisk. Cols. 2 and 3 include the equatorial coordinates of galaxies, RA and Dec in J2000 system; Col. 4, the heliocentric radial velocity (v = cz) and their errors (Δv); Cols. 5 and 6, the complementary ɡ′ and r’′ dered3 magnitudes obtained from SDSS DR16 photometric database; and a last column with some comments regarding particular features of some galaxies, such as the presence of ‘emission line galaxies’ (ELGs). Figure 1 shows the spatial distributions of these spectroscopic samples in the A76 and 1307 fields.
Since our spectroscopic samples are not complete, we also consider the publicly available photometry from SDSS DR12 archive, so complementing our redshift survey. We work with dered magnitudes ɡ′ and r′ retrieved within the same regions exposed in Sect. 2.1. In agreement with SDSS DR12 estimates4, we find that the mean depth (at ~90% completeness) of this photometry is r′ = 21.5.
Velocity catalogue of galaxies measured spectroscopically in the A76 field.
Velocity catalogue of galaxies measured spectroscopically in the A1307 field.
2.2 X-ray data
The XMM-Newton observations are publicly available in the archive, with IDs 0800760501 and 0827010801 for A76 and A1307 clusters, respectively. The A76 cluster was recently observed with an exposure time of 12 ks (Obs. ID: 0920010401; PI: L. Lovisari) as part of a follow-up of an X-ray selected sample of groups, while A1307 was observed during 27 ks as part of CHEX-MATE Cluster Heritage project (PIs: M. Arnaud and S. Ettori; Arnaud et al. 2021). Both acquisitions were carried out using the EPIC MOS camera in the 0.5–2 keV band. We reduce the X-ray images and spectroscopic data using the SAS v20.0 software closely following the technique described in Chon & Böhringer (2015). We remove hot pixels and subtract the background. The final images obtained are shown in Fig. 2.
A76 has a quite elongated shape along the east-west direction, and its brightness is very low, shallow and very clumpy. We find that the coordinates of the position of the global, diffuse X-ray emission, obtained by fitting five ellipses of semi-major axes from 4 to 8 arcmin, vary within a region of about 1.2 arcmin. With this large centre shift, we can conclude that the X-ray diffuse emission is very irregular and its centre is not well defined (see e.g. Böhringer et al. 2010; Campitiello et al. 2022). However, the brightest region is placed to the west part of the cluster, while the X-ray emission extends, like a tail, to the east.
A1307 presents, however, a much more compact and bright emission, with a single peak in the south which seems to be embedded in a larger south-north tail. The X-ray emissions of A76 and A1307 are about 0.7 and 1.3 Mpc large, respectively, along their most elongated directions. Campitiello et al. (2022) performed a morphological analysis of A1307 together with a sample of CHEX-MATE clusters. With a concentration parameter of c = 0.27 and a centre shift parameter of w = 0.038, A1307 is found as one of the most disturbed clusters in the sample (see also Fig. 1 in Lovisari et al. 2024). Furthermore, both clusters show a high central entropy, a very extreme value of 400 keV cm2 in the case of A76 (OTA13) and 136 ± 25 keV cm2 for A1307. This also characterises the clusters as disturbed.
For the spectral analysis we treated the sky background as composed by three main contributions when fitting the data using the XSPEC tool: the unresolved point sources, the Local Hot Bubble and a cool absorbed thermal model when fitting an APEC cluster model to the spectroscopic data.
3 Optical properties of A76 and A1307
3.1 Member selection and global properties
We analyse the kinematics of A76 and A1307 on the basis of the spectroscopic sample. The first step is to perform a good selection of member galaxies. One way to select cluster members is from the projected phase-space distribution of member galaxies (Wojtak 2013) under the assumption of dynamical equilibrium (Carlberg et al. 1997). This method allows us to identify cluster members from background and foreground galaxies. Nevertheless, this technique only offers guarantees for large spectroscopic samples, including typically 200 galaxies or even more. We apply this method to our sample, but we do not find reliable results. Consequently, in our study, we employed a similar and simplified technique based on the projected (r, cz) space. Our approach involves an iterative 2.7σv clipping in cz, assuming the radial profile of the expected velocity dispersion (Mamon et al. 2010). Initially, we determine the mean velocity of the cluster and compute a first velocity dispersion using the root mean square (rms) estimator. Through successive steps, we arrive at stable and converging values for  (mean velocity) and σv (velocity dispersion). This method yield a selection of 122 and 116 cluster members for A76 and A1307, respectively. So, discarding 2 and 3 foreground galaxies and 107 and 44 background galaxies in each field, respectively. Our cluster member selection compiles galaxies within the range 0.0337 < z < 0.0463 for A76 and 0.07 < z < 0.09 for A1307. Figure 3 shows the velocity histograms obtained from this cluster selection and the Gaussian velocity reconstruction according to the bi-weight method.
With the aim in mind of estimating a robust mean velocity and velocity dispersion, we apply two different methods, the root mean square (rms) and the bi-weight scale estimator (Beers et al. 1990). This last procedure provides more solid estimates with respect to the former for samples showing possible inho-mogeneities. Applying the bi-weight to our redshift samples of cluster members we obtain mean velocities  km s−1 and 24450 ± 94 km s−1, and velocity dispersion
  and
and  , for A76 and A1307, respectively. On the other hand, the rms estimate of the velocity dispersion yields a values of 669 ± 55 and 863 ± 42 km s−1 for A76 and A1307, respectively. Table 3 compiles these findings. The good agreement between the two σv estimates, even for the two clusters, makes evidence that there is no strong hints for inhomogeneities in the velocity distribution. However, in order to check possible deviations of σv from the mean along the cluster, we analyse in Sect. 3.2 the stability of this magnitude with the distance to the cluster centre (assumed as the BCG position).
A76 presents a bright cluster galaxy (BCG; ID 122), well centred with the X-ray central diffuse emission and coincident with a moderate central, a fact that OTA13 also observe using the X-ray Suzaku data. However, this bright galaxy, despite of showing a normal BCG properties, is not the brightest cluster member in optical bands. We find three other galaxy members, the IDs 54, 197 and 79 labelled as ‘2’, ‘3’ and ‘4’ in Fig. 4, even brighter than the BCG. Moreover, we identify a fifth galaxy member, the ID 193, labelled with a ‘5’ in Fig. 4, with a imilar magnitude to the BCG. All these four galaxies (the ‘2’, ‘3’, ‘4’ and ‘5’) present a more intense X-ray emission than that of the BCG, and show clear shifts with respect to the centre of the cluster, larger than 240 kpc in projected distance. None of these BCGs present emission lines in their optical spectra, so they are passive early-type galaxies showing no star formation or AGN activity. The X-ray halos around the BCGs show some extent, only the halo of BCG 4 is not resolved and could be a point source. The velocity distribution of these galaxies is also shown in Fig. 3. The BCG is quite well centred in the velocity distribution and the other brightest galaxies present large velocity offsets, even larger than 200 km s−1 . In summary, A76 presents a large accumulation of bright galaxies: a BCG, quite well centred in the velocity field and in the X-ray diffuse emission, and several other bright galaxies, outside the cluster core showing large velocity offsets.
A1307 also presents a clear BCG (the ID 84), coincident with the X-ray maximum emission of the cluster. In addition, there is a second bright galaxy (ID 79) placed at 3.2 arcmin (about 300 kpc in projected distance) towards the north. Therefore, the BCG and the galaxy ‘2’ follow a south-north alignment, in agreement with the south-north tail observed in the X-ray surface map. The radial velocity of the galaxy ‘2’ is, in practice, the same as the mean cluster velocity, as it is shown in Fig. 3.
We detect 78 and 32 galaxies that present emission lines, mainly [OII], in the A76 and A1307 fields, respectively. They are conveniently labelled as ‘ELG’ in Tables 1 and 2. The S/N and resolution of our spectra allow us to detect [OII] lines as far as they show equivalent width >10 Å. The presence of emission lines in the spectra is related to star-forming processes in galaxies. In A76, we find that 13 ELGs are cluster members, while in A1307, only four members present emission lines. This means that A76 shows a population with about 10% of galaxy members showing star formation, while in A1307, the star-forming galaxies only represent a fraction as low as 3.4%. The high galaxy density environments and hot intra-cluster medium (high TX) in clusters produce strong quenching effects in their galaxy population (Laganá et al. 2008). Therefore, A76 shows a typical low fraction of star-forming galaxies. However, this fraction is especially low in A1307, so we can infer that the whole galaxy population with star formation has been dramatically quenched in this system.
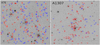 |
Fig. 1 Spectroscopic sample of galaxy targets considered in this work in the A76 and A1306 fields, superimposed to SDSS r-band images. Red and blue squares correspond to the cluster member and non-member galaxies, respectively. The numbers mark the brightest galaxies as explained in the text. |
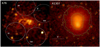 |
Fig. 2 XMM-Newton images of the clusters A76 and A1307 in the 0.5 to 2 keV energy band. The images have been smoothed with a 7 pixels box size in order to reduce the noise. Green contours correspond to 8, 15 and 20-σ detection levels in A76 panel, while A1307 contours match with 6, 30 and 90-σ detections. The circle SE in the A76 frame indicates the subcluster at the south-east detected by OTA13 in the XMM-Newton observations. We perform a comparative analysis of the diffuse signal from regions labelled as SE, SW, NE and NW in Sect. 4. Dotted lines in the A1307 frame demarcate the two hemispheric regions, north and south, analysed in this work. In both frames, north is up and east is to the left. |
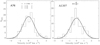 |
Fig. 3 Velocity histograms of galaxy members in the cluster rest frame. The Gaussian curves represent the reconstruction of the velocity distribution according to the biweight method. The velocity corresponding to the BCG, and other luminous galaxies are labelled as ‘BCG’, ‘2’, ‘3’, ‘4’ and ‘5’. |
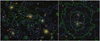 |
Fig. 4 Colour image obtained from the DR9 Legacy Survey of A76 (left) and A1307 (right). Superimposed, we plot contours corresponding to the X-ray surface brightness (green) and the isodensity galaxy distribution of likely cluster members (grey-blue). The BCG, ‘2’, ‘3’, ‘4’ and ‘5’ labels indicate the central bright cluster galaxy, and the other luminous galaxies. North is up and east to the left in both panels. |
Positions and global properties of A76 and A1307.
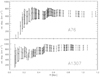 |
Fig. 5 Variation of the line-of-sight velocity dispersion, in the cluster rest frame, with the cluster-centric distance. The cluster centre is assumed to be the BCG position. The velocity dispersion values are computed using the bi-weight estimator and considering all galaxy members enclosed in that radius. The first value is calculated from the first five galaxies closest to the centre. The error bars are at the 68% confidence level. |
3.2 Velocity field
In general, deviations of the global velocity distribution with respect to the Gaussian profile are usually good indicators that the internal dynamics of clusters is not relaxed, or may even warn of the presence of substructure (see e.g. de Carvalho et al. 2017; Ribeiro et al. 2011). In this sense, the skewness and kur-tosis are appropriate measures to evaluate the departure from gaussianty. The skewness is related with the asymmetry of the velocity distribution, while the kurtosis indicates distributions showing thinner or fatter tails. Our samples present a skewness of 0.05 ± 0.17 and −0.11 ± 0.16 in A76 and A1307, respectively. Similarly, we find a kurtosis of −0.07 ± 0.26 and 0.10 ± 0.25 in both cluster member samples. Errors were computed from the standard deviation of the values obtained after performing a Markov chain Monte Carlo (MCMC) method with 10 000 simulations assuming a Gaussian profile with an average centre equal to zero and a standard deviation equal to one, sampled with 122 and 116 points for each cluster sample, respectively. So, in our case, the skewness and kurtosis are compatible with zero, which mean that the global velocity distribution of A76 and A1307 are quite symmetric, following a quite regular Gaussian profile, which suggests that both clusters are not dramatically disturbed and with no clear evidence of the presence of substructure.
Figure 5 shows the integral σv variation as radial profile for A76 and A1307, respectively. In the case of A76, the σv profile remains stable beyond 0.2 Mpc. However, it is worth noting the pronounced drop in values in the innermost part of the cluster, where the σv takes values even lower than 200 km s−1, probably typical values of the internal velocity dispersion of the BCG. The profile of the σv variation in A1307 is completely different. The σv in A1307 is quite flat over the whole cluster but it shows a differential behaviour in the inner part with respect to the external region. In fact, when we compute the σv considering only members at radii r < 0.47 Mpc, we find 745 ± 118 km s−1. On the contrary, the σv for cluster members in the external region r > 0.47 Mpc is 827 ± 81 km s−1. This small difference, at 1-σ level discrepancy, between inner and outer velocity dispersion may suggest that the dynamics of the cluster could be different in the inner part with respect to the regions at r ≳ 0.5 Mpc. We analyse this in detail in following sections.
Another parameter commonly used to establish whether a galaxy cluster may present a disturbed dynamical state is the offset between the BCG peculiar velocity and the average cluster velocity. However, as it is shown in Fig. 3, in both A76 and A1307 the BCG velocity offset is very small, of about 110 km s−1 in both cluster, which indicates that both clusters do not present significant signs of unrelaxation in this respect, which agrees with the fact that the global velocity distributions present likely Gaussian shapes.
3.3 Two-dimensional galaxy distribution
In practice, spectroscopic observations cover the galaxy population of the whole clusters partly, not only due to the spatial incompleteness of the sample, but also because the spectroscopic observations miss the faintest galaxies. So, in order to get information of the distribution of a more complete galaxy member sample, we use the SDSS photometric database, data release 16 (DR16). Using the 𝑔′ and r’′ dered magnitudes (which are corrected by reddening), we build the (𝑔′ − r′ vs r′) colour-magnitude diagramme (CMD). This technique allows us to obtain likely galaxy members by selecting galaxies within the red sequence (RS) locus. From this diagrammes we measure RS of 𝑔′ − r′ = −0.028(±0.004) × r′ + 1.37(±0.07) and 𝑔′ − r′ = −0.031(±0.001) × r′ + 1.31(±0.02) for A76 and A1307, respectively. We select likely early-type members as galaxies showing colours with upper limit 𝑔′ − r′ <RS+3 ⋅ rms and late-type galaxies with 𝑔′ − r′ > −0.054 ⋅ r′ + 1.212 for the A76 field. Similarly, for A1307, we select likely members that galaxies showing 𝑔′ − r′ <RS+3 ⋅ rms and 𝑔′ − r′ > −0.1509 ⋅ r′ + 3.013. In both cases, we impose the restriction r′ < 22.5, which is the magnitude limit of the photometric sample. This selection criteria provide 2105 likely members in a region of 30′ × 50′ in the A76 field and 1109 likely members in a circular region of 12′ radius in the A1307 field.
We use these photometric samples in order to investigate the galaxy distribution of A76 and A1307. With this aim in mind, we construct the isodensity galaxy maps shown in Fig. 4 (grey-blue contours). These maps were obtained by quantifying the contribution of 2105 and 1109 small Gaussians with σ = 1 arcsec width, placed at the positions of the likely members, over a grid of 200 × 200 points. The contour maps obtained reveal two very different configurations. While A76 shows a very spread galaxy density, that of A1307 is quite compact. The 2D galaxy distribution of A76 shows several peaks, but none of them are centred on the BCG. We detect one galaxy concentration 5 arcmin to the south of the BCG and a secondary overdensity around the BCG-4, but slightly shiftted to the south-west. In fact, none of the five brightest galaxies shows high galaxy density around, with the exception of the BCG-4, that shows a quite irregular and elongated galaxy overdensity around it. The case of A1307 is much more regular. The galaxy distribution of A1307 reveals a double-peaked distribution clearly elongated in the south-north direction. The highest galaxy density is around the main BCG, while the secondary peak is well centred on the BGC-2 position.
From the analysis above, we can conclude that the galaxy distribution of A76 is very shallow while that of A1307 is compact and elongated in the south-north direction. This means that both A76 and A1307 present a galaxy distributions and X-ray surface brightness profiles that are almost coincident. As we have shown in Sect. 2.2, The X-ray emission of A76 is quite weak, shallow and clumpy, in agreement with its 2D galaxy density distribution. Similarly, A1307 presents a compact X-ray emission, with a peak centred in the BCG and elongated in the south-north direction. So, the X-ray configuration perfectly match the galaxy component of A1307.
3.4 Analyse of substructures
The 1D (velocity) analyses reveals that velocity distributions of galaxy members in A76 and A1307 follow an almost Gaussian profiles, which is confirmed by the values obtained for skewness and kurtosis (see Sect. 3.2). Moreover, to provide an additional assessment of the dynamical state of the clusters, we compute the Anderson-Darling coefficient A2 (Anderson & Darling 1954), which measures departures from Gaussianity of the line-of-sight velocity distribution. As described in Pizzuti et al. (2020), A2 is a good indicator of the systematic effects induced by lack of dynamical relaxation. We found A2 = 0.38 for Abell 76 and A2 = 0.56 for Abell 1307, which suggests that the former could be in a more relaxed dynamical state. However, the significance level is large for both clusters, α > 0.15, indicating that the null hypothesis of an underlying Gaussian distribution cannot be rejected at high confidence. Therefore, additional assessments are needed to better investigate the morphological properties of these clusters.
In order to check the presence of galaxy clumps with their own kinematical entity, we apply several other tests in the 3D (spatial and velocity) space. In the past decades, numerous techniques have been proposed to determine the presence of substructures within clusters. These procedures are usually based on the positions and velocities (3D space) of individual galaxy members, so analysing possible space-velocity segregation. To this aim, one of the most used algorithm is the Dressler & Schectman (DS) test (Dressler & Schectman 1988), which search for galaxy clumps whose mean velocities and/or dispersion deviate from the global cluster values. We apply this procedure to our samples by running 1000 Monte Carlo simulations. Figure 6 shows the δ-statistics test over the inner and best sampled region. For both A76 and A1307 clusters, we obtain similar results. The clusters have clear main bodies that dominate their respective central regions (red squares in Fig. 6) with several galaxies in their outskirts showing larger deviations (blue squares in Fig. 6). A76 shows deviations towards the north-east and south-west, almost coincident with the elongation present in the X-ray surface brightness map. Similarly, A1307 shows some galaxy members with not negligible deviations in the north and south edge of the cluster, also following the direction of the X-ray emission profile. However, in the case of A1307, the low number of members with high deviations in the external zone of the cluster suggests that these few galaxies present decoupled kinematics that are now slowly falling onto the cluster core. We find a mean deviation < δi >= 4.09 and 6.3 for A76 and A1307, respectively, a cumulative deviations of Σi δi = 41.6 and 726.5. The likelihood ratio test statistic is 30.14% and 57.03%, with a p-values of 0.036 and 0.00, for this statistics applied to the A76 and A1307 samples, respectively. In summary, the results here obtained put on the table the possibility that A76 presents a heterogeneous kinematics characterised by a central main body, which includes the BCG and BCG-5 with galaxies around them, and external clumps, slightly decoupled from the main kinematics of the cluster, that includes galaxy clumps dominated by the BCG-2, BCG-3 and BCG-4. On the contrary, A1307 presents a more homogeneous kinematics made up of a single galaxy clump, which are dominated by the BCG and the BCG-2.
We perform a second test in order to investigate possible space-velocity correlations. This test consists of analysing the presence of velocity gradients. With this purpose in mind we fit a plane to the full cluster member samples. For A76, we obtain the expression Δv = −7.95x+8.77y-38.88, and for A1307 we obtain Δv = −22.50x+7.33y-4.68; where x and y correspond to the positions of the galaxies following the R.A. and Dec. coordinates (positive values are taken towards the north and west directions), in arcmin, with respect to the BCG. The plane corresponding to the A76 cluster sample shows a maximum gradient of 65(±184) km s−1 Mpc−1 in a 42°(±4º) angle (anticlockwise, from north to west; Δv takes positive values towards the northeast). Similarly, the best plane fit obtained for A1307 presents a maximum gradient of 260(±310) km s−1 Mpc−1 in a 72°(±8°) angle, which means that Δv takes higher values towards the west of the cluster. Therefore, as it is shown in Fig. 6, despite that the velocity gradients do not take very significant values (errors are large in comparison with the gradient obtained), we observe that A76 presents a maximum velocity gradient almost coincident with the elongation of X-ray surface brightness. On the contrary, A1307 shows a maximum gradient in the ENE-WSW direction, so almost perpendicular to the X-ray surface brightness profile.
A third test (also in the 3D space, that is, positions and velocity) has been further performed in order to identify possible substructures. We use a 3D version of the Kaye’s Mixture Model (KMM) algorithm (Ashman et al. 1994) to associate individual galaxies to each substructure. This procedure provides a probability that a given galaxy belongs to different galaxy clumps. The KMM needs an input configuration, so we run the algorithm in two different ways. Given that we have not been able to identify any subcluster, first we use 100 lists of galaxies randomly associated to two clumps, and we run the algorithm 100 times. This method does not provide consistent results, neither for A76 nor for A1307. The results obtained are not stable and we only obtain divergent solutions, without any reliable identification of substructures. Then, we run KMM in a second way, by starting with a single input list of galaxies including two separate and well defined clumps: one containing galaxies showing high δi deviations and a second clump with galaxies showing low δi. That is, two input populations defined by blue and red members in Fig. 6. Again, the result obtained is not reliable, because the output probabilities assigned to the galaxies with high δi are even lower than 90%, which are not acceptable values (high confidence values would be output probabilities higher than 95–98%). Thus, the KMM test does not provide conclusive proofs of the existence of substructure in either A76 or A1307.
Finally, we employed the DS+ algorithm (Benavides et al. 2023), an extension of the DS method based on the projected phase space of position and line-of-sight velocities, which identifies substructures and estimates the probability of each galaxy to belong to a given sub-group. As for the DS case, we run 1000 Monte Carlo samplings and we consider as reliable substructures those for which the estimated p-value is ≲0.01. This test revealed that only 22% of the galaxies of A76 may configure six groups within the cluster, four of which made up of three galaxies, one with six galaxies and one with nine. In the case of A1307, the only 15% of members compose four sub-groups, two with three members, and two with six galaxies. These results reveal that A76 is mostly configured by small groups that contain very few members, without any important entity by themselves. Similarly, A1307 contains even less substructures and even poorer than A76. In Fig. 7, we show the spatial distribution of the member galaxies in both clusters with the substructures identified by DS+ marked in various colours.
In summary, the outcome of 1D and 3D tests, the overall structure of A1307 seems to be slightly more regular with respect to that of A76. Both clusters show very weak hints of presenting substructure, that are very poor and no massive at any time, as also indicated by the analysis of the X-ray features, as described in the next Section.
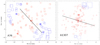 |
Fig. 6 Spatial distribution of the cluster members, marked with squares and a size proportional to exp(δi) computed using the δi deviations obtained with the DS test. Red and blue correspond respectively to galaxies with lower and higher δi deviations from the mean, < δi >. The large black lines represent the directions of the velocity gradients in each cluster region. Crosses indicate the BCGs positions in each cluster. |
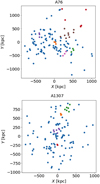 |
Fig. 7 Projected positions of the cluster members (blue) in A76 (top) and A1307 (bottom) fields, where we have marked using other different colours the substructures identified by the DS+ algorithm. |
4 X-ray properties
A76 has been extensively studied by OTA13. They measured global temperature and metal abundance and find a TX =3.3 keV and 0.24 solar, respectively. They also find an extremely high entropy (about 400 keV cm2) in the core of the cluster, within r < 0.2r200, a fact that cannot be easily attributed by either gravitational heating or preheating. OTA13 examine the Suzaku observations in very much detail and conclude that X-ray morphology is clumped and irregular, and the electron density is extremely low (10−4−10−3) for the observed high temperature. So, they affirm that A76 is in an the early phase of formation, and the gas content of A76 is now suffering a delayed relaxation after a recent gas heating due to a gravitational potential confinement.
Beside the Suzaku observations, OTA13 also analysed the X-ray data obtained with the XMM-Newton satellite. From these data, they identify a relevant blob (see Fig. 1b in OTA13) towards the south-east of the cluster core (see left panel of Fig. 2), which they attribute to a likely group-scale system that has undergone gas heating in the cluster potential. However, the signal that we detect in this region in the XMM-Newton data is very weak. In fact, comparing the signal in the southern regions (SE and SW) with the northern regions (NE and NW) marked in Fig. 2, we find that the northern areas have an average signal at the background level, while the southern regions are at 4- (SE) and 2.5−σ (SW) above the background. In addition, we do not detect any isolated emission peak coming from any clump within the SE region.
Assuming the global temperature provided by OTA13, TX = 3.3 keV, and the temperature-mass and temperature-radius relations by Arnaud et al. (2005) (see Table 2 therein), we estimate a total mass of M500 = 1.9 ± 0.1 · 1014 M⊙ within a r500 = 0.61 ± 0.02 Mpc. We will use these values in Sect. 5 to contrast them with those obtained from the dynamical studies of A76. However, we anticipate here that we obtain a dynamic mass slightly lower than that obtained from the X-ray for relaxed clusters. Therefore, from this discrepancy we can infer that A76 shows some hints of a non-relaxed dynamical state. We will discuss this argument in detail in the following sections.
A1307 shows a clear north-south asymmetry. The surface brightness is steeper in the south and flatter in the north. Therefore, one may perfectly interpret the morphology of A1307 as that of a symmetric, round cluster, which seems undisturbed in the south, but superposed by extended substructure in the north. The centre of the undisturbed main component is in this picture the X-ray peak, which is also coincident with the BCG position. So, under the X-ray point of view, both A76 and A1307 clusters appear unrelaxed; A1307 in a state of a recent minor merger and A76 in an early stage of formation. In addition, we do not detect any evidence of shocks and cold fronts in the X-ray images, which could be taken as an indication that we are now witnessing a later phase of minor merger events in both clusters. We estimate a global X-ray temperature of about 4.3 keV, which is a lower value than that obtained by Lovisari et al. (2024), 4.9 keV. However, we want to remark that Lovisari et al. uses a different approach to determine the temperature attempting to correct for temperature variations by constructing temperature profiles from two-dimensional temperature maps giving specific weights to each pixel and excluding pixels with extreme values.
We obtain X-ray surface brightness profiles after removing the X-ray sky contribution and instrumental background. We fit the profiles with β- and double β-models. However, we find that single β-models provide a good fit to the outer parts of the profiles, from which we determine the gas density and gas mass profiles. Only for the southern part of A1307 the double β-model provides an interesting alternative. The fit parameters for the profiles are given in Table 4. The magnitudes M500 and M𝑔as are total and gas mass inside r500 radius. The parameter f𝑔as is the gas mass fraction of the total mass, r500 is the radius projected in the sky, LX is the total X-ray luminosity in the [0.5–2.0] keV band, M500(Lx) is the mass estimated from the Lx–M relation, TX is the measured X-ray temperature, also inside r500, rc is the core radius, and β is the slope parameter of the electron density profile.
The intra-cluster medium (ICM) temperature was determined from the X-ray spectra after subtracting the background contribution. We estimate the temperature in eight and seven concentric radial bins in the north and south hemispheres, respectively. These bins were constructed in order to have a minimum number of 2000 photons per bin. The resulting temperature profile is shown in Fig. 8. The outer temperature profile of the southern region can be approximated by a polytropic model with a γ parameter of 1.8. Similarly, the northern region is fitted with a γ = 1.2. We also assume the Eq. (4) of Vikhlinin et al. (2006) to approximate the temperature profile. In this formula we discard the part describing the central temperature decrease, which allows for a cool-core and not so relevant for A1307. The equation applied thus has the following form:
 (1)
(1)
A plausible way to estimate the total cluster mass can be based on the gas-mass distribution. From the surface brightness profiles, we find gas masses inside the southern and northern parts of M500 = 1.5 · 1013 and M500 = 2.25 · 1013 M⊙, respectively, taking the mass only for each hemisphere. Adopting the assumption mentioned above, that the southern part of the cluster provides an impression of the undisturbed main cluster component, we find that the north hemisphere contributes with an additional gas mass of the order of 0.75 · 1013 M⊙, which is about 25% of that of the main cluster component. This leads to a total mass estimate of M500 = 2.2 · 1014 M⊙ plus 25% resulting in M500 ~ 2.75 · 1014 M⊙. We have taken the gas masses here to estimate the mass ratio of the two cluster components, since the gas mass can be obtained relatively straightforward from the surface brightness profiles and the geometry. The same exercise with the total mass would also include the assumption of hydrostatic equilibrium, which is certainly not clearly observed in this case. From this result, we may conclude that we observe an ongoing merger with a mass ratio of about 1:8.
For the X-ray luminosity of A1307, in the [0.5–2] keV energy band we obtain a value of LX,500 = 6.2 and 7.4 · 1043 erg s−1 in the southern and northern regions, respectively. Based on the mass-luminosity relation proposed by Pratt et al. (2009), we expect a total cluster mass of about M500 = 2–3 · 1014 M⊙. On the other hand, using the M-T relation by Arnaud et al. (2005), for a X-ray temperature of 4.3 keV we estimate a total mass of about M500 = 2.9 · 1014 M⊙ inside r500. Although the mass obtained from the X-ray luminosity and temperature (to a lesser extent) of the ICM for cases of more relaxed clusters are in quite good agreement, it is safer to use the gas mass and the very possible assumption that the ratio between the total mass and the gas mass is roughly constant.
X-ray properties of A1307.
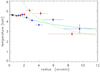 |
Fig. 8 Temperature profiles of A1307 fitted by a polytropic model. The temperature profile of the southern hemisphere is shown by the red and that of the northern hemisphere by blue data points. The lines show the fits of polytropic models: solid line (north) and dashed line (south), where for the latter only the outer part of the profile was fitted. |
5 Dynamical mass
As has been argued previously, both A76 and A1307 are galaxy clusters showing some hints of dynamical unrelaxation. A76 shows a shallow, elongated and clumpy X-ray surface brightness, which coincides with a very spread spatial galaxy distribution and a high number of bright galaxies. On the other hand, A1307 presents a more compact and bright X-ray emission, showing a clear asymmetry in the south-north direction. However, both galaxy clusters present a very Gaussian velocity distribution (see also Sect. 6). In addition, several kinematical testing do not find evidences of clear substructures.
Due to all these facts, we can assert that the interpretation of the dynamical state of A76 and A1307 depends a lot of the adopted point of view. That is, if one only considers the X-ray profiles (elongated shapes, moderate-high Tx and entropies) and forgets optical data, the clusters may be considered quite far from equilibrium. On the contrary, if one considers only optical data (mainly Gaussian velocity distributions, none important substructures detected, none BCG velocity offsets, no significant velocity gradients or anisotropies), the clusters are very close to the dynamical equilibrium. So, in order avoid a biased interpretation, we can only affirm that, despite the gas of the clusters can be disturbed, the galactic component is quite relaxed. In this scenario, it is possible to estimate virial dynamical masses and radii, and compute the dynamical masses of the whole clusters.
Galaxies are tracers of the total gravitational potential of a cluster, so their velocities can be used for estimating the dynamical mass of galaxy systems. Therefore, by utilising the velocity dispersion, σv, and its correlation with the virial mass, M200, we estimate the dynamical mass of A76 and A1307. Scaling relations represent a frequently used method for estimating the dynamical masses of clusters based on their velocity dispersion. Important contributions in this sense have been the relations proposed by Evrard et al. (2008), Saro et al. (2013) or Munari et al. (2013). However, we assume that found by Ferragamo et al. (2020), see Eq. (2). This last σv–M200 relation is based and calibrated on Munari et al. (2013) simulations, which considers dark matter particles and subhalos, galaxies, and AGN feedback, but goes further: Ferragamo et al. (2020) relation also takes into account the physical and statistical effects in samples including small numbers of galaxy members.
![Mathematical equation: ${{{\sigma _{\rm{v}}}} \over {{\rm{km}}\,\,{{\rm{s}}^{ - 1}}}} = {\rm{A}}{\left[ {{{h(z){{\rm{M}}_{200}}} \over {{{10}^{15}}{{\rm{M}}_ \odot }}}} \right]^\alpha },$](/articles/aa/full_html/2024/11/aa51144-24/aa51144-24-eq17.png) (2)
(2)
where σv is the observed velocity dispersion within a sphere of radius r200, and A and α are parameters fitted using Munari et al. (2013) simulations, which take values of A= 1177 km s−1 and α = 0.364.
Following this method, we find dynamical masses of M200 = 1.8 ± 0.6 · 1014 M⊙ and 4.3 ± 1.2 · 1014 M⊙ for A76 and A1307, respectively. To compare these values with those derived from X-ray emission we convert M200 into M500 following the relation given by Duffy et al. (2008). That is, we rescale M500 from M200 assuming a concentration parameter c200 = 4, an appropriate value for clusters at z < 0.1 and masses of M200 ~ 1014 M⊙, integrating a Navarro-Frenk-White (NFW) profile (Navarro et al. 1997) and interpolating to obtain M500. In this way, we obtain, M500 = 1.1 ± 0.3 · 1014 M⊙ and 2.7 ± 0.7 · 1014 M⊙ for A76 and A1307, respectively. Table 3 compiles these findings, some of them already advanced in Sect. 3.2.
We can also determine the quasi-virialised regions by estimating the virial radius of each galaxy system. The radius of this region can be obtained as that of a sphere with mass M200 where the mass density is 200 times the critical mass density of the Universe at the redshift of the system, 200 ρc(z). So,  , and following this expression, we obtain r200 = 1.2 ± 0.2 and
  Mpc for A76 and A1307, respectively (see Table 3). It is important to note that, while we find an excellent agreement between the total dynamical mass and the mass obtained from X-ray emission for A1307, this comparison for A76 reveals a difference of about 70%. We will discuss the origin of this discrepancy in Sect. 7.
6 Mass profiles and velocity anisotropy with MG-MAMPOSST
In the following, we present a more detailed reconstruction of the total mass profiles M(r) and the velocity anisotropy profiles β(r) of A1307 and A76 using data of velocities and projected positions of member galaxies. We perform a Bayesian analysis by means of MG-MAMPOSST by Pizzuti et al. (2023a), a code for kinematic analyses of galaxy clusters based on the MAMPOSST (Modelling Anisotropy and Mass Profile of Spherical Observed Systems) method of Mamon et al. (2013). These algorithms simultaneously estimates the (total) gravitational potential and the orbit anisotropy profile of clusters assuming spherical symmetric and dynamical relaxation. They are based on the Jeans’ equation:
 (3)
(3)
where ν(r) is the number density profile of galaxies,  is the velocity dispersion along the radial direction and Φ is the total gravitational potential-related to the mass profile as dΦ(r)/dr = GM(r)/r2, being G the gravitational constant. The anisotropy is defined as
  , where
  and
and  are the velocity dispersion components along the tangential and azimuthal directions, respectively. In spherical symmetry we have
  and the expression of the anisotropy profile simplifies to
  .
.
MAMPOSST (and MG-MAMPOSST) takes as input parametric expressions of the gravitational potential, the number density profile and the velocity anisotropy profile; by applying a Maximum Likelihood technique it determines the best set of parameters which describe the line-of-sight velocity distribution and projected positions of cluster member galaxies. The codes also require an assumption on the shape of the three-dimensional velocity distribution of the system. In our current implementation, a Gaussian model is used; however Mamon et al. (2013) showed that MAMPOSST works quite well also for non-Gaussian distributions. MG-MAMPOSST extends the available models in MAMPOSST, including new parametrisations of the gravitational potential in general modified gravity and possible dark energy scenarios (see Pizzuti et al. 2021 for a description of the physics) as well as quite the generic ansatz for the anisotropy profiles.
For both clusters, we consider the distribution of member galaxies in the projected phase-space (R(i), vz,(i)) − p.p.s. hereafter – where R(i) is the projected position of the i-th galaxy with respect to the centre of the cluster, assumed as the BCG position, also coincident with the X-ray peak of emission. vz,(i)) indicates the velocity measured along the line of sight, in the rest-frame of the cluster.
In the top panel of Figure 9 we show the p.p.s. of A76, on the left, and A1307 on the right. The vertical dashed line indicates the estimated value of r200 discussed in the previous section. In the MG-MAMPOSSt fit we consider only members up to Rup = r200 to ensure the validity of the Jeans equation; this will exclude a few galaxies in A76 (blue points). We have nevertheless checked that changing the values of Rup leads to negligible modification to the final results. In the case of A1307, all the observed members are within ~ 0.7 r200.
We further exclude the innermost region R < 0.05 Mpc, where the kinematics is dominated by the BCG. Our final sample consists of 112 galaxies for A1307 and 113 galaxies for A76.
Finally, we reconstruct the projected number density profiles of both cluster by fitting the projected space distribution {Ri} with the a projected Navarro–Frenk–White (pNFW) and a projected Hernquist (pHer) model. We implement the Maximum Likelihood method of Sarazin (1980), which does not require the binning of data. Moreover, we assign at each member galaxy position a weight which is given by the inverse of the completeness at that radius (see Section 2)
We find a slight, statistically irrelevant, preference for the pHer model over the pNFW for both cluster, with a ∆BIC < 15 We obtain
 (4)
(4)
for A76 and
 (5)
(5)
for A1307. In both cases, the uncertainties are given at 95% C.L. To assess the effect induced by a change in the value of the number density scale radius, we consider in the MG-MAMPOSST rν as a free parameter assuming flat priors within the 2σ limits obtained by the Maximum Likelihood analysis. In both cases, we consider four approaches for the total mass profile, namely the NFW model:
 (6)
(6)
where, as before, ![Mathematical equation: ${{\rm{M}}_{200}} = \left[ {100H{{(z)}^2}/G} \right]r_{200}^3$](/articles/aa/full_html/2024/11/aa51144-24/aa51144-24-eq29.png) is the mass at r200, rs = r−2 is the scale radius at which the logarithmic slope of the density equals −2, and c200 = r200/r−2 is the concentration.
is the mass at r200, rs = r−2 is the scale radius at which the logarithmic slope of the density equals −2, and c200 = r200/r−2 is the concentration.
The Burkert profile Burkert (1995) is
 (7)
(7)
with rs ≃ 2/3r−2, and
![Mathematical equation: $f(x) = \left\{ {\ln \left[ {1 + {x^2}} \right] + 2\ln (1 + x) - 2\arctan (x)} \right\}.$](/articles/aa/full_html/2024/11/aa51144-24/aa51144-24-eq31.png) (8)
(8)
On the other hand, the Hernquist model Hernquist (1990) is also defined as
 (9)
(9)
where rs = 2r−2. While the Einasto model Einasto (1965) follows the expression:
![Mathematical equation: ${{\rm{M}}_{{\rm{Ein}}}}(r) = {{\rm{M}}_{200}}{{{\cal P}\left[ {3n,2n{{\left( {r/{r_{\rm{s}}}} \right)}^{1/n}}} \right]} \over {{\cal P}\left[ {3n,2n{{\left( {{r_{200}}/{r_{\rm{s}}}} \right)}^{1/n}}} \right]}},$](/articles/aa/full_html/2024/11/aa51144-24/aa51144-24-eq33.png) (10)
(10)
where 𝒫(α, z) = γ(α, z)/Γ(α) is the regularised incomplete gamma function and rs = r−2. The exponent n is assumed to be n = 5, which has been shown to be a typical value for cluster-size halos in cosmological simulations (e.g. Mamon et al. 2010).
As for the velocity anisotropy, we consider a generalised Tiret (gT) model (see e.g. Mamon et al. 2019; Biviano et al. 2023),
 (11)
(11)
where β0 and β∞ are the values of the central anisotropy and of the anisotropy at infinity, respectively. rβ is a scale radius which is assumed to be equal to the radius r−2 of the mass profile (Tied Anisotropy Number Density; Mamon et al. 2010). In MG-MAMPOSST, we consider as parameters for the anisotropy profile the quantities 𝒜X = (1 − βX)−1/2, which represent the ratios between radial and tangential velocity dispersion.
We explore the parameter space (r200, rν, rs, 𝒜0, 𝒜∞) with a Markov-Chain Monte Carlo (MCMC) over 105 points for both clusters for the models mentioned above. The best fit parameters with the 95% confidence level uncertainties are displayed in Table 5 for A76 and A1307. In all cases, a generalised Tiret (gT) profile has been adopted for the velocity anisotropy, and uncertainties are given at 2σ level.
We find that all the best fit mass profiles are statistically comparable, with no strong evidence for a preferred ansatz. We thus choose as a reference the NFW model with a pHer for the number density profile (NFW+pHer). The NFW mass distribution as a function of the radius is shown in Figure 10 for A76 (top) and A1307 (bottom).
We quote, at 68% confidence level,
 (12)
(12)
which correspond to a mass
 (13)
(13)
Figure 11 further displays the posterior marginalised distribution of M200 for the different mass models analysed assuming a pHer profile for the number density. The curves are overall in good agreement, with the Burkert model showing the largest uncertainties.
We note that values of M200 are larger than what we find from the dynamical mass-velocity dispersion relation, Eq. (2); in order to compare with the X-ray luminosity, we can compute M500 directly from the NFW best fit profile. We obtain, at 1σ,  for A76 and
  for A1307. Surprisingly, the results of the MG-MAMPOSST fit show a better agreement with the X-ray estimate of A76 rather than for A1307, even if the value are still in agreement within 1σ. The masses inferred with MG-MAMPOSST are further reported in Table 3.
The radial profiles for the velocity anisotropy are shown in Figure 12; given the large uncertainties one can only state a qualitative behaviour of the orbits for the two clusters. In particular, A76 seems to slightly favour more radial orbits towards the whole cluster range, while the best fit of A1307 is in agreement with fully isotropic orbits down to the very cluster centre.
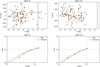 |
Fig. 9 Projected phase spaces of Abell 76 (top left) and Abell 1307 (top right). The vertical dotted lines represent the estimated r200 derived from the dynamical analyses. Bottom panels display the corresponding (projected) number density profiles (blue stars with error bars). The green and orange solid curves represent the best-fit profiles for a projected Hernquist and projected NFW models, respectively. |
Results of different mass and number density models ansatz for the cluster A76 and A1307.
7 Explaining optical and X-ray properties
From the analyses of the X-ray data (see Sect. 2.2), A76 shows a very elongated configuration, very shallow and extended in the east-west direction, with moderate individual peaks on each of its five brightest galaxies, making its X-ray quite clumpy. The elongated X-ray emission and 2D galaxy distribution in A76 suggest that its dynamical state is not completely relaxed. However, after applying several tests on the velocities and positions of the optical and X-ray emission, we have not been able to identify any clear subcluster as responsible of a merge event. Beside the BCG, we identify up to four bright galaxies more that could be associated to small galaxy groups. One or several recent minor mergers of these groups could be the responsible mechanism of the so clumpy and elongated X-ray emission in the E-W direction. We find that M500 derived from X-ray temperature, is about 1.9 · 1014 M⊙, in agreement with the MG-MAMPOSST analysis but slightly higher value than we found for the dynamical mass, M500,dyn ~ 1.1 · 1014 M⊙. A plausible explanation is that the TX is somehow enhanced, maybe due to the geometry of the three-dimensional gas distribution or, as it is also pointed out by OTA13, due to recent minor mergers, that could disturb the dynamical state of the cluster. In a similar way, the clumpy distribution of galaxies can bias the mass estimation based on MG-MAMPOSST.
A1307 presents a more regular scenario where X-ray emission is more compact. However, the X-ray surface brightness presents a clear elongation following the S–N direction, almost perpendicular to the velocity gradient. On the other hand, M500,X, derived from X-ray luminosity and temperature, fits quite well with the dynamical mass. Only, the elongation of the X-ray emission and 2D galaxy density distribution suggests that the dynamical state of A1307 may be associated to minor merger event in the recent past of the cluster. Moreover, the mass profile obtained with the MG-MAMPOSST fit seems to prefer larger values of M200 with respect to the dynamical and X-ray estimations. However, it is important to remark that this fact could be related to the unknown three-dimensional shape and the direction of the ellipsoidal axes of the cluster. Indeed, as shown in, for example, Mamon et al. (2013) and Pizzuti et al. (2020), MAM-POSST tends to overestimate the total mass when the line of sight is aligned with the major axis of a cluster; in addition, we note that the p.p.s of A1307 covers only up to R ~ 0.7 r200, which can produce biases in the MG-MAMPOSST fit.
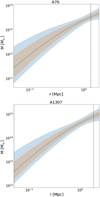 |
Fig. 10 Best-fit NFW mass profile for A76 (top) and A1307 (bottom). The inner and outer shaded area represent the 68% and 95% confidence regions, respectively. The black dotted vertical lines indicate the best-fit value of r200. |
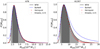 |
Fig. 11 Marginalised posterior of M200 obtained by fitting the phase space with a NFW model for the mass profile (solid black curve), a Burkert profile (dashed blue line), Hernquist (filled red circles), and Einasto with n = 5 (brown stars). The shaded areas refer to the 68% (dark grey) and 95% (light grey) confidence intervals. |
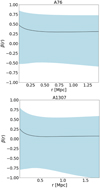 |
Fig. 12 Radial profiles for the best-fit velocity anisotropy of A76 (top) and A1307 (bottom), parametrised as a gT model. The shaded areas refer to the 68% confidence intervals. |
8 Summary and conclusions
We perform a detailed study on the dynamical state of two galaxy clusters, Abell 76 and 1307, with different X-ray phenomenology. Our study relies on recent spectroscopic data obtained with the 3.5m TNG telescope, along with complementary NED and SDSS-DR16 spectroscopic redshifts within a region of ~1 and 0.7r200 for A76 and A1307, respectively. We selected 122 and 116 cluster members to analyse the velocity field in each cluster. These studies do not reveal any significant deviations from Gaussianity neither in A76 nor in A1307. Our results on the total mass of the cluster, based on the σ–M relation, the X-ray emission, the MG-MAMPOSST analysis, and even the mass obtained from SZ-Planck signal, we obtain a mean M500 of 1.7 ± 0.6 · 1014 M⊙ and 3.5 ± 1.3 · 1014 M⊙ for A76 and A1307, respectively.
For A76, we find that the X-ray surface brightness morphology and the projected galaxy distributions indicate that the clusters dynamics is not completely relaxed. Thus, we basically conflrm the findings by OTA13. They suggest that A76 is at an early stage of cluster formation and that gas compression caused by potential confinement is lagging behind the gas heating. Our spectroscopic and photometric analyses also indicate that A76 is a young cluster in process of formation, that may be in the first stages of relaxation, further encouraged by a slight evidence radial orbits.
Similarly, a large population of early-type galaxies, and the agreement between X-ray and dynamical magnitudes in A1307 suggest that this cluster may be more relaxed than A76, with an indication of more isotropic orbits as found by the MG-MAMPOSST fit. However, its elongated X-ray emission reveals that the gas of this cluster has been disturbed by a recent minor merger. In addition, the mass profile obtained from the fit of the p.p.s. prefers larger M200 with respect to what found from X-ray and σ–M relation, a possible indication of an elongated feature along the line of sight.
To summarise, A76 and A1307 represent two clusters with different masses and X-ray emissions but showing similar morphologies with a disturbed appearance in the X-ray images but no pronounced signatures of substructure in the galaxy velocity distribution in the line of sight. A76 is a young and not consolidated cluster, with only a few and very poor galaxy clumps that seem to be assembling, with a low mass and low X-ray surface brightness. Several features support this interpretation of a young dynamical system. The X-ray emission is very dispersed and it is difficult to explain this structure, for example, by a post-merger. We see several bright galaxies of which at least four have compact X-ray halos without any signs of distortions like stripping tails. Also the indication of a preference of radial orbits and a large fraction star forming emission line galaxies are in line with this interpretation. An remaining enigma is the high central entropy. If we compare this entropy value to other clusters for example in the REXCESS sample (Pratt et al. 2009), we find that this value corresponds to typical values in non-cool core clusters at a radius of 0.1–0.2 r500. Since A76 does not have a real core, this value may not be so surprising. The typical low entropy value in the core may only be formed, when a dense, compact core is established. To further clarify the nature of these kind of systems, with so unusually low X-ray emission, many more dynamical studies have to be developed on similar clusters. On the other hand, A1307 represents the case of a more regular cluster, more massive and relaxed in comparison with A76. However, we cannot completely discard the possibility that A1307 has recently suffered a minor merger in the plane of the sky, involving a very low-mass and very poor galaxy clump, that remains undetectable in the velocity–space plane, but could slightly have disturbed in some way the X-ray emission.
With this work we want to enhance the importance of carrying out dynamic studies in galaxy clusters from a multi-wavelength approach. This is the natural way to find appropriate scenarios to disentangle the dynamical state the different components (galaxies and gas) of galaxy systems.
Data availability
Full Tables 1 and 2 are available at the CDS via anonymous ftp to cdsarc.cds.unistra.fr (130.79.128.5) or via https://cdsarc.cds.unistra.fr/viz-bin/cat/J/A+A/691/A135
Acknowledgements
This project has been mainly funded by the Spanish Ministerio de Ciencia, Innovación y Universidades through grant PID2021-122665OB-I00. R. Barrena acknowledges support by the Severo Ochoa 2020 research programme of the Instituto de Astrofísica de Canarias. G. Chon acknowledges support by the DLR under the grant no. 50 OR 2204. H. Böhringer acknowledges support from the Deutsche Forschungsgemeinschaft through the Excellence cluster “Origins”. This article is based on observations made with the Italian Telescopio Nazionale Galileo operated by the Fundación Galileo Galilei of the INAF (Istituto Nazionale di Astrofisica). This facility is located at the Spanish del Roque de los Muchachos Observatory of the Instituto de Astrofísica de Canarias on the island of La Palma. Funding for the Sloan Digital Sky Survey (SDSS) has been provided by the Alfred P. Sloan Foundation, the Participating Institutions, the National Aeronautics and Space Administration, the National Science Foundation, the U.S. Department of Energy, the Japanese Monbukagakusho, and the Max Planck Society.
References
- Andreon, S., 2016, A&A, 587, A158 [NASA ADS] [CrossRef] [EDP Sciences] [Google Scholar]
- Anderson, T. W., & Darling, D. A. 1954, J. Am. Statist. Assoc., 49, 765 [CrossRef] [Google Scholar]
- Aguado-Barahona, A., Rubiño-Martín, J. A., Ferragamo, A., et al. 2022, A&A, 659, A126 [NASA ADS] [CrossRef] [EDP Sciences] [Google Scholar]
- Arnaud, M., Ettori, S., Pratt G. W., et al. 2021, A&A, 650, A104 [CrossRef] [EDP Sciences] [Google Scholar]
- Arnaud, M., Pointecouteau E., & Pratt, G. W. 2005, A&A, 441, 893 [NASA ADS] [CrossRef] [EDP Sciences] [Google Scholar]
- Ashman, K. M., Bird C. M., & Zepf S. E. 1994, AJ, 108, 2348 [NASA ADS] [CrossRef] [Google Scholar]
- Beers, T. C., Flynn K., & Gebhardt K. 1990, AJ, 100, 32 [NASA ADS] [CrossRef] [Google Scholar]
- Benavides, J. A., Biviano, A., & Abadi, M. G. 2023, A&A, 669, A147 [NASA ADS] [CrossRef] [EDP Sciences] [Google Scholar]
- Berrier, J. C., Stewart, K. R., Bullock, J. S., et al. 2009, ApJ, 690, 1292 [NASA ADS] [CrossRef] [Google Scholar]
- Biviano, A., Pizzuti, L., Mercurio, A., et al. 2023, ApJ, 958, 148 [NASA ADS] [CrossRef] [Google Scholar]
- Böhringer, H., Voges, W., & Huchra, J. P. 2000, ApJS, 129, 435 [CrossRef] [Google Scholar]
- Böhringer, H., Pratt, G. W., Arnaud, M., et al. 2010, A&A, 514, A32 [NASA ADS] [CrossRef] [EDP Sciences] [Google Scholar]
- Böhringer, H., Chon, G., Retzlaff, J., et al. 2017, AJ, 153, 220 [Google Scholar]
- Burkert, A. 1995, ApJ, 447, L25 [NASA ADS] [Google Scholar]
- Campitiello, M. G., Ettori, S., Lovisari, L., et al. 2022, A&A, 665, A117 [NASA ADS] [CrossRef] [EDP Sciences] [Google Scholar]
- Carlberg, R. G., Yee, H. K. C., Ellingson, E., et al. 1997, ApJ, 476, L7 [NASA ADS] [CrossRef] [Google Scholar]
- Chon, G., & Böhringer, H. 2015, A&A, 574, 132 [Google Scholar]
- de Carvalho, R. R., Ribeiro, A. L. B., Stadler, A. L. B., et al. 2017, AJ, 154, 96 [CrossRef] [Google Scholar]
- Dressler, A., & Shectman, S. A. 1988, AJ, 95, 985 [Google Scholar]
- Duffy, A. R., Schaye, J., Kay, S. T., et al. 2008, MNRAS, 390, L64 [NASA ADS] [CrossRef] [Google Scholar]
- Einasto, J. 1965, Trudy Astrofiz. Inst. Alma-Ata, 5, 87 [NASA ADS] [Google Scholar]
- Evrard, A. E., Blalek, J., Busha, M., et al. 2008, ApJ, 672, 122 [NASA ADS] [CrossRef] [Google Scholar]
- Ferragamo, A., Rubiño-Martín, J. A., Betancort-Rijo, J., et al. 2020, A&A, 641, A41 [NASA ADS] [CrossRef] [EDP Sciences] [Google Scholar]
- Hernquist, L. 1990, ApJ, 356, 359 [Google Scholar]
- Kennicutt, R. C., 1992, ApJS, 79, 255 [NASA ADS] [CrossRef] [Google Scholar]
- Laganá, T. F., Lima Neto, G. B., Andrade-Santos, F., et al. 2008, A&A, 485, 633 [NASA ADS] [CrossRef] [EDP Sciences] [Google Scholar]
- Lovisari, L., Ettori, S., Rasia, E., et al. 2024, A&A, 682, A45 [NASA ADS] [CrossRef] [EDP Sciences] [Google Scholar]
- Mamon, G., Biviano, A., Murante, G. 2010, A&A, 520, A30 [NASA ADS] [CrossRef] [EDP Sciences] [Google Scholar]
- Mamon, G., Biviano, A., Boué, G. 2013, MNRAS, 429, 3079 [CrossRef] [Google Scholar]
- Mamon, G. A., Cava, A., Biviano, A., et al. 2023, A&A, 631, A131 [Google Scholar]
- McGee, S. L., Balogh, M. L., Bower, R. G. 2009, MNRAS, 400, 937 [NASA ADS] [CrossRef] [Google Scholar]
- Mehrtens, N., Romer, A. K., Hilton, M., et al. 2012, MNRAS, 423, 1024 [NASA ADS] [CrossRef] [Google Scholar]
- Munari, E., Biviano, A., Borgani, S., et al. 2013, MNRAS, 430, 2638 [NASA ADS] [CrossRef] [Google Scholar]
- Navarro, J. F., Frenk, C. S., & White, S. D. M. 1997, ApJ, 490, 493 [Google Scholar]
- Ota, N., Fujino, Y., Ybaraki, Y., et al. 2013, A&A, 556, A21 [NASA ADS] [CrossRef] [EDP Sciences] [Google Scholar]
- Piffaretti, R., Arnaud, M., Pratt, G. W., et al. 2011, A&A, 534, A109 [NASA ADS] [CrossRef] [EDP Sciences] [Google Scholar]
- Pizzuti, L., Sartoris, B., Borgani, S., et al. 2020, J. Cosmology Astropart. Phys., 04, 024 [CrossRef] [Google Scholar]
- Pizzuti, L., Saltas, I., & Amendola, L. 2021, MNRAS, 506, 595 [NASA ADS] [CrossRef] [Google Scholar]
- Pizzuti, L., Saltas, I. D., Biviano, A., et al. 2023, Joss, 8, 81 [Google Scholar]
- Planck Collaboration XXVII. 2016, A&A, 594, A27 [NASA ADS] [CrossRef] [EDP Sciences] [Google Scholar]
- Pratt, G. W., Croston, J. H., & Arnaud, M. 2009, A&A, 498, 361 [NASA ADS] [CrossRef] [EDP Sciences] [Google Scholar]
- Ribeiro, A. L. B., Lopes, P. A. A., & Trevisan, M. 2011, MNRAS, 413, L81 [NASA ADS] [Google Scholar]
- Rines, K. J., Geller, M. J., Diaferio, A., et al. 2016, ApJ, 819, 63 [NASA ADS] [CrossRef] [Google Scholar]
- Sarazin, C. L., 1980 ApJ, 236, 75 [NASA ADS] [CrossRef] [Google Scholar]
- Saro, A., Mohr, J. J., Bazin, G., et al. 2013, ApJ, 772, 47 [NASA ADS] [CrossRef] [Google Scholar]
- Schlegel, D. J., Finkbeiner, D. P., Davis, M. 1998, ApJ, 500, 525 [NASA ADS] [CrossRef] [Google Scholar]
- Sunyaev, R., & Zeldovich, Ya. B. 1969, Nature, 223, 721 [NASA ADS] [CrossRef] [Google Scholar]
- Tonry, J., & Davis, M. 1979, ApJ, 84, 1511 [Google Scholar]
- Vikhlinin, A., Kravtsov, A., Forman, W., et al. 2006, ApJ, 640, 691 [Google Scholar]
- Wojtak, R. 2013, A&A, 559, A89 [NASA ADS] [CrossRef] [EDP Sciences] [Google Scholar]
See http://www.tng.iac.es/instruments/lrs for LR-B grism technical details.
dered magnitudes are the extinction-corrected model ones, provided by SDSS archive, which considers the Schlegel et al. (1998) maps for reddening corrections.
The Bayesian Information Criterion (see e.g. Mamon et al. 2019) is defined as BIC= −2 ln 𝒫 + NP ln Ndata, where 𝒫 is the posterior distribution, NP, Ndata the number of free parameters and data points, respectively. A value of ∆BIC ≳ 6 means that the first model is highly disfavoured with respect to the second.
All Tables
Results of different mass and number density models ansatz for the cluster A76 and A1307.
All Figures
|
Fig. 1 Spectroscopic sample of galaxy targets considered in this work in the A76 and A1306 fields, superimposed to SDSS r-band images. Red and blue squares correspond to the cluster member and non-member galaxies, respectively. The numbers mark the brightest galaxies as explained in the text. |
| In the text | |
|
Fig. 2 XMM-Newton images of the clusters A76 and A1307 in the 0.5 to 2 keV energy band. The images have been smoothed with a 7 pixels box size in order to reduce the noise. Green contours correspond to 8, 15 and 20-σ detection levels in A76 panel, while A1307 contours match with 6, 30 and 90-σ detections. The circle SE in the A76 frame indicates the subcluster at the south-east detected by OTA13 in the XMM-Newton observations. We perform a comparative analysis of the diffuse signal from regions labelled as SE, SW, NE and NW in Sect. 4. Dotted lines in the A1307 frame demarcate the two hemispheric regions, north and south, analysed in this work. In both frames, north is up and east is to the left. |
| In the text | |
|
Fig. 3 Velocity histograms of galaxy members in the cluster rest frame. The Gaussian curves represent the reconstruction of the velocity distribution according to the biweight method. The velocity corresponding to the BCG, and other luminous galaxies are labelled as ‘BCG’, ‘2’, ‘3’, ‘4’ and ‘5’. |
| In the text | |
|
Fig. 4 Colour image obtained from the DR9 Legacy Survey of A76 (left) and A1307 (right). Superimposed, we plot contours corresponding to the X-ray surface brightness (green) and the isodensity galaxy distribution of likely cluster members (grey-blue). The BCG, ‘2’, ‘3’, ‘4’ and ‘5’ labels indicate the central bright cluster galaxy, and the other luminous galaxies. North is up and east to the left in both panels. |
| In the text | |
|
Fig. 5 Variation of the line-of-sight velocity dispersion, in the cluster rest frame, with the cluster-centric distance. The cluster centre is assumed to be the BCG position. The velocity dispersion values are computed using the bi-weight estimator and considering all galaxy members enclosed in that radius. The first value is calculated from the first five galaxies closest to the centre. The error bars are at the 68% confidence level. |
| In the text | |
|
Fig. 6 Spatial distribution of the cluster members, marked with squares and a size proportional to exp(δi) computed using the δi deviations obtained with the DS test. Red and blue correspond respectively to galaxies with lower and higher δi deviations from the mean, < δi >. The large black lines represent the directions of the velocity gradients in each cluster region. Crosses indicate the BCGs positions in each cluster. |
| In the text | |
|
Fig. 7 Projected positions of the cluster members (blue) in A76 (top) and A1307 (bottom) fields, where we have marked using other different colours the substructures identified by the DS+ algorithm. |
| In the text | |
|
Fig. 8 Temperature profiles of A1307 fitted by a polytropic model. The temperature profile of the southern hemisphere is shown by the red and that of the northern hemisphere by blue data points. The lines show the fits of polytropic models: solid line (north) and dashed line (south), where for the latter only the outer part of the profile was fitted. |
| In the text | |
|
Fig. 9 Projected phase spaces of Abell 76 (top left) and Abell 1307 (top right). The vertical dotted lines represent the estimated r200 derived from the dynamical analyses. Bottom panels display the corresponding (projected) number density profiles (blue stars with error bars). The green and orange solid curves represent the best-fit profiles for a projected Hernquist and projected NFW models, respectively. |
| In the text | |
|
Fig. 10 Best-fit NFW mass profile for A76 (top) and A1307 (bottom). The inner and outer shaded area represent the 68% and 95% confidence regions, respectively. The black dotted vertical lines indicate the best-fit value of r200. |
| In the text | |
|
Fig. 11 Marginalised posterior of M200 obtained by fitting the phase space with a NFW model for the mass profile (solid black curve), a Burkert profile (dashed blue line), Hernquist (filled red circles), and Einasto with n = 5 (brown stars). The shaded areas refer to the 68% (dark grey) and 95% (light grey) confidence intervals. |
| In the text | |
|
Fig. 12 Radial profiles for the best-fit velocity anisotropy of A76 (top) and A1307 (bottom), parametrised as a gT model. The shaded areas refer to the 68% confidence intervals. |
| In the text | |
Current usage metrics show cumulative count of Article Views (full-text article views including HTML views, PDF and ePub downloads, according to the available data) and Abstracts Views on Vision4Press platform.
Data correspond to usage on the plateform after 2015. The current usage metrics is available 48-96 hours after online publication and is updated daily on week days.
Initial download of the metrics may take a while.