Fig. 4
Download original image
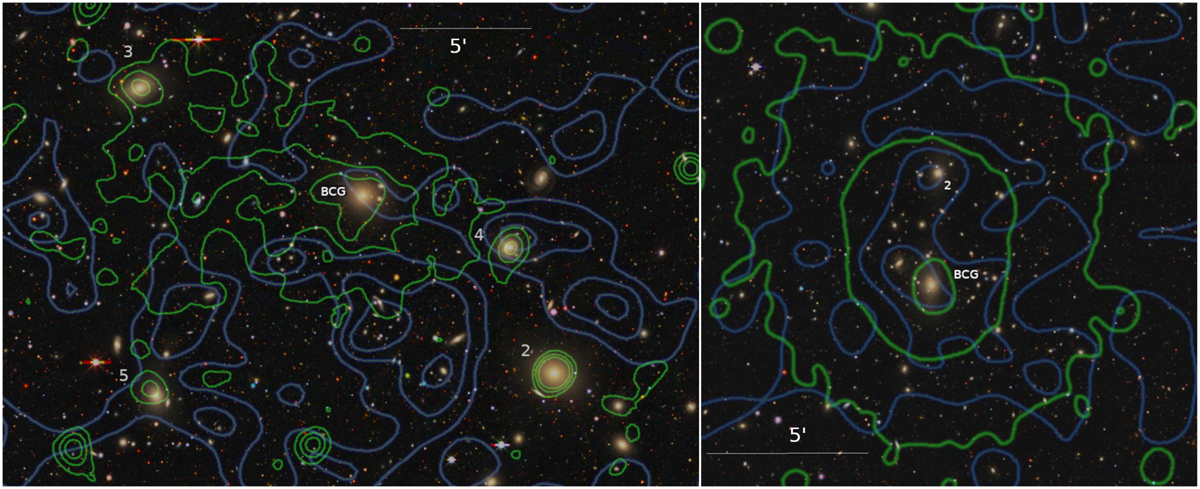
Colour image obtained from the DR9 Legacy Survey of A76 (left) and A1307 (right). Superimposed, we plot contours corresponding to the X-ray surface brightness (green) and the isodensity galaxy distribution of likely cluster members (grey-blue). The BCG, ‘2’, ‘3’, ‘4’ and ‘5’ labels indicate the central bright cluster galaxy, and the other luminous galaxies. North is up and east to the left in both panels.
Current usage metrics show cumulative count of Article Views (full-text article views including HTML views, PDF and ePub downloads, according to the available data) and Abstracts Views on Vision4Press platform.
Data correspond to usage on the plateform after 2015. The current usage metrics is available 48-96 hours after online publication and is updated daily on week days.
Initial download of the metrics may take a while.