Fig. 6
Download original image
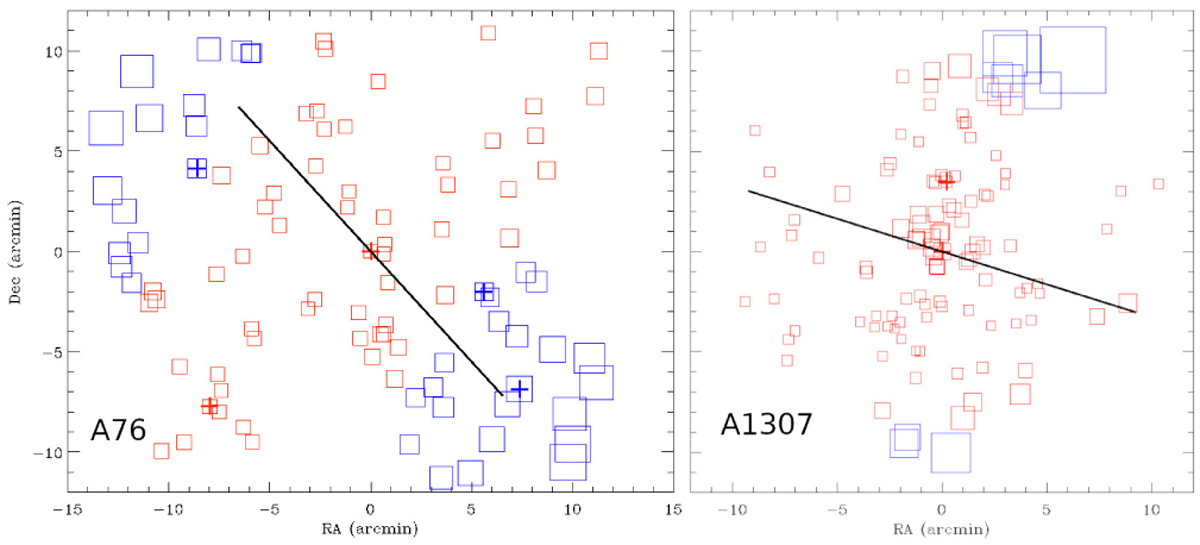
Spatial distribution of the cluster members, marked with squares and a size proportional to exp(δi) computed using the δi deviations obtained with the DS test. Red and blue correspond respectively to galaxies with lower and higher δi deviations from the mean, < δi >. The large black lines represent the directions of the velocity gradients in each cluster region. Crosses indicate the BCGs positions in each cluster.
Current usage metrics show cumulative count of Article Views (full-text article views including HTML views, PDF and ePub downloads, according to the available data) and Abstracts Views on Vision4Press platform.
Data correspond to usage on the plateform after 2015. The current usage metrics is available 48-96 hours after online publication and is updated daily on week days.
Initial download of the metrics may take a while.