Open Access
Fig. 11
Download original image
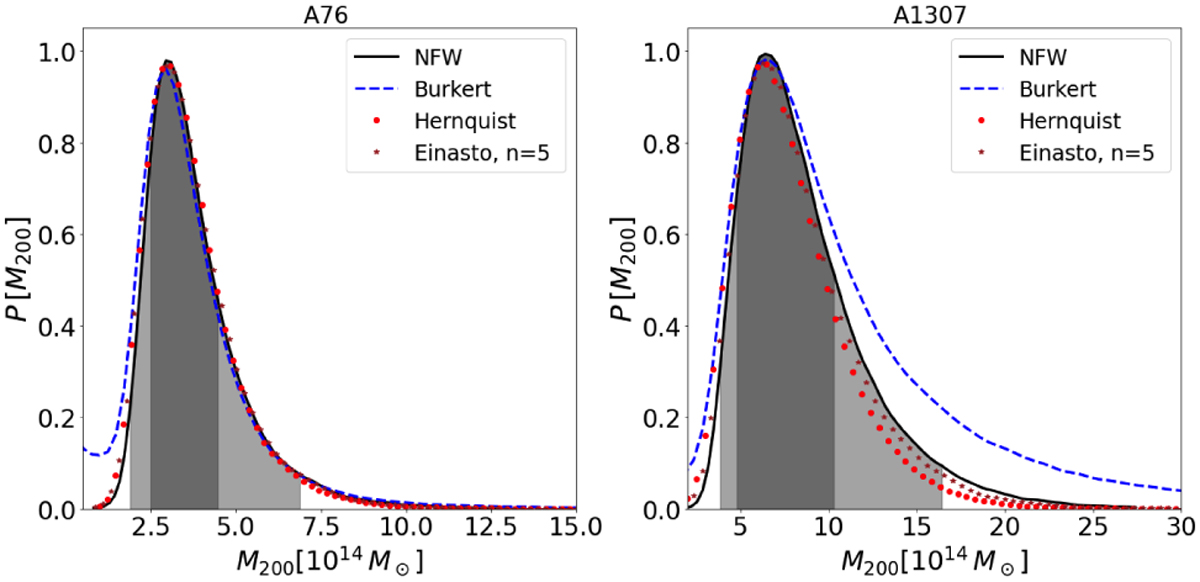
Marginalised posterior of M200 obtained by fitting the phase space with a NFW model for the mass profile (solid black curve), a Burkert profile (dashed blue line), Hernquist (filled red circles), and Einasto with n = 5 (brown stars). The shaded areas refer to the 68% (dark grey) and 95% (light grey) confidence intervals.
Current usage metrics show cumulative count of Article Views (full-text article views including HTML views, PDF and ePub downloads, according to the available data) and Abstracts Views on Vision4Press platform.
Data correspond to usage on the plateform after 2015. The current usage metrics is available 48-96 hours after online publication and is updated daily on week days.
Initial download of the metrics may take a while.