Fig. 2
Download original image
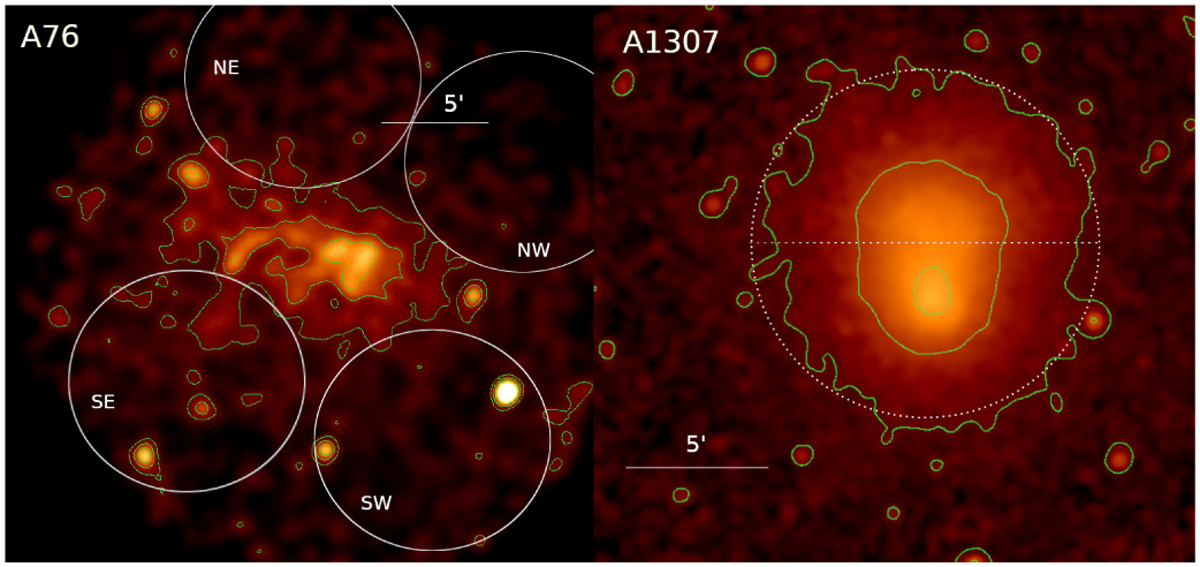
XMM-Newton images of the clusters A76 and A1307 in the 0.5 to 2 keV energy band. The images have been smoothed with a 7 pixels box size in order to reduce the noise. Green contours correspond to 8, 15 and 20-σ detection levels in A76 panel, while A1307 contours match with 6, 30 and 90-σ detections. The circle SE in the A76 frame indicates the subcluster at the south-east detected by OTA13 in the XMM-Newton observations. We perform a comparative analysis of the diffuse signal from regions labelled as SE, SW, NE and NW in Sect. 4. Dotted lines in the A1307 frame demarcate the two hemispheric regions, north and south, analysed in this work. In both frames, north is up and east is to the left.
Current usage metrics show cumulative count of Article Views (full-text article views including HTML views, PDF and ePub downloads, according to the available data) and Abstracts Views on Vision4Press platform.
Data correspond to usage on the plateform after 2015. The current usage metrics is available 48-96 hours after online publication and is updated daily on week days.
Initial download of the metrics may take a while.