Fig. 8
Download original image
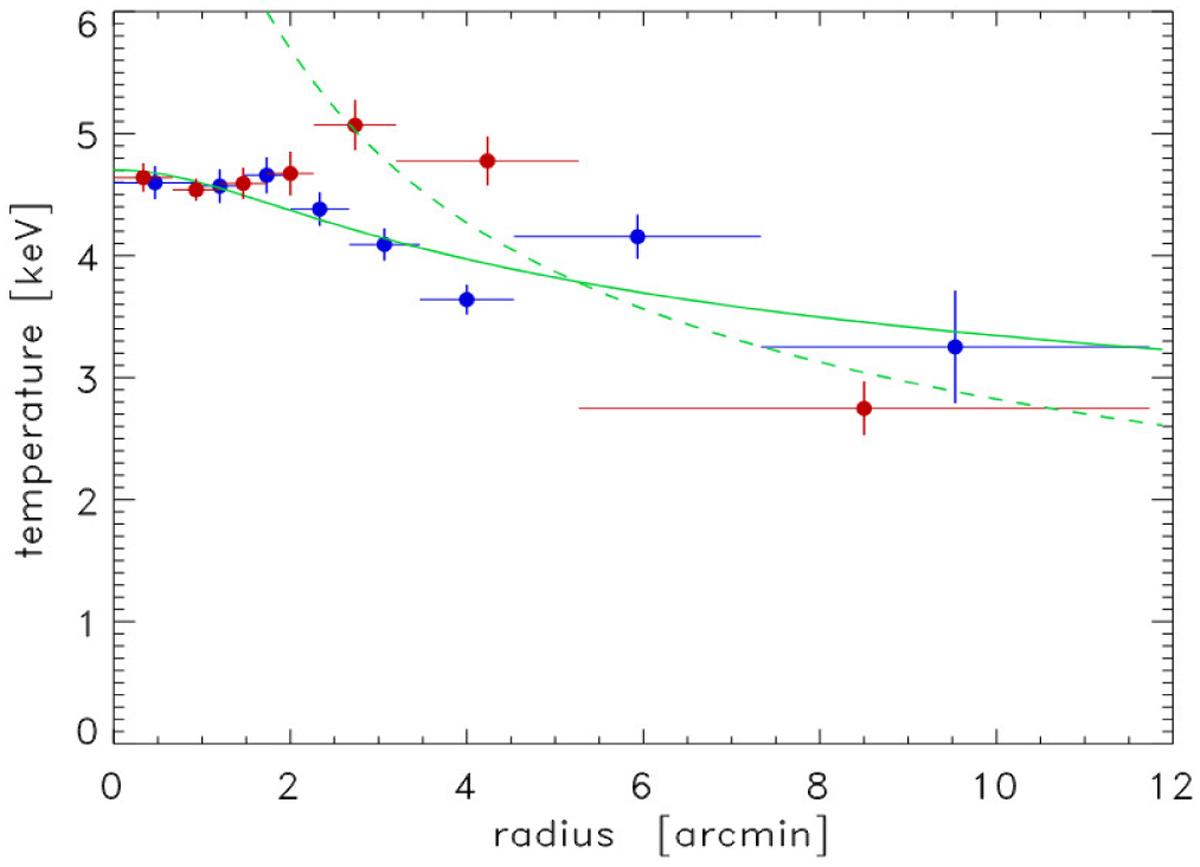
Temperature profiles of A1307 fitted by a polytropic model. The temperature profile of the southern hemisphere is shown by the red and that of the northern hemisphere by blue data points. The lines show the fits of polytropic models: solid line (north) and dashed line (south), where for the latter only the outer part of the profile was fitted.
Current usage metrics show cumulative count of Article Views (full-text article views including HTML views, PDF and ePub downloads, according to the available data) and Abstracts Views on Vision4Press platform.
Data correspond to usage on the plateform after 2015. The current usage metrics is available 48-96 hours after online publication and is updated daily on week days.
Initial download of the metrics may take a while.