| Issue |
A&A
Volume 690, October 2024
|
|
|---|---|---|
| Article Number | A382 | |
| Number of page(s) | 17 | |
| Section | The Sun and the Heliosphere | |
| DOI | https://doi.org/10.1051/0004-6361/202450456 | |
| Published online | 22 October 2024 | |
Non-thermal electrons in an eruptive solar event: Magnetic structure, confinement, and escape into the heliosphere
1
Observatoire de Paris, LESIA, Univ. PSL, CNRS, Sorbonne Univ., Univ. Paris Cité, 5 place Jules Janssen, F-92190 Meudon, France
2
Observatoire de Paris, Observatoire radioastronomique de Nançay, Univ. PSL, CNRS, Univ. d’Orléans, France
3
Space Research Center, University of Costa Rica, San Jose, Costa Rica
4
Institut für Experimentelle und Angewandte Physik, Christian Albrechts-Universität zu Kiel, Kiel, Germany
Received:
20
April
2024
Accepted:
30
July
2024
Abstract
Context. Filament eruptions and coronal mass ejections (CMEs) reveal large-scale instabilities of magnetic structures in the solar corona. Some of them are accompanied by radio emission, which at decimetric and longer wavelengths is a signature of electron acceleration that may be different from the acceleration in impulsive flares. The radio emission is part of the broadband continua at decimetre and metre wavelengths called type IV bursts.
Aims. In this article we investigate a particularly well-observed combination of a filament eruption seen in Hα and at extreme ultraviolet (EUV) wavelengths and a moving type IV burst on 2021 August 24. The aim is to shed light on the relationship between the large-scale erupting magnetic structure and the acceleration and transport of non-thermal electrons.
Methods. We used imaging observations of a moving radio source and associated burst groups with the refurbished Nançay Radioheliograph and whole-Sun radio spectrography from different ground-based and space-borne instruments, in combination with X-ray, radio, and in situ electron observations at tens of keV from Solar Orbiter and EUV imaging by SDO/AIA. The radio sources are located with respect to the erupting magnetic structure traced by the filament (EUV 30.4 nm), and the timing of the electrons detected in situ is compared with the timing of the different radio emissions.
Results. We find that the moving radio source is located at the top of the erupting magnetic structure outlined by the filament, which we interpret as a magnetic flux rope. The flux rope erupts in a strongly non-radial direction, guided by the overlying magnetic field of a coronal hole. The electrons detected at Solar Orbiter are found to be released mainly in two episodes, 10–40 minutes after the impulsive phase. The releases coincide with two groups of radio bursts, which originate respectively on the flank and near the top of the erupting flux rope.
Conclusions. The observation allows an unusually clear association between a moving type IV radio burst, an erupting magnetic flux rope as core structure of a CME, and particle releases into the heliosphere. Non-thermal electrons are confined in the flux rope. Electrons escape to the heliosphere mainly in two distinct episodes, which we relate to magnetic reconnection between the flux rope and ambient open field lines.
Key words: Sun: activity / Sun: corona / Sun: coronal mass ejections (CMEs) / Sun: flares / Sun: particle emission / Sun: radio radiation
Corresponding authors; This email address is being protected from spambots. You need JavaScript enabled to view it. ; This email address is being protected from spambots. You need JavaScript enabled to view it. ; This email address is being protected from spambots. You need JavaScript enabled to view it.
From Solar Mach (Gieseler et al. 2023), https://solar-mach.github.io/
© The Authors 2024
 Open Access article, published by EDP Sciences, under the terms of the Creative Commons Attribution License (https://creativecommons.org/licenses/by/4.0), which permits unrestricted use, distribution, and reproduction in any medium, provided the original work is properly cited.
This article is published in open access under the Subscribe to Open model. This email address is being protected from spambots. You need JavaScript enabled to view it. to support open access publication.
1. Introduction
Radio bursts emitted by non-thermal electron populations in the Sun are classified according to their dynamic spectrum. In the microwave range (frequencies above 1 GHz, and millimetre and centimetre wavelengths) broadband bursts are observed, which are usually ascribed to gyrosynchrotron emission of mildly relativistic electrons (Nindos 2020). At lower frequencies the bursts show an increasing amount of spectral structure. Five categories are distinguished at decimetric and longer wavelengths. Bursts of types III and II are rather well understood in terms of electron beams travelling along open magnetic field lines and anisotropic electron populations accelerated at travelling shock waves, respectively. These electron populations are unstable, which leads to the growth of Langmuir waves and their conversion in radio waves with narrow spectra near the local electron plasma frequency and its harmonic. The spectra drift towards lower frequencies as the exciter rises in the corona, or towards higher frequencies when the exciter moves downward. The relatively high degree of understanding of these bursts is owed to the possibility to observe the radio and plasma waves and the related electron populations in situ near 1 AU (Lin 1985; Ergun et al. 1998; Bale et al. 1999; Pulupa & Bale 2008; Reid & Ratcliffe 2014; Graham & Cairns 2015).
Broadband (continuum) bursts at decimetric and longer wavelengths are much less understood. This is especially the case of type IV bursts, which were identified by Boischot (1957) as bright emissions related with strong flares that occurred after the bursts of types III and II, with long durations that could amount to several hours. In some cases the radio source was found to move over a significant fraction of the solar disk. Boischot & Denisse (1957) ascribed this emission to non-thermal electrons because of its high brightness, and more specifically to relativistic electrons emitting incoherent synchrotron radiation, because of its long duration, large bandwidth, and the apparent absence of short bursts. They also concluded on a link with solar energetic particle (SEP) events since the three relativistic ground level events observed between 1946 and 1956 were accompanied by type IV bursts. Pick-Gutmann (1961) confirmed and specified the relationship with SEPs. Her exhaustive study also showed that type IV bursts constitute a broad category of broadband radio emissions with different subtypes that may or may not occur together. A clear distinction exists, for example, between the hour-long type IV sources called ‘storm continua’ by Pick or ‘stationary type IV bursts’ by Wild et al. (1963), with essentially static sources, and the moving type IV bursts identified by their systematic motion in interferometric recordings. The type IV burst category comprises emissions related to confined electron populations, but no unique physical interpretation has emerged in terms of the exciter and the radiation process (Wild et al. 1963; Robinson 1978; Kuijpers 1980; Duncan 1981; Trottet et al. 1981). The historical development of the type IV concept has been described in Pick (1986) and Pick & Vilmer (2008).
Type IV radio bursts as a whole, and moving type IV bursts in particular, were found to be associated with mass ejections from the Sun in comparative observations by coronagraphs and radio imaging at low frequencies where the emission arises above the occulting disk of the coronagraph (Robinson 1978; Gergely et al. 1984; Stewart 1985; Gopalswamy & Kundu 1987; Kundu et al. 1989; Ramesh et al. 2013), and in statistical studies (Kumari et al. 2021; Morosan et al. 2021). In his review of early observations of coronal mass ejections (CMEs) MacQueen (1980) reported various degrees of spatial and temporal association between type IV radio sources, prominence material, and white-light structures of CMEs, concluding that the moving type IV sources tend to be located near material seen in Hα, but without a consistent picture. Individual cases of close associations pointing to a common magnetic structure of an erupting prominence and the moving type IV source were reported in some studies (Gopalswamy & Kundu 1989; Klein & Mouradian 2002; Raoult-Barbezat & Klein 2005; Vršnak et al. 2003; Bain et al. 2014), but this does not seem to be systematic.
In the present work we address two questions: (1) how the source of a moving type IV burst is related to the overall magnetic structure in a solar eruption and (2) how the energetic particles that escape into the heliosphere are related to the apparently confined electrons in the type IV radio source. We analyse a rather weak, but exceptionally long-lasting and well-defined moving type IV radio burst on 2021 August 24, using radio imaging over a range of frequencies with the Nançay Radioheliograph (NRH), imaging of erupting features with high cadence from SDO/AIA at EUV wavelengths and from the Pic du Midi Observatory in the Hα line, radio spectrography from ground-based and space-borne instruments, and X-ray and electron observations from a well-connected vantage point aboard the Solar Orbiter mission. The manuscript is organised as follows. Multi-instrument observations of the erupting structure and non-thermal electrons are described in Sect. 2. The instruments used are listed in Sect. 2.1. An overview of the eruptive event is given in Sect. 2.2. Radio and X-ray observations of the impulsive phase are addressed in Sect. 2.3, followed in Sect. 2.4 by a detailed description of the erupting filament using movies at 30.4 nm wavelength and radio waves. The kinematics and spectrum of the moving type IV radio emission are analysed in Sect. 2.5. The continuum emission is accompanied by three groups of fast-drift bursts, which are described in Sect. 2.6. Section 2.8 presents the observations of solar energetic electrons in space and the timing of their release at the Sun, which is compared with the radio emissions. The observations are summarised in Sect. 3, and tentative interpretations are proposed and discussed with respect to previous work.
2. Filament eruption and non-thermal electrons
2.1. Instruments
We analysed observations of an erupting filament at EUV wavelengths (in particular λ = 30.4 nm) with the Atmospheric Imaging Assembly (AIA, Lemen et al. 2012) aboard the Solar Dynamics Observatory (SDO, Pesnell et al. 2012) mission and in the Hα line with the CLIMSO instrument at Pic du Midi (Pitout et al. 2020). The CLIMSO Hα imager is a Coronado-type refractor with 15 cm diameter. The filter is centred at 656.28 nm and has a full width at half-maximum of 0.05 nm. The AIA 30.4 nm band is centred on 30.38 nm, with a full width at half-maximum of 1.2 nm (Fig. 8 of Boerner et al. 2012). The main nominal temperature range covered is lg(Te/1 K) = 4.81 − 5.09 (half-maximum), with a peak at lg(Te/1 K) = 4 (see procedure in the Appendix of Boerner et al. 2012), but there is also a secondary response to the 9.4 nm channel, which is sensitive to temperatures in the range lg(Te/1 K) = 5.1 − 7.2.
Dynamic spectra of solar radio bursts were observed by the ORFEES (Hamini et al. 2021) and Decametric spectrographs (NDA, Lecacheux 2000) of the Nançay Radio Observatory in the 1000–144 MHz and 80–20 MHz ranges, respectively, by the Glasgow spectrograph of the e-Callisto network (Benz et al. 2009) between 80 and 45 MHz, and the WAVES experiment (Bougeret et al. 1995) aboard the Wind spacecraft below 16 MHz. The Nançay Radioheliograph (NRH, Kerdraon & Delouis 1997) observed images at eight frequencies in the range 150–432 MHz. The instrument had gone through a major upgrade between 2015 and 2020, where the correlator and the data acquisition system were replaced. The new correlator acquires all 1128 visibilities from the 47 antennas. While upgrading operations are still underway, imaging in total intensity (Stokes parameter I) resumed in November 2020 with a time resolution of 0.25 seconds per frequency. The data analysis followed the standard procedure offered in the NRH package in the SolarSoft analysis. The image was reconstructed using 256 × 256 pixels to describe a field of view of 4 R⊙ around disk centre. The standard NRH CLEAN procedure was used.
The Solar Orbiter spacecraft (Müller 2020) was located at heliocentric distance 0.64 AU, 77° east and 8° south of the Sun-Earth line, at Stonyhurst latitude −1° on 2021 August 24 at 12:30 UT1. The Spectrometer Telescope for Imaging X-rays (STIX, Krucker et al. 2020) had the activity in its field of view. STIX covers photon energies from 4 to 150 keV with a time resolution adapted as a function of photon flux. In the present work we used count rate time histories only. The Radio and Plasma Wave experiment (RPW, Maksimovic et al. 2020) provides dynamic spectrograms at decametre to kilometre wavelengths (16 MHz–4 kHz). We used the Thermal Noise Receiver (TNR), which produces quasi-instantaneous spectra in the range 4 kHz–1 MHz, with a time cadence of 10 seconds. The Energetic Particle Detector (EPD, Rodríguez-Pacheco et al. 2020) is a suite of instruments for the in situ measurement of energetic electrons, protons and ions. We used the Electron Proton Telescope (EPT), especially time histories of the electron count rates in the nominal energy range of about 33–474 keV, and energy spectra above a few keV from EPT and the Suprathermal Electron Proton Sensor (STEP). STEP looks sunward. EPT has four electron detectors with orthogonal viewing directions towards and away from the Sun in the ecliptic plane, and southward and northward perpendicular to the ecliptic, with opening angles of about 30°.
2.2. Overview of the eruptive event
On 2021 August 24 a filament eruption starts in the north-eastern solar quadrant near 12 UT. It is accompanied by three weak soft X-ray bursts in NOAA active region 12859 (B1.9 11:52 UT, B3.2 13:35 UT, C1.5 14:18 UT) and several optical subflares (12:18 and 12:36 N19-20 E 38, 14:29 N19 E42-432). A coronal mass ejection (CME) is observed since 13:25 UT by the LASCO coronagraph (Brueckner et al. 1995) aboard the Solar and Heliospheric Observatory (SoHO). The CME is already broad in this image (position angle PA = 55° −115°). In subsequent images the front appears between PAs 60° and 130°. It reaches the border of the LASCO/C2 field of view at 15:36 UT, with a speed in the plane of the sky in the range 200–340 km s−1, depending on the location. A projected speed of 289 km s−1 with a slight deceleration is reported in the LASCO CME catalogue3 (Yashiro et al. 2004).
An overview of the dynamic spectra at radio and X-ray wavelengths is shown in Fig. 1. The radio observations at decimetre-to-hectometre wavelengths range from the low corona (460 MHz) to a heliocentric distance of about 10 R⊙ (1 MHz). The emissions are rather weak, and spurious features such as terrestrial interference and baseline drifts (ORFEES) are also seen. The X-rays are shown as a count rate spectrum in 1 keV-wide bins in the range 4–15 keV, with wider bins at higher energies. The energies are nominal values. Count rates are delivered with a time resolution that depends on the level of the emission. In the event under study the time resolution varies between 19.9 and 38.75 s. The count rates shown here were interpolated onto a regular grid with step 20 s, and normalised by the median values in the X-ray quiet time interval 14:00–14:10 UT. The X-ray bursts extend from 4 keV to at least 25 keV. The time of the STIX measurements was corrected to the photon arrival time at 1 AU, in order to enable the comparison with the radio spectra. The San Vito station of the Radio Solar Telescope Network (RSTN) observed the Sun during the event at fixed microwave frequencies in the range 1.4–15.4 GHz4. A weak burst group was seen between 12:09 and 12:14 UT at 1.4 GHz, but not at and above 4.995 GHz. This suggests that electrons are not accelerated to energies above about 100 keV, in line with the conclusions from the X-ray spectrum.
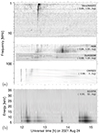 |
Fig. 1. Overview of dynamic spectrograms at radio (a) and X-ray (b) wavelengths during the eruptive event on 2021 August 24. Dark shading shows strong emission, with logarithmic grading. |
An impulsive flare phase is observed by STIX and ORFEES between 11:57:40 and 12:00:20 UT. Thereafter the radio emission proceeds systematically from high to low frequencies. The faint broadband emission starting near 12:10 UT and ending at frequencies below 100 MHz near 13:10 UT is a type IV continuum (ORFEES, e-Callisto Glasgow, NDA). A second continuum is observed by NDA between 13:30 and 14:30 UT. No counterpart is seen in the ORFEES spectrogram, but the NRH observes one at frequencies below 200 MHz (see Sect. 2.4). At frequencies below 16 MHz (decametric-hectometric wavelengths, Wind/WAVES) the only signature is a type III burst (shown here: 14–1 MHz) near 12:40 UT, at the time when the type IV continuum is visible in the NDA band. The soft X-ray bursts at 13:35 and 14:33 UT detected by GOES are seen in the SO/STIX spectrogram, but have no counterpart at decimetric wavelengths (ORFEES) and therefore no connection to the activity at metric and longer wavelengths.
The evolution of the radio sources observed by the NRH at eight frequencies between 150.9 MHz (λ = 2 m, henceforth referred to as 151 MHz) and 432 MHz (λ = 69 cm) is visualised in the NRH movie (Movie 01). The images were integrated over 1 minute, from their initial cadence of 0.25 s. The early snapshots show the thermal bremsstrahlung emission from the quiet corona. Glimpses of the impulsive phase are in three images between 11:58 and 12:00 UT. A new localised source appears at 12:03 UT at the higher frequencies, since 12:10 UT at all observed frequencies. It moves gradually south-eastward and could be tracked until 12:28 UT at the highest frequencies and until 13:03 UT at 151 MHz. This is the source of the continuum seen in the ORFEES dynamic spectrogram since 12:10 UT (Fig. 1). Because of the clear source motion it is a moving type IV burst. After this first moving source a broad brightness depression (dark shading) becomes visible on the north-western side of the earlier bright moving source. The depression broadens and extends eastward towards the solar limb, becoming successively visible at lower frequencies. While the brightness depression proceeds, new localised bright sources appear on its northern and north-western sides at 151–228 MHz at 12:42 UT. At the two lowest frequencies the source has a double structure. The two components start to separate near 13:00 UT, when the eastern source moves eastward, while fading, and disappears gradually (the 151 MHz source is still weakly seen at 14:00 UT). This is a second moving type IV burst. Westward of the two-component source another radio structure appears near 13:24 between 228 and 432 MHz. It becomes later the dominant source at all frequencies, persisting after the end of the movie at 14:00 UT. This is the early phase of a stationary type IV burst.
2.3. The impulsive phase
The first signatures of the eruptive event are brightenings in EUV images and impulsive emissions at X-ray and radio wavelengths. In the 1000–144 MHz range the radio emission comprises three burst groups (Fig. 2a): at frequencies below 300 MHz the initial group consists of fast-drift bursts. Some continue below the low-frequency border of the ORFEES receiver at 144 MHz and are seen by e-CALLISTO down to 50–60 MHz (11:58:20–11:58:45 UT), while others (e.g. the first burst at 11:58:00 UT) turn over from their initial drift towards lower frequencies to zero drift and possibly a drift towards higher frequencies thereafter. These are type J bursts, emitted by electron beams that travel in closed magnetic structures (see recent publications by Zhang et al. 2023; Feng et al. 2024). At frequencies above 300 MHz these bursts are accompanied, and actually preceded, by bursts with narrower bandwidth (some tens of MHz). Some drift towards lower and higher frequencies on either side of a spectral dividing line near 350 MHz. The common origin of oppositely drifting bursts at this frequency (i.e. of upward- and downward-propagating electron beams) suggests that we observe the acceleration region of the electron beams. The burst group is accompanied by X-ray emission up to at least 35 keV (Fig. 1b).
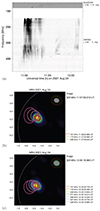 |
Fig. 2. Decimetric-metric radio emission during the impulsive phase of the 2021 August 24 event. Panel (a): Dynamic spectrum (ORFEES, 0.1 s; Glasgow e-Callisto station, 0.25 s resolution). Dark shading indicates bright emission. Panels (b and c): NRH maps (iso-intensity contours superposed on an image) of the first J burst (b; 11:58:00 UT) and the last type III burst (panel c; 12:00:19 UT). The contours delineate the half-maximum level at the burst peak (0.25 s resolution); the different colours represent different frequencies (see legend at right). The set of tilted ellipses in the upper right corner shows the half-maximum levels of the nominal interferometric antenna beam. Solar north is at the top, east on the left. The white arc shows the optical solar limb. |
Two other groups of radio bursts follow (Fig. 2a): two parallel-drifting lanes with narrow bandwidth, reminiscent of a type II burst but with short duration (11:59:19–11:59:35 UT), and four type III bursts (12:00:10–12:00:25 UT) at frequencies between 400 and 144 MHz. The radio emission during these two groups is fainter than in the first group and has no counterpart below 100 MHz.
Snapshot maps of the first type J burst (11:58:00 UT) and the last type III burst (12:00:19 UT) are displayed in Figs. 2b,c. The contours of equal brightness at decreasing frequencies show radio sources at increasing height. The multi-frequency sources outline two different magnetic structures: the field lines guiding the type J-burst-emitting electron beams (b) are located north of those with the type III source (c). The latter field lines are bent towards the equator. Radio spectra below 100 MHz show no evidence that the electrons emitting these bursts escape to the heliosphere, but we show in Sect. 2.8 that a few probably do.
2.4. The erupting filament at Hα, EUV, and radio wavelengths
The pre-eruptive configuration of AR 12859 comprises one major and several small sunspots (Fig. 3a) and three filaments (Fig. 3b) located, respectively, north-eastward, north-westward, and southward of the sunspot. The region is located N19° E32° and is classified as Hale class β5. The filament within the bright plage on the north-western side of the main sunspot erupts a few hours after the spectroheliogram was taken. Snapshots before and at three instants of the eruption are displayed in Fig. 4. The left panel shows Hα images, the right panel an EUV 30.4 nm image at the top, and later difference images, together with overlaid iso-intensity contours at half-maximum at radio wavelengths. In the image at 12:25:33 UT (second from top) the filament has started to erupt in the western direction, while the filament on the north-eastern side of the sunspot remains unchanged. While the most prominent feature seen in Hα continues to move westward, a few fragments are also seen south-westward of the active region at 12:35:06 UT. The small bandwidth of the filter implies that the filament leaves the band as soon as the speed along the line of sight exceeds about 23 km s−1. The picture is different at 30.4 nm: the filament appears as two branches of absorbing material, due to the photoionisation of neutral hydrogen and helium (e.g. Heinzel 2015; Kucera 2015), which are rooted in the active region and are particularly well seen in the bottom panel. The second panel from top shows the first moving type IV source in its early phase, observed at all NRH frequencies. At each of them the source has a simple structure. Sources at decreasing frequencies are located at increasing projected distance from the parent active region. The third and fourth panel from top show the first moving type IV phase later, near its end when it is only visible at the low NRH frequencies. The new source projecting to the eastern part of AR 12859 seen in the bottom panel is related to the second moving type IV burst.
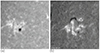 |
Fig. 3. Active region NOAA 12859 as observed before the eruptive activity by the Meudon spectroheliograph in the violet wing of the Ca II K line (a) and the centre of the Hα line (b). |
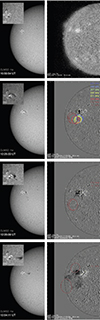 |
Fig. 4. Pre-eruptive active region (top panels) and three instants during the filament eruption, as observed in Hα (left panels; CLIMSO), EUV 30.4 nm (right panels, AIA/SDO), and radio (NRH; contours) on 2021 August 24. Solar north is at the top of the figure, solar east on the left. The insets in the left panel show close-ups of the eruption. A movie showing the images at 30.4 nm and the radio contours is available online (Movie 02). |
The temporal evolution of the filament eruption and the radio sources is captured in the NRH/AIA movie (Movie 02) with a cadence of 60 s. The AIA images are individual snapshots, while the NRH images were integrated. The filament erupts initially mainly southward, but bends rapidly towards a sustained south-eastward motion, developing two distinct branches. We interpret them as the legs of the erupting magnetic structure. The eastward component of the motion becomes increasingly important as the material proceeds to lower heliographic latitudes. This component is obvious in the quicklook movie6 of the Extreme Ultraviolet Imager (EUI) on STEREO A at 30.4 nm wavelength (Wuelser et al. 2004; Kaiser et al. 2008), where the eruption is seen in projection on the solar disk. Between 12:10 and 13 UT the radio sources are those of the first moving type IV burst, while occasionally sources related with other burst groups appear. The moving source and the bursts are discussed in more detail below (Sects. 2.5 and 2.6). Assuming the two branches of the erupting filament can be connected by a continuous loop or flux-rope-shaped configuration, one notes that the source of the first moving type IV burst moves out near the presumable top of this structure. At all radio frequencies the source has the same simple geometry. The sources fade the later, the lower the frequency. Eventually, when the emission is only visible at the lowest NRH frequencies (151 and 173 MHz), the motion turns exclusively eastward.
We measured the size of the moving type IV source in projection on the solar east-west and south-north directions, avoiding the periods when burst groups occurred at neighbouring sources (Sect. 2.6). The source size was extracted from gaussian fits to the scans in the two directions. At all frequencies the sources were found to be marginally broader than the nominal NRH beam (by 20%) in the east-west direction, and 60% broader in the south-north direction. The sizes do not change significantly during the event.
The contours of the radio brightness depression are plotted as coloured dots on top of the AIA images in the movie (Movie 02). The contours agree well with the spatial range delimited by the filament material, and follow the same outward motion. But the depression is broad, unlike the two-branch structure of the filament material in the AIA images.
The first moving type IV burst fades away at successively lower frequencies while the filament material (EUV 30.4 nm) and the cavity (radio) continue to move away from the active region. The dynamic spectrum (Fig. 1a) suggests that the moving type IV emission continues at frequencies below 100 MHz until after 13 UT. At NRH frequencies the NRH movie (Movie 01) shows the brightening of a new source north of the brightness depression since about 12:40 UT, including a second moving type IV source with a purely eastward motion. In the AIA/NRH movie (Movie 02) it accompanies a discrete, eastward-expanding dark structure in the eastern leg of the filament. While this radio source moves out, a stationary type IV burst brightens at all NRH frequencies above the parent active region.
2.5. The first moving type IV burst: 12:05–13:00 UT
In this section we look in more detail at the first moving type IV burst, because it was observed over an unusually long time and broad frequency range. This allowed us to study in detail the source motion (Sect. 2.5.1, the dynamic spectrum and its relationship with X-ray emission (Sects. 2.5.2, 2.5.3).
2.5.1. Source trajectory
The sources of the moving type IV burst seen at different frequencies are smaller than the overall structure outlined by the filament material at λ = 30.4 nm, and the distances between their centroid positions are still smaller. The location of the radio source at the top between the two branches of the filament material argues in favour of a population of non-thermal electrons that is confined around the top of the erupting magnetic structure.
A more detailed account is given in Fig. 5. The top panels show the dynamic spectrogram (a) and its time-differenced version (b) and below, the time histories of the radio brightness projected onto the solar east-west (a) and south-north (b) directions. The 1D time histories are stacked scans generated by summing each image over, respectively, the south-north and east-west directions. Scans were normalised individually in order to make faint and weak emission visible in the same plot. The bright features, shown by dark shading, are seen to move systematically southward (b), but have a succession of mobile and stationary phases in the east-west direction (a). The onset of the type IV emission appears later at lower frequencies, as can also be seen in the NRH movie (Movie 01).
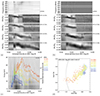 |
Fig. 5. First moving type IV burst: Time histories of the 1D brightness temperature scans projected onto the solar east–west (a) and south–north (b) directions at four NRH frequencies with the whole-Sun dynamic spectrum (a) and its time derivative (b) in the top panels. Dark shading of the 1D images means bright emission. The overplotted white lines show the positions of the brightest emission. The time histories of the peak brightness temperatures, scaled to a common beam width, are overplotted in (c) on the X-ray count-rate spectrum. Panel (d) shows the peak positions in the course of the event. The source motion proceeds south-eastward from the upper right to the lower left (see online Movie 01). |
The peak brightness temperature of the moving radio source was extracted from each NRH image (10-second integration), together with its position in projection on the solar disk. The peak position is the intensity-weighted average of the identified peak and its eight neighbours, and is referred to as the ‘centroid position’ in the following. The white lines overlaid on the 1D image time histories (Figs. 5a,b) show how the centroid positions evolve. At high frequencies the type IV source is at a stable location for a few minutes before starting its motion. Successive centroid positions at the different frequencies are displayed in Fig. 5d. At the highest frequencies (blue and green plus-signs) the source motion may have a westward component early on, but it rapidly turns south-eastward. The late eastward motion (after 12:40 UT, when the source reaches the south-north position –0.2 R⊙) is clearly seen at 151 and 173 MHz (red and orange plus-signs). Comparison with the AIA/NRH movie (Movie 02) shows that the radio source remains consistent with a location at the top of the erupting magnetic structure. The projected speed during its south-eastward motion was measured in the range 120 km s−1 at the high NRH frequencies to 200 km s−1 at the low frequencies. These values are the averages inferred from linear fits to the trajectories of the centroid positions. Like the filament material, the radio sources move in a direction that deviates strongly from the radial.
2.5.2. Time evolution of the brightness temperature and relationship with X-rays
Time histories of the peak brightness temperatures at the NRH frequencies are overplotted in Fig. 5c on the count-rate spectrum in X-rays (dark shading shows high count rates, with logarithmic scaling). In order to account for the averaging effect of the antenna beam, which increases with decreasing frequency, the brightness temperatures at the individual frequencies ν were scaled by multiplying with (ν/150 MHz)2. The type IV emission consists in a succession of bursts, starting with an emission between 12:05 and 12:18 UT that has similar time profiles between 432 and about 300 MHz. During this time the source moves both in the southward and the eastward direction. The scaled brightness temperature decays faster at the higher frequencies. The broadband radio emission decays to a plateau at 408 and 432 MHz, which is less clearly seen at frequencies 327–228 MHz because of the slower decay of the previous emission. After the plateau (12:25 UT) the emissions between 432 and 327 MHz gradually fade from view.
The moving type IV burst occurs together with X-ray emission throughout the nominal 5–35 keV detector channels of STIX. Figure 6 shows the brightness-temperature time profiles at the highest (blue) and lowest (red) NRH frequency overplotted on X-ray time profiles in the ranges 5–7 keV (a) and 10–12 keV (b). The 432 MHz emission rises with the 10–12 keV count rate and decays with the 5–7 keV count rate. The close correspondence argues that the radio and X-ray emissions result from a common release of non-thermal electrons into the magnetic structure. This differs from the general interpretation that attributes X-rays at those energies to a hot plasma in flares. However, evidence that non-thermal electrons may dominate the X-ray emission to photon energies as low as 5 keV is reported in a microflare by Glesener et al. (2020).
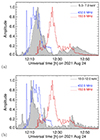 |
Fig. 6. Comparison of radio brightness temperature profiles at 432 MHz (blue curve) and 151 MHz (red) with the X-ray count rates in two nominal energy ranges (black curve and grey-shaded background). The minimum value over the plot time range was subtracted from each light curve, which was then normalised to its maximum. |
The time evolution is different at 173 and 151 MHz: the emission rises gradually to a peak between 12:24 and 12:26 UT, and then (between 12:27 and 12:33 UT) decays to a plateau, while the brightness temperature in the 432–228 MHz range fades away with a similar time constant (Fig. 5c). There is no X-ray counterpart to the rise to maximum at 151 and 173 MHz. However, the low-frequency plateau is accompanied by a new, though weaker, enhancement of the X-ray emission. These similarities suggest that the moving type IV emission across the entire NRH band comes from a common electron population. A possible explanation of the radio and X-ray timing is that electrons are released into the expanding magnetic structure in different episodes, but that the conditions for emission at low radio frequencies are established with some delay. A gradually decreasing ambient electron density in the expanding magnetic structure could for instance mean that the electron plasma frequency is initially so high that no plasma emission is produced at 151 and 173 MHz in the early phase or that gyrosynchrotron emission is Razin-suppressed.
We note that different episodes in the time histories of the brightness temperature (Fig. 5c) correspond to different episodes of the source kinematics (Fig. 5a). The plateaus of emission at high and low frequencies occur at different times. In both time intervals the source ceases its eastward motion. The final decay of the low-frequency emission goes along with the purely eastward orientation of the source motion. This suggests that the source motion may not only be the result of the expansion of the confining magnetic structure, but also of re-arrangements in the non-thermal electron population.
2.5.3. Brightness temperature spectra
Spectra of the scaled peak brightness temperatures of the moving type IV source at selected times are displayed in Fig. 7. The brightness temperatures were measured at the peak position at each frequency, as explained in Sect. 2.5.1. The different locations of the source centroids at different frequencies introduce a distortion, which is, however, small because the distances are smaller than the apparent source sizes, and because the sources themselves are probably not fully resolved so that the brightness temperatures are smeared out. The first spectrum (12:09:15 UT) was taken during the early rise of the high-frequency emission, the second (12:14:25 UT) during the flat maximum. At these early times the spectra decrease at the high frequencies (408, 432 MHz) and are rather flat between the low-frequency cutoff and 327 MHz. As time proceeds, the emission increases at the lower frequencies and makes the spectrum approach a power law. The shape of a power-law is conserved during the remainder of the type IV burst, with a slope in the range 6–7 and a gradual decrease in time at all frequencies. The ORFEES spectrum with 0.1 s time resolution shows short narrowband bursts superposed on these average broadband spectra. They appear after 12:13 UT and gradually become more numerous.
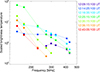 |
Fig. 7. Spectra of the scaled peak brightness temperature of the moving type IV source at selected times (NRH; 10 s integration). |
The bursts can be identified in the time-integrated dynamic ORFEES spectrum in Figs. 5a,b, but are better visible in the spectrum with the full 0.1 s resolution in the top panel of Fig. 9a, which is addressed in more detail in Sect. 2.6. On occasion the bursts cluster in chains, which may drift in frequency at a rate of a fraction of MHz/s. The duration and bandwidth of the bursts and the clustering in chains are typical of type I bursts observed during noise storms (Elgarøy 1977; Mercier & Trottet 1997; James & Subramanian 2018). The bursts are emitted at the position of the moving type IV source, follow the drift of the continuum towards lower frequencies, and leave the ORFEES frequency range near 12:29 UT.
2.6. Burst groups
The 1D time histories in Figs. 5a,b show that different phases of the moving type IV burst are accompanied by other burst groups. Between 12:09 and 12:14 UT a group is observed at all NRH frequencies north-eastward of the type IV source. At 432 MHz bursts are seen north-westward of the type IV source from 12:17 to 12:21 UT. ORFEES shows them at frequencies above 300 MHz. From 12:39 to 12:43 UT a third group is observed at the lower NRH frequencies (228 and 151 MHz in the figure).
2.6.1. Burst group 12:09–12:14 UT
This early burst group is most prominent at frequencies below 400 MHz (Figs. 5a,b). The time interval 12:09–12:11 displayed in Fig. 8 shows a more detailed view, which is representative of the whole group. In the high-frequency part of the time-differenced dynamic spectrogram (a) broadband modulations are seen, which extend down to at least 300 MHz near 12:10:40 UT. They are emitted by the type IV source, which is not yet moving. In Figs. 5a,b its motion becomes discernible after 12:12 UT in the east-west direction, and a little earlier in the south-north direction. The linear fit to the peak coordinates of the source in the interval 12:11–12:20 UT intersects the average previous position around 12:12 UT (east-west) and 12:10 UT (south-north), respectively. The type IV source hence starts its motion during the burst group.
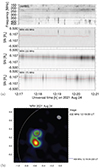 |
Fig. 8. Time-differenced dynamic spectrum during part of the burst group 12:09–12:14 UT (a; dark shading shows increasing flux density) and the source configurations (b, c) during the first (∼12:09:35 UT) and third (∼12:09:46 UT) burst attaining the low-frequency border of the dynamic spectrum in (a). Time resolutions 1 s (ORFEES). The sources in (b, c) are represented by iso-intensity contours at half-maximum (NRH images with 0.25 s integration) at 228, 173, and 151 MHz overplotted on an image of the type IV source at 432 MHz (integration 10 s). The tilted ellipses near the upper right corner of the plots show the half-maximum levels of the interferometric beam. |
Besides the broadband modulations, Fig. 8a shows two types of bursts. Bursts in the range 200–400 MHz have short durations and sharp cutoffs at low and high frequencies. Bursts below 200 MHz last longer and extend beyond the ORFEES frequency range. They look like the high-frequency parts of type III bursts, but are not detected below 80 MHz by the e-Callisto or NDA spectrographs. This suggests that they are rather of type J; in other words, they are emitted by electron beams in extended closed magnetic structures.
The NRH images with the highest available time resolution (0.25 s) show that most band-limited high-frequency bursts (400–200 MHz, say) are emitted in the type IV source. The low-frequency type III-shaped bursts come from two sources, displayed in Figs. 8b,c: the first burst (b; 12:09:35 UT) originates near the type IV source. The sources indicate a magnetic structure that bends away to the south from the parent active region. The burst has a rather sharp time profile, unlike most later bursts. Figure 8c shows a map during the diffuse burst at 12:09:46 UT. Its sources at 173 and 151 MHz are north-eastward of the type IV source at 432 MHz. They are seen on top of the eastern source at 228 MHz, suggesting that the parent magnetic structure points in the observer’s direction. The contour at 228 MHz shows a double source. The western component is the type IV burst, and the eastern one the type III-shaped burst. The band-limited bursts at higher frequencies occur mostly in the type IV source, but at frequencies between 228 and 299 MHz some bursts are indeed seen to occur simultaneously in the two sources. The eastern burst source also appears as a distinct feature north-eastward of the type IV source in the AIA/NRH movie (Movie 02) from 12:10 to 12:12 UT. The comparison with the trajectory of the filament shows that the type III-shaped radio bursts occur on the eastern flank of the erupting structure.
2.6.2. Burst group 12:17–12:21 UT
The dynamic spectrogram in the top panel of Fig. 9a displays two groups of short bursts between 12:17 and 12:21 UT: a group of broadband, but band-limited bursts above 300 MHz, and narrowband bursts below 250 MHz, which we identified as type I bursts in Sect. 2.5.3. The three time histories of 1D images projected on the solar south-north direction at 408, 228 and 173 MHz in Fig. 9a show the source locations, with the track of the moving type IV source derived from the 10 s integrated data superposed as a red line: the low-frequency bursts (173, 228 MHz) come from the moving source, but the high-frequency bursts (408 MHz) come from a source located north of the moving one. The east-west positions of the two burst groups are confounded, and are not shown here. Figure 9b shows the NRH image at 432 MHz taken during the bright high-frequency burst at 12:19:05 UT, with the overlaid half-maximum intensity contour at 408 MHz. The southern source in the image is the moving type IV source. The northern source in the 432 MHz image, which is the brightest source at 408 MHz, emits the burst. This source is also seen in the AIA/NRH movie (Movie 02) between 12:19 and 12:21 UT. It is located above the leading part of the parent active region.
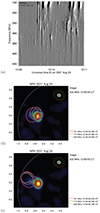 |
Fig. 9. Dynamic spectrum and source location during the high-frequency burst group 12:17–12:21 UT. (a) ORFEES dynamic spectrum using 0.1 s time resolution (top panel; grey levels graded from 0.99 to 1.5 times the pre-event background, logarithmic scale), and the corresponding 1D images at three frequencies (NRH, 0.25 s integration). The overplotted red line marks the peak positions of the first moving type IV source (NRH, 10 s integration). (b) Map of the burst at 12:19:04 UT (iso-intensity contour at half-maximum at 408 MHz overplotted on the simultaneous image at 432 MHz; 0.25 s integration). |
At the time of this burst group the eastward motion of the moving source ceases at high frequencies (Fig. 5a). The southward motion continues some minutes, before also slowing down (Fig. 5b).
2.6.3. Burst group 12:39–12:43 UT
In the dynamic spectrum in Fig. 10a the frequency range of ORFEES comprises some weak diffuse bursts, which are the high-frequency parts of type III bursts more clearly seen below 100 MHz by the Glasgow e-Callisto station and by NDA. Several early bursts in the ORFEES group merge into one or two bursts detected by NDA, and then into a single type III burst observed by Wind/WAVES. The latter shows that electron beams released in the corona at this time escape into the heliosphere. This burst group is accompanied by X-ray bursts observed up to 15 keV by SO/STIX (Fig. 5c). In Fig. 10b iso-intensity contours at half-maximum during one of these bursts, mapped with 0.25 s integration at 151, 173 and 228 MHz, are overlaid on a time-integrated image at 228 MHz, where the dominant source is the moving type IV burst, with a weak secondary source above the active region. The type III burst contours project to the vicinity of the moving type IV source. Since the NRH observes the type III bursts close to their starting frequency, this suggests that the electron beams are not released in the parent active region, but rather from the erupting magnetic structure.
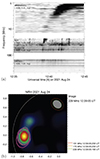 |
Fig. 10. Dynamic spectrum and source location during the low-frequency burst group 12:39–12:43 UT. (a) Broadband dynamic spectrum. (b) Map of the burst at 12:39:05 UT (iso-intensity contour at half-maximum at 228, 173, 151 MHz overplotted on the time-integrated image (10 s) at 228 MHz. |
The burst group occurs again at about the time when the source kinematics changes: Figs. 5a,b show that the southward motion ceases at 151 MHz at the end of the burst group, while the eastward motion resumes.
2.7. The second moving type IV burst: 12:40–13:55 UT
For completeness we briefly describe in this section the second moving type IV burst. The movie (Movie 02) illustrates this description. While the first moving type IV emission is fading away, a new source appears since 12:40 UT at 228, 173 and 151 MHz above the northern flank of the erupting magnetic structure visualised by the absorbing material at 30.4 nm and the radio brightness depression. The movies show that this source gradually broadens towards the eastern direction, and then a source detaches from it and follows an essentially eastward-directed trajectory. Linear fits to the successive centroid positions between 13:00 and 13:30 UT at 228 MHz, 13:00 and 13:52 UT at 173 and 151 MHz show a uniform eastward motion at a projected speed of 140–160 km s−1. The brightness temperature is slightly higher at 151 than at 173 MHz between the start and about 13:18 UT and about five times weaker at 228 MHz. Thereafter the brightness temperature increases at all frequencies until 13:30 (maximum 6 ⋅ 106 K at 151 MHz). The decay phase is observed until 13:24 UT at 228 MHz, 13:50 UT at 151 and 173 MHz, with a faster decrease of the brightness temperature at the higher frequencies (i.e. a steepening spectrum).
The motion of this source is clearly different from that of the first moving type IV burst and has no obvious relationship with the south-eastward expansion of the filament and the radio brightness depression. But the 30.4 nm AIA images show discrete eastward-moving features in the lower layers of the northern branch of the erupting filament at the same time. This eastward motion looks like another episode of instability of the same erupting magnetic flux rope.
A stationary type IV burst is observed since 13:29 UT above the leading part of the parent active region. It establishes itself rapidly at all NRH frequencies with a typical columnar structure (see Salas-Matamoros & Klein 2020, and references therein).
The moving type IV source is too weak to be detected by ORFEES, but a broadband emission with some bursts overlaid is observed by NDA in the range 50–25 MHz (Fig. 1a) between about 13:30 and 14:30 UT. This is actually the strongest emission observed by NDA during the event. It may be the low-frequency part of either the moving or the stationary type IV burst seen at NRH frequencies. There is no trace at frequencies below 16 MHz that electrons escape to the heliosphere in relation with this emission.
Onset times and initial solar release times of the three electron events observed by SO/EPT.
2.8. Energetic electrons in the heliosphere
The picture developed from the X-ray, EUV and coronal radio observations is that non-thermal electrons confined in an erupting magnetic structure emit the moving type IV burst. The first two burst groups (12:09–12:13 and 12:17–12:21 UT) indicate two episodes of electron release near the base of the flux rope. The third group (12:39–12:43 UT) comprises a type III burst at frequencies below 10 MHz, which shows that energetic electrons escape to the heliosphere at this time.
Non-thermal electrons are indeed detected in the heliosphere by Solar Orbiter. The EPT data have a time resolution of 1 second. Energy channels extend from 33 keV to 471 keV with widths of a few keV that increase with increasing energy. Since count rates were weak, we integrated over 31 s and over four adjacent energy channels. The count rate time histories in the four lowest integrated energy ranges, normalised to the peak value, are plotted in Fig. 11a. The abscissa is the time of detection at the spacecraft. The time histories show two successive electron events. Each lasts about ten minutes. In dynamic spectra of the STEP and EPT data (Fig. 12a) the onset is clearly delayed at lower energies. The delay is also seen in the time histories of Fig. 11a. Out of the four electron detectors of EPT only the sunward-looking ones detected these electrons. The directivity and the time delays demonstrate that the two events are from distinct electron releases at the Sun. They are actually preceded by a very weak first release, which corresponds to the weak enhancement starting shortly before 12:10 in Fig. 11a. It has a clear signature in the low-energy part of the dynamic spectrum of Fig. 12a. We refer to these three electron events as events 1–3 in the following. Their spectra taken around the time of maximum, displayed in Fig. 12b, show comparable differential electron fluxes at a few keV during the first and second event, while the third event is more than an order of magnitude stronger. The differences decrease with increasing energy. No enhanced fluxes of energetic protons or ions were observed.
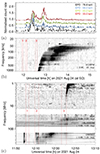 |
Fig. 11. Time histories of the electron events (a) and radio and Langmuir wave emission observed at Solar Orbiter (b) and broadband radio spectrum seen from the terrestrial viewpoint (c) on 2021 August 24. (a): Count rates of energetic electrons in different channels (Solar Orbiter/EPD/EPT). (b): Dynamic spectrum of the hectometric-to-kilometric type III burst and Langmuir waves (Solar Orbiter/RPW). The time given is the time at the spacecraft. Horizontal bands in (b) are residuals of radio interference. The vertical red lines in (b) are the initial solar release times of the three energetic electron events, to which the photon travel time of 320 s from the Sun to Solar Orbiter has been added. (c): Dynamic radio spectrum as seen from 1 AU (as Fig. 1). Red vertical lines show the initial release times of the electron events with added photon travel time 500 s. |
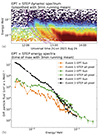 |
Fig. 12. Dynamic and peak energy spectra of the electron events observed by the Solar Orbiter/EPD suite on 2021 August 24. (a) Dynamic spectrogram (EPT and STEP detectors). The data were smoothed by a running mean over 3 min. The magenta lines show the ideal dispersion for electrons injected at the earliest (solid lines) and latest (dotted lines) SRT times given for each event in Table 1. (b) Spectra of the differential electron flux at the maxima in each detector channel. A pre-event background taken 30 minutes before the first event was subtracted. |
A type III burst is also observed by Solar Orbiter/RPW (Fig. 11b). RPW detects the burst at 1 MHz since 12:39 UT (time at the spacecraft), followed by a second burst at frequencies below 500 kHz. As Solar Orbiter is at heliocentric distance 0.64 AU, electromagnetic waves take three minutes more to reach 1 AU than to reach Solar Orbiter. The first type III burst observed at 1 MHz by RPW is hence the one seen near 12:42 UT at Wind. When the radio emission reaches the local plasma frequency at Solar Orbiter (about 40 kHz, near 13:35 UT), Langmuir waves are observed as a series of bright narrowband emissions (13:35–13:45 UT). A short period of Langmuir waves is observed near 13:09 UT, too, but without a fundamental type III burst.
The detection of Langmuir waves shows that Solar Orbiter is well connected to the region where the electrons emitting the type III burst are released. This is not surprising, since the eruptive event on the Sun is located about 34° west of the central meridian of the spacecraft. The measured solar wind speed is slowly increasing from 380 to 400 km s−1 at the time of the electron events7. For a speed of 400 km s−1 the Parker spiral is 0.68 AU long and intercepts the solar wind source surface about 40° west of the central meridian of the spacecraft (i.e. 6° west of the active region of interest).
In order to determine the onset times of the electron events we evaluated a pre-event background level in each electron detector channel of EPT as the average count rate between 10:30 and 11:30 UT. The onset times of the three events were estimated by visual inspection of the time histories in different detector channels and by the backward extrapolation to the pre-event background of a linear fit to the logarithm of the early rise. The average electron velocity in each nominal energy channel was used to map the individual onset times back to the Sun. The onset times inferred from the two methods are listed in Cols. 2 and 3 of Table 1. The error quoted in Col. 3 is the uncertainty of the time of background interception due to the statistical uncertainty of the fit. The mean velocities in the relevant energy channels and the resulting travel times along 0.68 AU are listed below the Table. The travel times were subtracted from the extremes of the onset times in Cols. 2 and 3 to yield the initial solar release times (SRT). They are listed in Col. 4, with 500 s being added to make the release times comparable with the timing of electromagnetic observations at 1 AU. The lines in magenta overplotted onto the dynamic spectrum in Fig. 12a show the ideal dispersion for electrons injected at the earliest (solid lines) and latest (dotted lines) initial solar release times (without adding 500 s) in the energy range 33.0–78.8 keV. The dotted lines, which were inferred from the visual identification of the event start in EPT channels, are indeed close to the visual onset of the electron events in the dynamic spectrum, while the solid lines appear earlier, because they mark the earliest possible start of the initial solar release derived from the backward extrapolation of the rise-time profile.
The initial solar release times referred to photon arrival times at 1 AU are in the ranges 12:09–12:13 UT (event 2, based on energy channels 33–78.8 keV) and 12:36–12:41 UT (event 3). This timing relates event 2 to the start of the moving type IV burst and the accompanying burst group 12:09–12:14 UT, and event 3 to the burst group 12:39–12:43 UT with the low-frequency type III burst. The initial solar release of the weak event 1 is estimated at 12:00–12:03 UT. Because of the weak signal this estimate is rather uncertain. The time intervals of initial electron release are overplotted on the dynamic radio spectra observed at Solar Orbiter and at 1 AU in Figs. 11b,c.
Event 3 is a typical impulsive electron event, accompanied by local Langmuir waves and type III radio emission that approaches the local plasma frequency at the time when the Langmuir waves start. It is the more intriguing that there is no type III emission with event 2, which looks similar in the EPT channels. The Langmuir waves detected at Solar Orbiter near 13:35 UT start 62–67 min after the initial solar release of the electron event 3 (Table 1, without adding 500 s!). With the same delay Langmuir waves associated with event 2 would be expected to start between 13:03 and 13:12 UT. This is consistent with the short burst at 13:09 UT, which suggests that unstable electron beams do accompany event 2, without giving rise to radio emission.
3. Discussion
3.1. Summary of observational results
In this work we studied a small eruptive solar flare from a simple active region (β-configuration) with the aim of shedding light on how the radio sources, which mark where non-thermal electrons are seen in the corona, are related to the erupting magnetic structures and to near-relativistic electrons detected in the heliosphere. We summarise our findings as follows:
-
The first signature of the event is an impulsive flare phase observed from X-rays to radio frequencies, with a cutoff near 70 MHz (Sect. 2.3). During the common phase of radio and X-ray emission, the radio bursts show bidirectional drifts at frequencies above about 300 MHz (i.e. evidence of upward and downward-propagating electron beams), and at lower frequencies type J bursts, which signal electron beams propagating in closed large-scale magnetic structures. At the end of the impulsive phase four type III bursts are observed between 400 and 144 MHz, without counterpart at X-rays or radio waves below 100 MHz.
-
The eruption comprises a CME and an embedded filament. At 30.4 nm wavelength the filament has two branches expanding from the parent active region. The motion is mainly directed south-eastward, meaning it is strongly non-radial for a parent active region in the north-eastern solar quadrant (Sect. 2.4). The region delimited by the two branches of the filament at 30.4 nm wavelength forms a brightness temperature depression at decimetric and metric wavelengths.
-
A moving type IV burst is observed at all NRH frequencies. The source moves out between the two branches of the filament material, at larger projected distance from the parent active region than this material, with average projected speeds of 100–200 km s−1 that increase with decreasing frequency. The projected average velocity vector is nearly orthogonal to the projection of the radial direction. The source geometry suggests that the radio source is located at the top of the erupting magnetic field structure (Sect. 2.5.1).
-
The moving radio source keeps a constant diameter during the entire emission at all frequencies (Sect. 2.4).
-
While the radio source moves outward with the filament material, its kinematics has irregularities, with periods of a pure southward motion and others where the source moves south-eastward (Sect. 2.5.1).
-
Periods where the kinematics changes are accompanied by groups of short radio bursts (Sect. 2.6). The source motion starts during the first group, which comprises bursts of types J and III that are tracked down to frequencies of about 70 MHz. The second consists of band-limited bursts (NRH: 408, 432 MHz) at the time when the eastward motion ceases at those frequencies. Both groups occur in the parent active region, at the flank and outside of the erupting magnetic structure outlined by the filament and the moving type IV source. The third group comprises type III bursts observed by the NRH between 228 and 151 MHz near their start frequency. The source is found near the moving type IV burst source (i.e. near the top of the erupting magnetic structure). This burst group extends to lower frequencies into the sole type III burst observed at decametric-to-hectometric wavelengths (frequency < 16 MHz) during the event.
-
The moving type IV radio emission is accompanied by X-ray emission observed between 4 and a few tens of keV (Sect. 2.5.2), which follows a similar time evolution as the higher NRH frequencies (300–432 MHz).
-
The mean brightness temperature spectrum of the moving type IV burst (integration 10 s) has a broad bandwidth with a low-frequency cutoff that is initially in the range of the NRH observations (about 300 MHz) and then gradually drifts towards lower frequencies. In the first minutes the spectrum of this continuum is rather flat. As the lower frequencies start to become visible, it adopts a power-law shape with a roughly constant spectral index in the range 6–7 until the emission disappears. During part of the time, subsecond bursts with bandwidths of a few MHz appear scattered across the frequency range of the continuum. On occasion they cluster in chains with overall slow frequency drift, similar to type I bursts in noise storms (Sect. 2.5.3).
-
After this moving type IV source fades away, a second one is observed at 228, 173 and 151 MHz propagating eastward together with absorbing material in the north-eastern leg of the filament at λ = 30.4 nm. The relationship with the overall eruption is less clear than in the previous moving source. The kinematics of the filament material suggest a new episode of instability in the erupting magnetic structure. Shortly afterwards, a stationary type IV burst establishes itself with a projected location near the active region.
-
The eruptive event is accompanied by three impulsive and strongly collimated electron events observed by Solar Orbiter, which is at about 6° longitude of the nominal Parker spiral through the parent active region (Sect. 2.8). The first event is very weak. Its onset time is uncertain, but not inconsistent with electron release during the impulsive flare phase. The onsets of the two later events map back, within observational uncertainties of a few minutes, to the first and third of the three groups of short bursts that accompany the moving type IV emission. The third, and probably also the second electron event are accompanied by Langmuir waves detected at Solar Orbiter. But only the third event in the series, which has the most intense energy spectrum below 10 keV, produces a type III burst at decametric to hectometric wavelengths.
3.2. Elements of interpretation and discussion
3.2.1. The magnetic configuration
The basic building block of a solar eruptive event is a magnetic flux rope (e.g. Cremades & Bothmer 2004; Vršnak 2008; Schmieder et al. 2015; Janvier et al. 2015; Chen et al. 2020). In the pre-eruptive state the absorbing filament material outlines the lower layers and dips. We interpret the two diverging branches of filament material seen in the 30.4 nm images on 2021 August 24 as the legs of the flux rope. Their south-eastward motion is strongly non-radial, since the parent active region and filament are located in the north-eastern quadrant. As illustrated by PFSS extrapolations8, the open field lines of the neighbouring north-polar coronal hole bend towards the equator above the active region where the filament erupts. Such a magnetic configuration is shown by a number of studies to be at the origin of non-radial motions of CMEs and erupting filaments (e.g. Panasenco et al. 2013; Sieyra et al. 2020, and references therein), due to a magnetic pressure gradient towards the coronal hole (see also Aulanier et al. 2010). The gradual increase of the eastward motion of the filament as it approaches the solar equator and the final eastward motion of the moving type IV source can be explained by the decreasing equatorward magnetic pressure of the coronal hole.
Depressions of the thermal radio emission in solar eruptions were studied by Marqué and coworkers (Marqué et al. 2001, 2002). In his comprehensive analysis of radio emissions from quiescent filaments Marqué (2004) shows that the structure and intensity of the brightness depressions can be understood by the reduced bremsstrahlung emission from the filament cavity, due to its lower electron density than in the ambient corona. He also shows an example (his Fig. 8) where the boundaries of the moving brightness depression transit into those of the cavity seen in white-light observations. We do not pursue the analysis of the depression in the present work, but consider its observation as an independent confirmation of the motion of the erupting magnetic structure derived from the EUV images.
The location of the source of the moving type IV burst then suggests that the emitting electrons are confined near the top of the magnetic flux rope. The frequency dispersion of the centroid locations is much smaller than the overall size of the flux rope during its expansion. If the radio waves are emitted at the electron plasma frequency or its harmonic, as argued in Sect. 3.2.3, this frequency dispersion can be qualitatively understood by radio emissions at different density levels around the top of the flux rope with a density gradient directed towards the parent active region.
Moving type IV bursts from the top of erupting magnetic structures traced by filaments and prominences were reported in earlier case studies (Gopalswamy & Kundu 1989; Klein & Mouradian 2002; Vršnak et al. 2003; Raoult-Barbezat & Klein 2005). The latter show a similar configuration to the 2021 August 24 event, with the radio source in between two legs of the erupting prominence (their Fig. 2) and a consistent height-time trajectory (their Fig. 3). Bain et al. (2014) also report an overall association between the moving type IV source and filament material, but the radio source is more complex than in the present event. Vasanth and coworkers (2016; 2019) conclude similarly that the moving type IV sources in their events are located in the erupting flux rope, which they identify with plasma structures observed in hot EUV lines and later with the core of the CME in coronographic images. However, Pick et al. (2005) observe a single outward-moving type IV source to project onto the legs of a loop-shaped structure in SoHO/EIT 19.5 nm images, and Ramesh et al. (2013) show their sources to project onto the legs of CMEs in coronographic images. In the event studied here the second moving type IV burst is also seen in the leg of the erupting structure, although the association with a discrete absorbing feature at 30.4 nm suggests that the geometry and kinematics are more complex than the steady outward motion of a single magnetic flux rope. Morosan et al. (2020) attempt a 3D reconstruction of an event with multiple moving radio sources. The radio source location in the 2021 August 24 event may hence not be the only possible one for a moving type IV burst. But the simplicity of the first moving type IV burst and the availability of high-cadence EUV imaging give an unusually clear hint towards the magnetic configuration in this event.
The spatial restriction of the radio source around the top of the flux rope suggests that the radio-emitting electrons are confined. The source is in the typical ‘isolated source’ category identified by the early Culgoora observations (Smerd & Dulk 1971; Stewart 1985). Magnetic confinement near the top of a magnetic flux rope can be envisaged due to the twisted magnetic field. In the present case the magnetic mirror effect may be strengthened by the compression at the interface with the overlying coronal hole, which imposes the southward motion of the flux rope. However, the similarity of time histories at radio and X-ray wavelengths, which was also observed by Pick et al. (2005), means that the bulk of the non-thermal electrons circulate between the radio source at the top and the X-ray source near and in the feet of the magnetic structure. The notion that the radiating electrons are magnetically confined in a ‘plasmoid’ as proposed by Smerd & Dulk (1971) does not apply here (see also the critical discussion of this concept by Robinson 1978).
Emissions by non-thermal electrons in the footpoints of a magnetic flux rope were recently reported at microwave (Chen et al. 2020) and hard X-ray wavelengths (Stiefel et al. 2023). The spectrographic imaging observations of Chen and coworkers with the Extended Owens Valley Solar Array demonstrate correlated brightenings of the microwave emissions from the footpoints and near the current sheet in the wake of the erupting structure. The microwave burst has a counterpart at dm-m-wavelengths, observed in the dynamic ORFEES spectrogram (see Fig. 5 of Klein 2021). It is hence the high-frequency component of a type IV burst. The analysis by Chen et al. strongly supports the idea that the electrons are accelerated in the current sheet. Judging from the X-ray emission in the 2021 August 24 event, the electrons have energies up to some tens of keV. They must lose energy by Coulomb collisions while propagating in the rather dense ambient medium necessary if the radio emission is plasma emission. We do not know well the energy required for the radio emission (see e.g. Sect. 4.4 of Salas-Matamoros & Klein 2020, in the context of stationary type IV bursts). The radio-emitting electrons might be re-accelerated in the compression region around the top of the flux rope. For instance, betatron acceleration produces an electron population with increased energy at high pitch angles, which favours magnetic trapping. The process has been argued to be at work in the Earth’s magnetotail (Fu et al. 2011; Zhong et al. 2020). While compression ratios able to explain the acceleration of electrons from the thermal background of about 100 eV are unlikely to occur, the re-acceleration of non-thermal electrons from the current sheet may still be possible around the compressed summit of the magnetic flux rope.
3.2.2. Destabilisation of the large-scale magnetic structure and electron acceleration
The type IV radio source starts moving during a group of fast-drift bursts (12:09-12:14 UT). This is clearly seen at the higher NRH frequencies (e.g. 432 MHz), where the type IV source exists at a stable position since a few minutes before the burst group. After the bursts the source moves outward at about constant projected speed. This suggests that the magnetic structure is accelerated at coronal heights ≲0.1 R⊙ above the photosphere for a duration that lasts not longer than the burst group, and which is accompanied by the acceleration of non-thermal electrons, similar to more energetic events (Temmer et al. 2010; Saqri et al. 2023), although this may not be the unique possible scenario (Wang et al. 2023). The correlation between CME acceleration and signatures of electron acceleration is usually interpreted in terms of electron acceleration in the wake of the rising magnetic structure, where a current sheet must form. In the present case, however, the radio bursts have two sources shown in Figs. 8b,c. The eastern one is well away from the type IV source, which at that early time is still confounded with the active region. This geometry is more consistent with acceleration outside the erupting magnetic structure than in its core. This location grants the electrons access to open magnetic field lines, as suggested by the type III-shaped dynamic spectra, and escape to the heliosphere, which makes them detectable at Solar Orbiter, as discussed below. Reconnection on the side of a magnetic flux rope that does not necessarily cause its eruption has been reported in MHD simulations (e.g. Aulanier 2014; Masson et al. 2019).
3.2.3. Constraints on the radio emission process
The brightness-temperature spectrum of the moving type IV burst derived from data with 10 s integration is broadband, with the signature of a rather sharp low-frequency cutoff that gradually drifts towards lower frequencies. While the spectrum is initially rather flat, it later adopts and maintains a power-law shape. This spectrum is consistent with gyrosynchrotron models discussed for other moving type IV bursts in most of the 20th century work (Dulk 1973) and more recently (Tun & Vourlidas 2013; Bain et al. 2014), as well as for other varieties of type IV bursts (Bastian et al. 2001; Maia et al. 2007; Carley et al. 2017; Mondal et al. 2020). However, this mechanism needs electrons of hundreds of keV, for which no complementary evidence exists in the 2021 August 24 event. For instance no gyrosynchrotron emission is detected at microwave frequencies, which is the typical trace of mildly relativistic electrons in large type IV bursts. The X-ray observations only show electrons out to a few tens of keV, which emit with a similar time profile as in the moving type IV source. Furthermore, during a large part of its brighter phase the moving type IV burst is accompanied by short narrowband bursts with the spectral characteristics of type I bursts, which are commonly attributed to coherent plasma emission. While we cannot exclude that the bursts and the continuum are seen at the same location only because the NRH does not resolve the sources (see e.g. the comparison of LOFAR and NRH observations of a type IV burst in Liu et al. 2022), plasma emission is a likely process in view of the arguments above. Plasma emission in moving type IV bursts is also advocated in other recent analyses. Ramesh et al. (2013) determined the thermal electron density in the moving type IV sources from coronographic observations to be as high as 8 ⋅ 1012 m−3, corresponding to an electron plasma frequency of 25 MHz. This would imply suppression of the gyrosynchrotron emission well into the frequency range where the Gauribidanur spectrograph and radioheliograph observed the emissions. Vasanth and coauthors (2016; 2019) underline difficulties to reconcile especially the frequency-dependent source locations with the incoherent gyrosynchrotron process, while Morosan et al. (2019; 2020) find the circular polarisation to be too strong for this interpretation.
The low brightness temperature of the continuum, well below 109 K in the 2021 August 24 event, can be understood in terms of incoherent plasma processes as advocated for noise storm continua (Robinson 1978; Melrose 1980; Benz & Wentzel 1981; Wentzel 1985, 1986), with some similarity to stationary type IV bursts (Salas-Matamoros & Klein 2020). The superposition of type I bursts reinforces the similarity with noise storms. It is noteworthy that in their original identification of type IV continua Boischot & Denisse (1957) took the absence of type I bursts as a defining criterion. The presence of such bursts in the 2021 August 24 event is therefore not typical. It is one more indication that the notion of type IV bursts comprises radio emissions in erupting magnetic configurations, but does not designate a unique emission process.
3.2.4. Energetic electrons in the heliosphere
Numerous historical observations have shown that impulsive electron events are accompanied by type III bursts at decametric and longer wavelengths, typically observed by space-borne spectrographs at frequencies below 20 MHz (Lin 1985; Ergun et al. 1998). They are associated with impulsive flares, but many weak events were reported without any observed flare signature in the low corona or chromosphere (see review by Lin 1985). This led to a simple picture of acceleration related to magnetic reconnection in the corona and direct escape to the heliosphere, where the electrons are detected whenever a spacecraft is on a field line that is directly connected to the acceleration region, and after a travel time that is determined by the length of the field line and the electron speed. Pitch angle scattering can prolong the travel time (Dröge 2000; Laitinen & Dalla 2019), but the first particles arriving at the spacecraft are usually thought to be those that suffered the least scattering.
However, many subsequent studies of larger events in terms of electron fluxes or flare importance revealed a more complex picture, where the first particles arrived at the spacecraft later than expected if they were accelerated together with X-ray or microwave-emitting electrons in the impulsive flare phase (Krucker et al. 1999). In some cases this delay can be explained by prolonged interplanetary travel paths, for instance within magnetic flux ropes (Kahler et al. 2011a,b; Gómez-Herrero et al. 2017; Wimmer-Schweingruber et al. 2023). But many studies conclude on the need of an acceleration process that is different from the one that accelerates hard X-ray and microwave-emitting near-relativistic and relativistic electrons in the impulsive phase of flares (Krucker et al. 1999; Klein et al. 2005; Wang et al. 2006, 2016; Dresing et al. 2021). Klein et al. (2005) found that events where the electron release into the heliosphere appears delayed are accompanied by metre-wave radio emission from non-thermal electrons that extends beyond the impulsive flare phase. Maia et al. (2007) discovered a close connection between the time profile of one electron event, once deconvolved from interplanetary propagation, and the type IV radio emission in the corona, which suggests a common origin of the radio-emitting electrons and those detected in space well after the impulsive flare phase.
The two most prominent electron enhancements on 2021 August 24 are typical impulsive events. They are unusually clearly connected in time with two events of electron acceleration in the corona identified by radio bursts at decimetre-to-metre-wavelengths. The initial electron releases and the radio burst groups occur, respectively, 10 and 40 minutes after the impulsive flare phase. The first of these two releases happens when a group of type III-shaped radio bursts is emitted on the eastern side of the erupting magnetic flux rope (Sect. 3.2.2) around the time when it starts to move outward. The second well-identified electron release occurs with bursts imaged by the NRH near their start frequency, which means near the place where the electron beams start to become unstable. Since the sources are near the top of the erupting flux rope confining the type IV-burst emitting electrons, a natural interpretation is that at this time the magnetic flux rope reconnects with ambient open magnetic field lines, so that confined electrons can escape or an independent episode of acceleration occurs. The southward-bending of the open magnetic field lines from the north-polar coronal hole and the southward motion of the erupting flux rope both favour the magnetic connection of the parent active region and the top of the flux rope to the ecliptic plane. Evidence for such reconnection events is provided in another case by Salas-Matamoros et al. (2016).
For this interpretation to work, the Solar Orbiter spacecraft must be magnetically connected to a region near the footpoint of the erupting flux rope during the first electron release (near 12:10 UT) and to a region near the top 30 min later. This is not contradictory, although these sites are distant from each other. The electrons of the first release have passed the region where the reconnection is presumed to occur well before the second release, and the information on the new magnetic configuration would arrive at the spacecraft well after the second electron release. The 2021 August 24 event illustrates that a given spacecraft may be connected to different acceleration regions in a given event even if the acceleration process is not spatially extended, such as a shock wave.
The spectral imaging observations presented here provide a strong argument in favour of the indirect access of energetic particles to the heliosphere as predicted by the MHD simulations of Masson and colleagues (2013; 2019), and which Schatten & Mullan (1977) proposed earlier to explain SEP events from poorly connected active regions. The release of particles from a reservoir in erupting magnetic structures had also been proposed based on observations of only the dynamic radio spectrum in the much more energetic eruption on 2021 Oct 28 (Klein et al. 2022). The delay of the solar release of electrons with respect to the impulsive phase observed on 2021 August 24 is comparable with the longest delays reported in earlier work (Krucker et al. 1999; Klein et al. 2005).
The two clear electron releases are preceded by a weak enhancement. Its timinig is not inconsistent with a solar release during the late impulsive flare phase. But it cannot be precise for such a weak event, where most of the electron flux is likely hidden in the background. While type III bursts are observed in the late impulsive phase at frequencies above 144 MHz (ORFEES), they have no counterpart at lower frequencies in the very sensitive NDA spectrogram. This suggests electrons in closed magnetic structures in the corona, but some electrons do escape into the heliosphere. They would probably not have been identified as an independent electron release if there had not been the two stronger subsequent events.
3.2.5. Impulsive electron releases and type III radio bursts
A remarkable feature of the electron observations at Solar Orbiter is that out of three impulsive events associated with the same parent activity only one is accompanied by a type III bust at dekametric-to-hectometric wavelengths (< 20 MHz). This cannot be explained by any directivity of the radio emission, since the same type III burst is observed by Wind and Solar Orbiter, which were separated in longitude by 77°. A noticeable difference is, however, that the electron spectrum (Fig. 12b) of the event with type III burst is ten times more intense below 10 keV than the two previous ones. 10 keV is also a typical transition energy between strongly beamed and strongly scattered electron populations (Lin 1985; Wang et al. 2011). In the event under study the electrons are strongly anisotropic throughout the observed energy range, but the measured difference in peak fluxes may explain why the beamed distribution of the third electron event leads to a more important growth of Langmuir waves.
An alternative interpretation of the isolated early Langmuir wave packet near 13:09 UT would be that the type III emission is at the harmonic of the local plasma frequency, and that no fundamental component is detected. Exclusive harmonic radio emission with Langmuir waves was reported by Henri et al. (2009). These authors found the inferred track of the leading edge of the invisible fundamental to attain the plasma frequency at the spacecraft at the time of a Langmuir wave packet. Inspection of Fig. 11b shows that the leading edge of the type III burst spectrum is indeed not far from twice the frequency of the Langmuir waves at 13:09 UT. But the exclusively harmonic interpretation of the leading edge is inconsistent with its subsequent smooth continuation to lower frequencies and the junction with the plasma frequency at the spacecraft at the time when the second, more sustained episode of Langmuir waves starts. The difference in electron fluxes below 10 keV seems to be the only observational hint to understand why the previous electron release was not accompanied by a type III burst.
4. Conclusion
The event on 2021 August 24 offers a set of particularly clear observations. They are relevant to the understanding of radio emission, electron acceleration, and electron transport in solar eruptive activity.
Two moving type IV bursts with unusually long duration were observed by the Nançay Radioheliograph. The combination with high-cadence EUV imaging from the Solar Dynamics Observatory allowed us to localise the radio sources with respect to an erupting filament that follows a strongly non-radial trajectory. We present a detailed analysis of the first moving type IV burst. The source is found at the top of the magnetic structure outlined by the filament and by a brightness depression in the radio images. Because of the association with the filament, we identify the erupting structure as a magnetic flux rope. The radio emission of the moving type IV burst consists of a broadband continuum and short narrowband bursts scattered across the continuum. Both features are emitted at the same location. The bursts argue in favour of a plasma emission process. The moving type IV emission is accompanied by X-ray bursts at energies up to a few tens of keV. Similarities in the time profiles in the two spectral ranges suggest a common origin of the electrons, which we propose are injected into the rising flux rope from acceleration regions in the current sheet behind.
The moving type IV burst is accompanied by two groups of fast-drift bursts including bursts of type III. Their localisation suggests magnetic reconnection on the flank of the erupting magnetic flux rope. The first group has its origin near the parent active region during the early acceleration of the flux rope, the second originates later near its top, well away from the parent active region. Both burst groups occurr at the times when electrons observed by Solar Orbiter are released at the Sun respectively 10 and 40 minutes after the first signatures of non-thermal electrons in the corona. We conclude that the electrons detected in space either escape from the erupting flux rope when it reconnects with ambient open field lines or are accelerated during those reconnection events.
Data availability
Movies are available at https://www.aanda.org
From Solar Mach (Gieseler et al. 2023), https://solar-mach.github.io/
NOAA/Space Weather Prediction Center report, https://www.solarmonitor.org/data/2021/08/24/meta/noaa_events_raw_20210824.txt
Quicklook plots at https://mssl.ucl.ac.uk/missions/solo_swa_quicklooks/, SWA_LL data.
Acknowledgments
The authors acknowledge the Observatories and institutions that provided the data for this study: (1) the Radio Monitoring site (secchirh.obspm.fr) and the Radio Solar Database of Paris Observatory (LESIA, Nançay Radio Observatory) for the data of NRH, ORFEES and NDA; (2) the teams of the NASA/Solar Dynamics Observatory (SDO) and the Atmospheric Imager Assembly (AIA), the data of which were retrieved from the Virtual Solar Observatory, and of the Wind/WAVES experiment; (3) the CLIMSO (Christian Latouche IMageur Solaire) project conducted at Pic du Midi Observatory by “Observateurs Associés” financed by the FIDUCIAL company in partnership with Observatoire Midi-Pyrénées; (4) the e-CALLISTO cooperation led by Institute for Data Science FHNW Brugg/Windisch, Switzerland and Istituto Ricerche Solari (IRSOL), Università della Svizzera italiana (USI), CH-6605 Locarno-Monti, Switzerland; (5) the STIX, RPW and EPD teams and their home institutions of the Solar Orbiter mission. Solar Orbiter is a space mission of international collaboration between ESA and NASA, operated by ESA. The SoHO/LASCO CME catalogue is generated and maintained at the CDAW Data Center by NASA and The Catholic University of America in cooperation with the Naval Research Laboratory. SOHO is a project of international cooperation between ESA and NASA. A. Kollhoff acknowledges support from the German Federal Ministry for Economic Affairs and Energy, the German Space Agency (Deutsches Zentrum für Luft- und Raumfahrt e.V., DLR) under grants 50OT0901, 50OT1202, 50OT1702, and 50OT2002. We acknowledge discussions with C. Marqué on radio signatures of filaments, with S. Masson on the interpretation of AIA observations, as well as S. Musset’s and N. Vilmer’s advice on STIX data, and A. Vecchio’s help with RPW data. We are indebted to the referee for careful reading and very helpful comments on the manuscript, and to the language editor.
References
- Aulanier, G. 2014, IAU Symp., 300, 184 [NASA ADS] [Google Scholar]
- Aulanier, G., Török, T., Démoulin, P., & DeLuca, E. E. 2010, ApJ, 708, 314 [Google Scholar]
- Bain, H. M., Krucker, S., Saint-Hilaire, P., & Raftery, C. L. 2014, ApJ, 782, 43 [Google Scholar]
- Bale, S. D., Reiner, M. J., Bougeret, J.-L., et al. 1999, Geophys. Res. Lett., 26, 1573 [NASA ADS] [CrossRef] [Google Scholar]
- Bastian, T. S., Pick, M., Kerdraon, A., Maia, D., & Vourlidas, A. 2001, ApJ, 558, L65 [Google Scholar]
- Benz, A. O., & Wentzel, D. G. 1981, A&A, 94, 100 [Google Scholar]
- Benz, A. O., Monstein, C., Meyer, H., et al. 2009, Earth Moon Planets, 104, 277 [NASA ADS] [CrossRef] [Google Scholar]
- Boerner, P., Edwards, C., Lemen, J., et al. 2012, Sol. Phys., 275, 41 [Google Scholar]
- Boischot, A. 1957, Acad. Sci. Paris C. R., 244, 1326 [NASA ADS] [Google Scholar]
- Boischot, A., & Denisse, J.-F. 1957, Acad. Sci. Paris C. R., 245, 2194 [Google Scholar]
- Bougeret, J.-L., Kaiser, M. L., Kellogg, P. J., et al. 1995, Space Sci. Rev., 71, 231 [CrossRef] [Google Scholar]
- Brueckner, G. E., Howard, R. A., Koomen, M. J., et al. 1995, Sol. Phys., 162, 357 [NASA ADS] [CrossRef] [Google Scholar]
- Carley, E. P., Vilmer, N., Simões, P. J. A., & Ó Fearraigh, B. 2017, A&A, 608, A137 [NASA ADS] [CrossRef] [EDP Sciences] [Google Scholar]
- Chen, B., Yu, S., Reeves, K. K., & Gary, D. E. 2020, ApJ, 895, L50 [NASA ADS] [CrossRef] [Google Scholar]
- Cremades, H., & Bothmer, V. 2004, A&A, 422, 307 [NASA ADS] [CrossRef] [EDP Sciences] [Google Scholar]
- Dresing, N., Warmuth, A., Effenberger, F., et al. 2021, A&A, 654, A92 [NASA ADS] [CrossRef] [EDP Sciences] [Google Scholar]
- Dröge, W. 2000, Space Sci. Rev., 93, 121 [CrossRef] [Google Scholar]
- Dulk, G. A. 1973, Sol. Phys., 32, 491 [Google Scholar]
- Duncan, R. A. 1981, Sol. Phys., 73, 191 [NASA ADS] [CrossRef] [Google Scholar]
- Elgarøy, E. Ø. 1977, Solar Noise Storms (Pergamon Press) [Google Scholar]
- Ergun, R. E., Larson, D., Lin, R. P., et al. 1998, ApJ, 503, 435 [NASA ADS] [CrossRef] [Google Scholar]
- Feng, S. W., Xie, H. X., & Misawa, H. 2024, ApJ, 964, 108 [NASA ADS] [CrossRef] [Google Scholar]
- Fu, H. S., Khotyaintsev, Y. V., André, M., & Vaivads, A. 2011, Geophys. Res. Lett., 38, L16104 [NASA ADS] [Google Scholar]
- Gergely, T. E., Kundu, M. R., Erskine, F. T., III, et al. 1984, Sol. Phys., 90, 161 [NASA ADS] [CrossRef] [Google Scholar]
- Gieseler, J., Dresing, N., Palmroos, C., et al. 2023, Front. Astron. Space Sci., 9, 384 [NASA ADS] [CrossRef] [Google Scholar]
- Glesener, L., Krucker, S., Duncan, J., et al. 2020, ApJ, 891, L34 [Google Scholar]
- Gómez-Herrero, R., Dresing, N., Klassen, A., et al. 2017, ApJ, 840, 85 [Google Scholar]
- Gopalswamy, N., & Kundu, M. R. 1987, Sol. Phys., 114, 347 [NASA ADS] [CrossRef] [Google Scholar]
- Gopalswamy, N., & Kundu, M. R. 1989, Sol. Phys., 122, 91 [NASA ADS] [CrossRef] [Google Scholar]
- Graham, D. B., & Cairns, I. H. 2015, J. Geophys. Res.: Space Phys., 120, 4126 [NASA ADS] [CrossRef] [Google Scholar]
- Hamini, A., Auxepaules, G., Birée, L., et al. 2021, J. Space Weather Space Clim., 11, 57 [NASA ADS] [CrossRef] [EDP Sciences] [Google Scholar]
- Heinzel, P. 2015, Astrophys. Space Sci. Lib., 415, 103 [NASA ADS] [CrossRef] [Google Scholar]
- Henri, P., Briand, C., Mangeney, A., et al. 2009, J. Geophys. Res.: Space Phys., 114, A03103 [NASA ADS] [CrossRef] [Google Scholar]
- James, T., & Subramanian, P. 2018, MNRAS, 479, 1603 [NASA ADS] [CrossRef] [Google Scholar]
- Janvier, M., Aulanier, G., & Démoulin, P. 2015, Sol. Phys., 290, 3425 [Google Scholar]
- Kahler, S. W., Haggerty, D. K., & Richardson, I. G. 2011a, ApJ, 736, 106 [NASA ADS] [CrossRef] [Google Scholar]
- Kahler, S. W., Krucker, S., & Szabo, A. 2011b, J. Geophys. Res.: Space Phys., 116, A01104 [Google Scholar]
- Kaiser, M. L., Kucera, T. A., Davila, J. M., et al. 2008, Space Sci. Rev., 136, 5 [Google Scholar]
- Kerdraon, A., & Delouis, J.-M. 1997, Lect. Notes Phys., 483, 192 [NASA ADS] [CrossRef] [Google Scholar]
- Klein, K.-L. 2021, Front. Astron. Space Sci., 7, 580445 [CrossRef] [Google Scholar]
- Klein, K.-L., & Mouradian, Z. 2002, A&A, 381, 683 [NASA ADS] [CrossRef] [EDP Sciences] [Google Scholar]
- Klein, K.-L., Krucker, S., Trottet, G., & Hoang, S. 2005, A&A, 431, 1047 [NASA ADS] [CrossRef] [EDP Sciences] [Google Scholar]
- Klein, K.-L., Musset, S., Vilmer, N., et al. 2022, A&A, 663, A173 [CrossRef] [EDP Sciences] [Google Scholar]
- Krucker, S., Larson, D. E., Lin, R. P., & Thompson, B. J. 1999, ApJ, 519, 864 [CrossRef] [Google Scholar]
- Krucker, S., Hurford, G. J., Grimm, O., et al. 2020, A&A, 642, A15 [NASA ADS] [CrossRef] [EDP Sciences] [Google Scholar]
- Kucera, T. A. 2015, Astrophys. Space Sci. Lib., 415, 79 [NASA ADS] [CrossRef] [Google Scholar]
- Kuijpers, J. 1980, IAU Symp., 86, 341 [NASA ADS] [Google Scholar]
- Kumari, A., Morosan, D. E., & Kilpua, E. K. J. 2021, ApJ, 906, 79 [Google Scholar]
- Kundu, M., Gopalswamy, N., White, S., et al. 1989, ApJ, 347, 505 [NASA ADS] [CrossRef] [Google Scholar]
- Laitinen, T., & Dalla, S. 2019, ApJ, 887, 222 [Google Scholar]
- Lecacheux, A. 2000, AGU Monogr., 119, 321 [NASA ADS] [Google Scholar]
- Lemen, J. R., Title, A. M., Akin, D. J., et al. 2012, Sol. Phys., 275, 17 [Google Scholar]
- Lin, R. P. 1985, Sol. Phys., 100, 537 [NASA ADS] [CrossRef] [Google Scholar]
- Liu, H., Zucca, P., Cho, K.-S., et al. 2022, Sol. Phys., 297, 115 [NASA ADS] [CrossRef] [Google Scholar]
- MacQueen, R. M. 1980, Roy. Soc. London Philos. Trans. Ser., 297, 605 [Google Scholar]
- Maia, D. J. F., Gama, R., Mercier, C., et al. 2007, ApJ, 660, 874 [NASA ADS] [CrossRef] [Google Scholar]
- Maksimovic, M., Bale, S. D., Chust, T., et al. 2020, A&A, 642, A12 [EDP Sciences] [Google Scholar]
- Marqué, C. 2004, ApJ, 602, 1037 [CrossRef] [Google Scholar]
- Marqué, C., Lantos, P., Klein, K.-L., & Delouis, J. M. 2001, A&A, 374, 316 [NASA ADS] [CrossRef] [EDP Sciences] [Google Scholar]
- Marqué, C., Lantos, P., & Delaboudinière, J. P. 2002, A&A, 387, 317 [NASA ADS] [CrossRef] [EDP Sciences] [Google Scholar]
- Masson, S., Antiochos, S. K., & DeVore, C. R. 2013, ApJ, 771, 82 [NASA ADS] [CrossRef] [Google Scholar]
- Masson, S., Antiochos, S. K., & DeVore, C. R. 2019, ApJ, 884, 143 [NASA ADS] [CrossRef] [Google Scholar]
- Melrose, D. B. 1980, Sol. Phys., 67, 357 [CrossRef] [Google Scholar]
- Mercier, C., & Trottet, G. 1997, ApJ, 474, L65 [NASA ADS] [CrossRef] [Google Scholar]
- Mondal, S., Oberoi, D., & Vourlidas, A. 2020, ApJ, 893, 28 [NASA ADS] [CrossRef] [Google Scholar]
- Morosan, D. E., Carley, E. P., Hayes, L. A., et al. 2019, Nat. Astron., 3, 452 [Google Scholar]
- Morosan, D. E., Palmerio, E., Pomoell, J., et al. 2020, A&A, 635, A62 [NASA ADS] [CrossRef] [EDP Sciences] [Google Scholar]
- Morosan, D. E., Kumari, A., Kilpua, E. K. J., & Hamini, A. 2021, A&A, 647, L12 [NASA ADS] [CrossRef] [EDP Sciences] [Google Scholar]
- Müller, D., St Cyr, O. C., Zouganelis, I., et al. 2020, A&A, 642, A1 [Google Scholar]
- Nindos, A. 2020, Front. Astron. Space Sci., 7, 57 [NASA ADS] [CrossRef] [Google Scholar]
- Panasenco, O., Martin, S. F., Velli, M., & Vourlidas, A. 2013, Sol. Phys., 287, 391 [Google Scholar]
- Pesnell, W. D., Thompson, B. J., & Chamberlin, P. C. 2012, Sol. Phys., 275, 3 [Google Scholar]
- Pick, M. 1986, Sol. Phys., 104, 19 [NASA ADS] [CrossRef] [Google Scholar]
- Pick, M., & Vilmer, N. 2008, A&ARv, 16, 1 [NASA ADS] [CrossRef] [Google Scholar]
- Pick, M., Démoulin, P., Krucker, S., Malandraki, O., & Maia, D. 2005, ApJ, 625, 1019 [NASA ADS] [CrossRef] [Google Scholar]
- Pick-Gutmann, M. 1961, Ann. Astrophys., 24, 181 [NASA ADS] [Google Scholar]
- Pitout, F., Koechlin, L., López Ariste, A., Dettwiller, L., & Glorian, J.-M. 2020, J. Space Weather Space Clim., 10, 47 [NASA ADS] [CrossRef] [EDP Sciences] [Google Scholar]
- Pulupa, M., & Bale, S. D. 2008, ApJ, 676, 1330 [NASA ADS] [CrossRef] [Google Scholar]
- Ramesh, R., Kishore, P., Mulay, S. M., et al. 2013, ApJ, 778, 30 [NASA ADS] [CrossRef] [Google Scholar]
- Raoult-Barbezat, A., & Klein, K.-L. 2005, ESA SP, 600, 164.1P [Google Scholar]
- Reid, H. A., & Ratcliffe, H. 2014, Res. Astron. Astrophys., 14, 773 [CrossRef] [Google Scholar]
- Robinson, R. D. 1978, Sol. Phys., 60, 383 [CrossRef] [Google Scholar]
- Rodríguez-Pacheco, J., Wimmer-Schweingruber, R. F., Mason, G. M., et al. 2020, A&A, 642, A7 [Google Scholar]
- Salas-Matamoros, C., & Klein, K.-L. 2020, A&A, 639, A102 [EDP Sciences] [Google Scholar]
- Salas-Matamoros, C., Klein, K.-L., & Rouillard, A. P. 2016, A&A, 590, A135 [NASA ADS] [CrossRef] [EDP Sciences] [Google Scholar]
- Saqri, J., Veronig, A. M., Dickson, E. C. M., et al. 2023, A&A, 672, A23 [NASA ADS] [CrossRef] [EDP Sciences] [Google Scholar]
- Schatten, K. H., & Mullan, D. J. 1977, J. Geophys. Res., 82, 5609 [NASA ADS] [CrossRef] [Google Scholar]
- Schmieder, B., Aulanier, G., & Vršnak, B. 2015, Sol. Phys., 290, 3457 [NASA ADS] [CrossRef] [Google Scholar]
- Sieyra, M. V., Cécere, M., Cremades, H., et al. 2020, Sol. Phys., 295, 126 [NASA ADS] [CrossRef] [Google Scholar]
- Smerd, S. F., & Dulk, G. A. 1971, IAU Symp., 43, 616 [NASA ADS] [Google Scholar]
- Stewart, R. T. 1985, in Solar Radiophysics: Studies of Emission from the Sun at Metre Wavelengths, eds. D. McLean, & N. Labrum (Cambridge, Great Britain: Cambridge University Press), 361 [Google Scholar]
- Stiefel, M. Z., Battaglia, A. F., Barczynski, K., et al. 2023, A&A, 670, A89 [NASA ADS] [CrossRef] [EDP Sciences] [Google Scholar]
- Temmer, M., Veronig, A. M., Kontar, E. P., Krucker, S., & Vršnak, B. 2010, ApJ, 712, 1410 [NASA ADS] [CrossRef] [Google Scholar]
- Trottet, G., Kerdraon, A., Benz, A. O., & Treumann, R. 1981, A&A, 93, 129 [NASA ADS] [Google Scholar]
- Tun, S. D., & Vourlidas, A. 2013, ApJ, 766, 130 [Google Scholar]
- Vasanth, V., Chen, Y., Feng, S., et al. 2016, ApJ, 830, L2 [NASA ADS] [CrossRef] [Google Scholar]
- Vasanth, V., Chen, Y., Lv, M., et al. 2019, ApJ, 870, 30 [Google Scholar]
- Vršnak, B. 2008, Ann. Geophys., 26, 3089 [CrossRef] [Google Scholar]
- Vršnak, B., Klein, K.-L., Warmuth, A., Otruba, W., & Skender, M. 2003, Sol. Phys., 214, 325 [CrossRef] [Google Scholar]
- Wang, L., Lin, R. P., Krucker, S., & Gosling, J. T. 2006, Geophys. Res. Lett., 33, L03106 [NASA ADS] [Google Scholar]
- Wang, L., Lin, R. P., & Krucker, S. 2011, ApJ, 727, 121 [NASA ADS] [CrossRef] [Google Scholar]
- Wang, L., Krucker, S., Mason, G. M., Lin, R. P., & Li, G. 2016, A&A, 585, A119 [NASA ADS] [CrossRef] [EDP Sciences] [Google Scholar]
- Wang, X., Song, H., Chen, Y., et al. 2023, ApJ, 957, 58 [NASA ADS] [CrossRef] [Google Scholar]
- Wentzel, D. G. 1985, ApJ, 296, 278 [NASA ADS] [CrossRef] [Google Scholar]
- Wentzel, D. G. 1986, Sol. Phys., 103, 141 [NASA ADS] [CrossRef] [Google Scholar]
- Wild, J. P., Smerd, S. F., & Weiss, A. A. 1963, ARA&A, 1, 291 [NASA ADS] [CrossRef] [Google Scholar]
- Wimmer-Schweingruber, R. F., Berger, L., Kollhoff, A., et al. 2023, A&A, 678, A98 [NASA ADS] [CrossRef] [EDP Sciences] [Google Scholar]
- Wuelser, J.-P., Lemen, J. R., Tarbell, T. D., et al. 2004, SPIE Conf. Ser., 5171, 111 [Google Scholar]
- Yashiro, S., Gopalswamy, N., Michalek, G., et al. 2004, J. Geophys. Res., 109, A07105 [Google Scholar]
- Zhang, J., Reid, H. A. S., Krupar, V., et al. 2023, Sol. Phys., 298, 7 [Google Scholar]
- Zhong, Z. H., Zhou, M., Tang, R. X., et al. 2020, Geophys. Res. Lett., 47, e85141 [NASA ADS] [CrossRef] [Google Scholar]
All Tables
Onset times and initial solar release times of the three electron events observed by SO/EPT.
All Figures
|
Fig. 1. Overview of dynamic spectrograms at radio (a) and X-ray (b) wavelengths during the eruptive event on 2021 August 24. Dark shading shows strong emission, with logarithmic grading. |
| In the text | |
|
Fig. 2. Decimetric-metric radio emission during the impulsive phase of the 2021 August 24 event. Panel (a): Dynamic spectrum (ORFEES, 0.1 s; Glasgow e-Callisto station, 0.25 s resolution). Dark shading indicates bright emission. Panels (b and c): NRH maps (iso-intensity contours superposed on an image) of the first J burst (b; 11:58:00 UT) and the last type III burst (panel c; 12:00:19 UT). The contours delineate the half-maximum level at the burst peak (0.25 s resolution); the different colours represent different frequencies (see legend at right). The set of tilted ellipses in the upper right corner shows the half-maximum levels of the nominal interferometric antenna beam. Solar north is at the top, east on the left. The white arc shows the optical solar limb. |
| In the text | |
|
Fig. 3. Active region NOAA 12859 as observed before the eruptive activity by the Meudon spectroheliograph in the violet wing of the Ca II K line (a) and the centre of the Hα line (b). |
| In the text | |
|
Fig. 4. Pre-eruptive active region (top panels) and three instants during the filament eruption, as observed in Hα (left panels; CLIMSO), EUV 30.4 nm (right panels, AIA/SDO), and radio (NRH; contours) on 2021 August 24. Solar north is at the top of the figure, solar east on the left. The insets in the left panel show close-ups of the eruption. A movie showing the images at 30.4 nm and the radio contours is available online (Movie 02). |
| In the text | |
|
Fig. 5. First moving type IV burst: Time histories of the 1D brightness temperature scans projected onto the solar east–west (a) and south–north (b) directions at four NRH frequencies with the whole-Sun dynamic spectrum (a) and its time derivative (b) in the top panels. Dark shading of the 1D images means bright emission. The overplotted white lines show the positions of the brightest emission. The time histories of the peak brightness temperatures, scaled to a common beam width, are overplotted in (c) on the X-ray count-rate spectrum. Panel (d) shows the peak positions in the course of the event. The source motion proceeds south-eastward from the upper right to the lower left (see online Movie 01). |
| In the text | |
|
Fig. 6. Comparison of radio brightness temperature profiles at 432 MHz (blue curve) and 151 MHz (red) with the X-ray count rates in two nominal energy ranges (black curve and grey-shaded background). The minimum value over the plot time range was subtracted from each light curve, which was then normalised to its maximum. |
| In the text | |
|
Fig. 7. Spectra of the scaled peak brightness temperature of the moving type IV source at selected times (NRH; 10 s integration). |
| In the text | |
|
Fig. 8. Time-differenced dynamic spectrum during part of the burst group 12:09–12:14 UT (a; dark shading shows increasing flux density) and the source configurations (b, c) during the first (∼12:09:35 UT) and third (∼12:09:46 UT) burst attaining the low-frequency border of the dynamic spectrum in (a). Time resolutions 1 s (ORFEES). The sources in (b, c) are represented by iso-intensity contours at half-maximum (NRH images with 0.25 s integration) at 228, 173, and 151 MHz overplotted on an image of the type IV source at 432 MHz (integration 10 s). The tilted ellipses near the upper right corner of the plots show the half-maximum levels of the interferometric beam. |
| In the text | |
|
Fig. 9. Dynamic spectrum and source location during the high-frequency burst group 12:17–12:21 UT. (a) ORFEES dynamic spectrum using 0.1 s time resolution (top panel; grey levels graded from 0.99 to 1.5 times the pre-event background, logarithmic scale), and the corresponding 1D images at three frequencies (NRH, 0.25 s integration). The overplotted red line marks the peak positions of the first moving type IV source (NRH, 10 s integration). (b) Map of the burst at 12:19:04 UT (iso-intensity contour at half-maximum at 408 MHz overplotted on the simultaneous image at 432 MHz; 0.25 s integration). |
| In the text | |
|
Fig. 10. Dynamic spectrum and source location during the low-frequency burst group 12:39–12:43 UT. (a) Broadband dynamic spectrum. (b) Map of the burst at 12:39:05 UT (iso-intensity contour at half-maximum at 228, 173, 151 MHz overplotted on the time-integrated image (10 s) at 228 MHz. |
| In the text | |
|
Fig. 11. Time histories of the electron events (a) and radio and Langmuir wave emission observed at Solar Orbiter (b) and broadband radio spectrum seen from the terrestrial viewpoint (c) on 2021 August 24. (a): Count rates of energetic electrons in different channels (Solar Orbiter/EPD/EPT). (b): Dynamic spectrum of the hectometric-to-kilometric type III burst and Langmuir waves (Solar Orbiter/RPW). The time given is the time at the spacecraft. Horizontal bands in (b) are residuals of radio interference. The vertical red lines in (b) are the initial solar release times of the three energetic electron events, to which the photon travel time of 320 s from the Sun to Solar Orbiter has been added. (c): Dynamic radio spectrum as seen from 1 AU (as Fig. 1). Red vertical lines show the initial release times of the electron events with added photon travel time 500 s. |
| In the text | |
|
Fig. 12. Dynamic and peak energy spectra of the electron events observed by the Solar Orbiter/EPD suite on 2021 August 24. (a) Dynamic spectrogram (EPT and STEP detectors). The data were smoothed by a running mean over 3 min. The magenta lines show the ideal dispersion for electrons injected at the earliest (solid lines) and latest (dotted lines) SRT times given for each event in Table 1. (b) Spectra of the differential electron flux at the maxima in each detector channel. A pre-event background taken 30 minutes before the first event was subtracted. |
| In the text | |
Current usage metrics show cumulative count of Article Views (full-text article views including HTML views, PDF and ePub downloads, according to the available data) and Abstracts Views on Vision4Press platform.
Data correspond to usage on the plateform after 2015. The current usage metrics is available 48-96 hours after online publication and is updated daily on week days.
Initial download of the metrics may take a while.