Open Access
Fig. 1.
Download original image
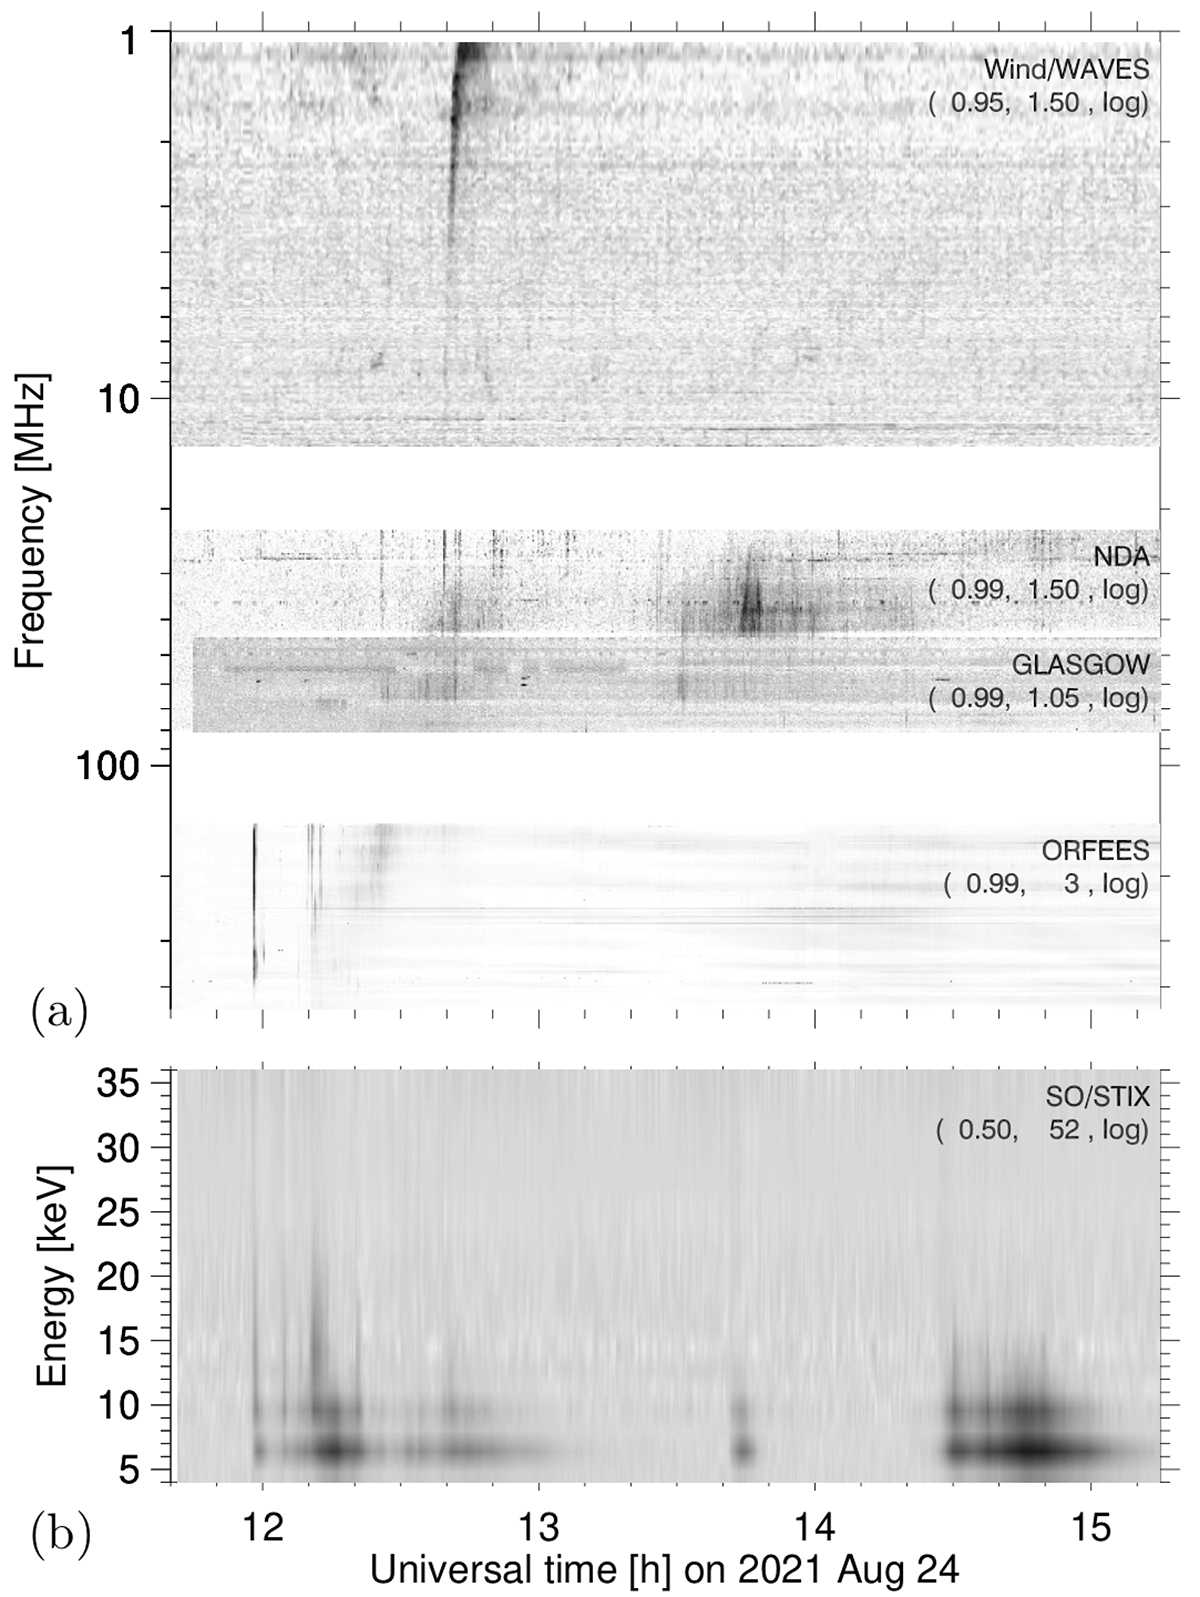
Overview of dynamic spectrograms at radio (a) and X-ray (b) wavelengths during the eruptive event on 2021 August 24. Dark shading shows strong emission, with logarithmic grading.
Current usage metrics show cumulative count of Article Views (full-text article views including HTML views, PDF and ePub downloads, according to the available data) and Abstracts Views on Vision4Press platform.
Data correspond to usage on the plateform after 2015. The current usage metrics is available 48-96 hours after online publication and is updated daily on week days.
Initial download of the metrics may take a while.