| Issue |
A&A
Volume 697, May 2025
|
|
|---|---|---|
| Article Number | A216 | |
| Number of page(s) | 13 | |
| Section | The Sun and the Heliosphere | |
| DOI | https://doi.org/10.1051/0004-6361/202453514 | |
| Published online | 28 May 2025 | |
Non-thermal energy release in the post-impulsive phase of the May 9, 2021 event
1
LIRA, Paris Observatory, PSL Research University, CNRS, Sorbonne Université, Université Paris Cité, 5 place Jules Janssen 92195 Meudon, France
2
Key Laboratory of Solar Activity, National Astronomical Observatories, Chinese Academy of Sciences, Beijing 100101, China
3
School of Astronomy and Space Science, University of Chinese Academy of Sciences, Beijing 100049, China
4
Observatoire Radioastronomique de Nançay, Paris Observatory, CNRS, Université d’Orléans, 18330 Nançay, France
⋆ Corresponding authors: This email address is being protected from spambots. You need JavaScript enabled to view it.
, This email address is being protected from spambots. You need JavaScript enabled to view it.
Received:
19
December
2024
Accepted:
21
March
2025
Abstract
Context. In the standard model of solar flares, a magnetic flux rope erupts and gets ejected from the Sun. The current sheets that form in its wake are the seat of magnetic reconnection, which is thought to power energy release throughout the long-lasting decay phase of the thermal X-ray emission. This model has been broadly tested with plasma diagnostics at soft X-ray, EUV, and Hα wavelengths.
Aims. The primary aim of the present investigation is to shed light on the acceleration of non-thermal electrons in the post-impulsive phase through hard X-ray (HXR) radiation and radio spectroscopic imaging at decimeter-to-meter wavelengths. We focus our study on the case of a C4.0 class flare on May 9, 2021.
Methods. This event was fully observed by multiple instruments from three different vantage points in space. We analyzed the spectrum and the source configuration of X-ray emission with the Spectrometer-Telescope for Imaging X-rays (STIX) on board the Solar Orbiter spacecraft, complemented by the Gamma-Ray Burst Monitor (GBM) aboard the Fermi mission, and the radio emission with Nançay Radioheliograph (NRH) and the ORFEES spectrograph. The extreme ultraviolet images from both Solar TErrestrial RElations Observatory (STEREO-A) and Solar Dynamics Observatory (SDO) were applied to trace the evolution of thermal plasma and coronal magnetic structures.
Results. The radio spectrum at decimeter-to-meter wavelengths shows broadband continuum emission (type IV burst), which is a well-known radio signature of time-extended electron acceleration in eruptive flares. Both moving and stationary radio sources were identified. Energetic electrons were observed in X-rays up to 20 keV, displaying a significant correlation with the time evolution of the stationary type IV radio burst during the long duration decay phase, which lasted over 50 minutes. The X-ray photon spectral index is relatively steep with a value of around – 7.5 and the integrated electron flux above 30 keV is on the order of 1.6 × 1032 electron s−1.
Conclusions. This case study provides for the first time evidence that HXR emission accompanies the onset of a stationary type IV radio burst. It ties together several pieces of evidence to support that non-thermal electrons are released into large-scale magnetic flux ropes during the post-impulsive phase of eruptive solar flares. The energies of the non-thermal electrons inferred from the X-ray spectral analysis confirm indirect estimates from radio observations. Electron acceleration processes appear as a significant signature of post-impulsive energy release, with energies in the range from several to tens of kiloelectron volts (keV).
Key words: Sun: activity / Sun: flares / Sun: particle emission / Sun: radio radiation / Sun: X-rays / gamma rays
© The Authors 2025
 Open Access article, published by EDP Sciences, under the terms of the Creative Commons Attribution License (https://creativecommons.org/licenses/by/4.0), which permits unrestricted use, distribution, and reproduction in any medium, provided the original work is properly cited.
This article is published in open access under the Subscribe to Open model. This email address is being protected from spambots. You need JavaScript enabled to view it. to support open access publication.
1. Introduction
The acceleration of charged particles is an ubiquitous phenomenon in solar flares. Non-thermal electrons are probed by their hard X-ray (HXR) and radio emission, and the acceleration processes are mostly been discussed in terms of magnetic reconnection and related turbulence (Fletcher et al. 2011; Holman et al. 2011). Most analyses refer to the impulsive flare phase, where the X-ray signatures are the most intense (i.e., the time range between the start and peak time of the soft X-ray burst).
The post-impulsive phase of eruptive flares, with its signatures of destabilization and the eruption of large-scale coronal structures and a re-arrangement of the corona in its wake, leads to a standard flare scenario, with the build-up of a magnetic flux rope, its instability or loss of equilibrium, and magnetic reconnection in its wake. These effects create signatures of time-extended energy release, such as long-lasting thermal X-ray emission and growing loop systems in X-rays, extreme ultraviolet (EUV), and Hα. A recent overview of observations of such flares and their relationship with the basic scenario is given in Janvier et al. (2015). Non-thermal signatures of time-extended energy release in the post-impulsive phase can also be observed (Yu et al. 2020) in the form of weak microwave and HXR emission from electrons accelerated in magnetic reconnection events in the post-eruptive current sheet.
Radio observations at decimeter-to-meter wavelengths have long been known to show events where non-thermal electrons are present in the corona well after the impulsive phase, sometimes during several hours. An earlier denomination of the post-impulsive phase quoted above was indeed the gradual phase (see e.g., Svestka 1989; Bai & Sturrock 1989), which was characterized by long-lasting thermal emission (duration of few tens of minutes) associated with broad-band (continuum) emission from microwave to meter wavelengths. These radio bursts have different manifestations in the dynamic spectrum and different source configurations. They form collectively the broad category of type IV bursts, which was first identified by Boischot (1957), but actually comprises a broad range of broadband emission (see, e.g., Wild et al. 1963; Pick 1986; Pick & Vilmer 2008, for reviews). One of them is the ’moving type IV burst’ (Boischot 1958) and another is the hour-lasting “storm continuum” (Pick & Steinberg 1961) or “stationary type IV burst” (Wild et al. 1963). Type IV radio emission is known to be well associated with mass ejections from the Sun. Numerous imaging observations confirm the early moving type IV sources are part of the expanding structures in coronal mass ejections (CMEs) (Bain et al. 2014; Carley et al. 2020; Morosan et al. 2021; Klein et al. 2024).
Detailed observational studies of stationary type IV bursts were recently published by Salas-Matamoros & Klein (2020) and Lv et al. (2021). Furthermore, Kumari et al. (2021) and Kumari (2022) have studied the relationship between type IV bursts and different types of CMEs and with the location of the parent active region, respectively. These authors distinguish moving and stationary type IV bursts through the presence or absence of systematic frequency drifts in full-Sun dynamic spectrograms. However, many stationary type IV bursts have been shown to start later at lower frequencies (e.g., Salas-Matamoros & Klein 2020 and references therein). The delayed onset is a noticeable frequency drift, which apparently is not detected in the dynamic spectra, where broadband long-lasting continuum emission are difficult to identify. We do not use the spectral definition of stationary type IV bursts to avoid further blurring the already complex definition of the various types of type IV continua (see also the discussion in Pick 1986). In the present paper, we stick to the definition of moving and stationary type IV bursts based on imaging.
The energy of the electrons and the localization of acceleration regions are poorly constrained from the radio observations alone (see e.g., the review by Carley et al. 2020 on the location and production of radio emitting non-thermal electrons during the different phases of the eruption in the low corona). A less ambiguous diagnostic of the energies of non-thermal electrons is their HXR emission. They are hard to detect in the corona, however, because the most intense non-thermal X-ray emission from the chromosphere or low corona outshine possible contributions from more tenuous regions at greater altitude. The recent discovery of non-thermal X-rays within erupting magnetic flux ropes was made possible thanks to the Solar Orbiter mission (Stiefel et al. 2023; Purkhart et al. 2023). Furthermore, Hayes et al. (2024) reported non-thermal photons with energies up to at least 30 keV within a magnetic flux rope, at coronal altitudes higher than 0.3 R⊙ above the photosphere. This discovery was enabled by a fortunate Sun-spacecraft constellation, where the bright X-rays from the chromosphere and the low corona were occulted as seen from Solar Orbiter. These HXR producing electrons are exactly those we would like to directly compare with the long-lasting type IV radio emission, while Salas-Matamoros & Klein (2020) inferred indirectly electron energies around 10 keV and sometimes a few tens of keV for these radio emission.
In the present work, we investigate the relationship between X-rays and radio-emitting electrons in the post-impulsive phase of an eruptive solar flare on 9 May 2021. This problem was already addressed during the Solar Maximum Mission (SMM) era in the 1980s. Švestka et al. (1982a) reported the observation (at photon energies of 3.5–8.0 keV) of a ‘giant arch’ in the late phase of an eruptive flare, which was located above an arcade of flare loops and below a long-lived source of meter-wave radio emission that the authors qualified as a noise storm; however, because of the association with an eruptive flare, it was more likely to be a stationary type IV burst. The X-ray and the radio emission decayed over many hours in a coordinated way. The “arch” was found to bridge the location of a filament that had erupted and to be oriented along the magnetic inversion line in the photosphere. The description closely resembles that of a magnetic flux rope, but the summit of the structure was found at a stable position over hours. Švestka et al. (1982b) observed another eruptive flare with a similar configuration of X-ray and meter-wave radio sources, which were found to undergo simultaneous fluctuations over several hours of the decay phase of the eruptive flare. A much clearer relationship was reported by Lantos et al. (1981) in another eruptive event. In that case, the soft X-ray emission at 1–8 Å and the 169 MHz radio emission had a very similar temporal evolution over about an hour, throughout the rise and decay. The radio and X-ray emission was located in the backward extension of one leg of the CME. The authors called the radio emission a noise storm, but the close relationship with an erupting filament and a CME argues again for a stationary type IV burst. Klein et al. (1983) demonstrated another association between a stationary type IV burst and HXR emission in the 5–14 keV range. Trottet (1986) reviewed combined radio and X-ray observations of time-extended energy release and electron acceleration in eruptive flares in the early 1980s. These publications were the first pieces of evidence that related the coronal electron acceleration in stationary type IV bursts to the time-extended energy release that the standard model of eruptive flares attributes to magnetic reconnection in the current sheets that form in the wake of the rising magnetic flux rope. Associations between deka-keV X-ray emission and the onset of long duration metric radio continua were thereafter observed by Crosby et al. (1996) for several events. Some of them showed a significant excess of the deka-keV count rate above the expectation from an isothermal X-ray emission. This is consistent with the results from Raulin & Klein (1994), who showed that a soft X-ray brightening was observed in association with the onset of long duration metric continua. These results taken together point to the fact that the onset of long duration metric continua (such as stationary type IV bursts but also noise storms) implies some energy release in the active region in the low corona (thermal and non-thermal X-ray emission) similar to flares but at smaller scales.
Joint X-ray and radio investigations have been vigorously pursued throughout the Reuven Ramaty High-Energy Solar Spectroscopic Imager (RHESSI; Lin et al. 2002) period (White et al. 2011). However, long-duration events continued to be difficult to analyze because of frequent occultations of the Sun to the spacecraft in a low-Earth orbit. Solar Orbiter now offers the unique advantage of solar observations over long durations without any occultation. The present manuscript reports a case study that benefits from such observations. The May 9, 2021 event is a usual C4.0 class flare, but it has a decay phase that lasts for more than fifty minutes from 14:10 to 15:00 UT and is accompanied by moving and stationary type IV bursts. This event was observed by multiple instruments at the same time. We use two ground-based and five space-borne instruments, which gives us a broad spectral and imaging range at X-ray, EUV and decimeter-to-meter wavelengths. We present the instruments and observational data in Sections 2 and 3. We discuss the results in Section 4.
2. Data
We used the following instruments and observation data in the present analysis.
Regarding radio observations: Radio emission in the range 144–1004 MHz were observed with the ORFEES instrument (Observations Radiospectrographiques pour FEDOME et l’Etude des Eruptions Solaires; Hamini et al. (2021)). Radio images at eight frequencies (150.9, 173.2, 228.0, 270.6, 298.7, 327.0, 408.0, and 432.0 MHz) provided by the Nançay Radioheliograph (NRH; Kerdraon & Delouis 1997) were also used in the study. The NRH imaging data were analyzed using SolarSoftware (SSWIDL) with a time resolution of 250 ms.
Regarding X-ray observations: Spectrometer/Telescope for Imaging X-rays (STIX) on board Solar Orbiter (Müller et al. 2020) provided X-ray observations in the energy range of 4 to 150 keV. This provides information on the flare plasma’s hottest temperatures (≳10 MK) as well as on the energy spectrum of flare-accelerated non-thermal electrons. The instrument uses a bi-grid system to modulate the incoming signal, allowing for the reconstruction of images of the solar X-ray source (Krucker et al. 2020). In this study, we used the pixel data to produce images made with the subcollimators calibrated to the date (grids 3 to 10), corresponding to the finest angular resolution of 14.6″. We also used the spectrogram data to achieve X-ray spectroscopy.
The event was also partially observed by Fermi Gamma-ray Burst Monitor (GBM; Meegan et al. 2009) in X-ray. While STIX is a solar dedicated instrument, Fermi is a general-purpose high-energy space telescope, but can also record X-ray emission from the Sun. GBM/Fermi is able to observe the whole sky with 12 NaI detectors in total; hence, we selected the present data from the three sunward-most detectors. This includes detectors NaI00, NaI01, and NaI05 for the purposes of this study. We also used the 0.1-0.8 nm soft X-ray intensity curve measured by the Geostationary Operational Environmental Satellites (GOES).
As for the EUV observations: Atmospheric Imaging Assembly (AIA; Lemen et al. 2012) on board Solar Dynamics Observatory (SDO) and Extreme Ultraviolet Imager (EUVI; Howard et al. 2008) on board Solar TErrestrial RElations Observatory-Ahead (STEREO-A) also observed the relevant event. We used the standard SSWIDL routines to process the data from both AIA/SDO and EUVI/STEREO-A instruments. The AIA/SDO data is level 1.5 data released from the official site. It provides data with a pixel size and time resolution of 0.6 arcseconds and 12 s, respectively. The EUVI/STEREO-A provides images with the pixel size of 1.6 arcseconds and a time cadence of 2.5 min in the 195 Å filtergram. Although we analyzed data from all channels of AIA, we specifically use in the present study observations from the 171 Å channel (temperature response peak at 105.8K) and the 193 Å channel (double-peaked response at 106.2K and 107.3K).
The flare analyzed in the current paper was located at N16E51 near the eastern limb of the solar disk from the Earth’s point of view. While ground-based and SDO observations provided flare information as viewed from the Earth, Solar Orbiter, and STEREO-A provided information from two different points of view. The spacecraft positions are shown in Fig. 1. The red star indicates the location of the C4.0 flare on the Sun. The red ‘A’ and pink ‘SO’ represent the position of STEREO-A and Solar Orbiter, respectively. The angle between Solar Orbiter and Earth is 97.5° and between STEREO-A and Earth, it is 52.0°. In the steps described below, we also corrected the time delay between the different spacecrafts and the Earth: 22.1 s for STEREO-A and 43.7 s for SolO.
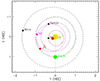 |
Fig. 1. Spacecraft position on May 9, 2021. The location of the event is indicated by the red star. It is located on the eastern limb of the Sun from the Earth view, at the center of the solar disk from the STEREO-A point of view and on the western limb of the Sun from the Solar Orbiter’s point of view. |
3. Observations of the May 9, 2021 event
3.1. General description of the event
Figure 2 presents an overview of the 9 May 2021 event observed in X-ray and radio wavelengths. Figure 2a presents the GOES soft X-ray flux profile at 0.1–0.8 nm (1.5–12.4 keV) and the GBM/Fermi count rate time profiles in three energy bands. The GOES X-ray time profiles show a C4.0 class flare with an impulsive phase peaking at 13:58:00 UT and decaying until 14:09:00 UT1. After the decay from the main peak, the flux rises again up to the C2.0 level. The X-ray count rates in the 6–25 keV range also increase after 14:17 UT and remain on an enhanced level until at least 15:00 UT. The Sun is out of Fermi’s field of view between 14:00 to 14:17 UT and after 14:48 UT. The EUV observations at the time of the new rise in X-rays show that the associated energy release occurs in the same active region and is the continuation of phenomena observed during the flare impulsive phase. The entire emission between 13:38:00 and (at least) 15:00 UT is thus considered here as a single flare and the time period after 14:15 UT is referred as post-impulsive phase (see the online Supplementary Movie 1). The gray line overlaid on Fig. 2 indicates the start time of the post-impulsive phase of the flare, which is the time period analyzed in the present paper. Fig. 2b shows the STIX X-ray count rate time profiles in three energy bands and the NRH radio flux time profiles at 150.9 and 228.0 MHz. The enhancement of the radio emission accompanies those at X-rays. The ORFEES radio dynamic spectrum from 144 to 1000 MHz (Fig. 2c) covers all the frequencies imaged by the NRH. It shows that the post-impulsive radio emission consists of a long duration emission that starts with the X-rays around 14:15 UT and lasts more than 45 minutes. This type IV continuum covers the entire ORFEES band, with some fine structures superposed.
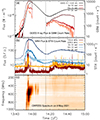 |
Fig. 2. Overview of the event observed in X-ray and radio. (a) GOES soft X-ray flux profile at 0.1–0.8 nm (1.5–12.4 keV) (black curves) and GBM/Fermi X-ray count rates in three energy bands between 6 and 25 keV (solid red curves). The GBM/Fermi X-ray count rates are the sum of the count rate recorded by the three detectors NaI00, NaI01, and NaI05. (b) STIX X-ray count rates in three energy bands between 6 and 28 keV (dotted blue lines) and NRH radio flux time profiles at 150.9 MHz (ruby) and 228.0 MHz (orange, the same colors as the colors of the NRH imaging contours shown later in the paper). The NRH radio flux profiles come from the full Sun. (c) ORFEES radio dynamic spectrum. |
3.2. Detailed description of the post-impulsive phase
Figure 3 displays the event observed in X-ray and radio wavelengths during the post-impulsive phase. Figure 3a shows normalized profiles of GBM/Fermi in three energy bands in the 6–25 keV range (solid red lines) and STIX in two energy bands in the 6–14 keV range (dotted blue curves), respectively. The peak time above 10 keV is shortly before 14:25 UT (time T3). Below 10 keV, the time evolution of the X-ray flux is more gradual and the maximum is rather flat. As observed by STIX, it is about ten minutes later at 14:33 UT (time T4). The time evolution of the count rate in 6–10 keV band observed with GBM/Fermi and STIX does, however, show a delay of around four minutes between the maxima of the broad peak. This could be due to the fact that the two instruments observe the Sun with different viewing angles and thus slightly different emitting regions in the low corona. Another reason could be related to the change of the most sunward GBM/Fermi detector after 14:32 UT (at that time, detector NaI05 starts to be the most sunward detector). Figure 3b shows the ORFEES dynamic spectrum in the post-impulsive phase. Some radio fine structures are observed superposed on the long-lived continuum type IV emission. The comparison of Figures 3a and b shows that the long-duration radio emission is co-temporal with HXR emission above 10 keV. The strongest radio emission is observed close to the time of HXR peaks (either below or above 10 keV). In Figs. 3c, d, e, and f, we show the time evolution of the 1D projection images obtained with the NRH at 228 and 408 MHz in the east-west (EW) and north-south (NS) directions. The y-axes in Figs. 3c–f show the coordinates in the solar EW and NS directions, respectively, in units of a solar radius with respect to the center of the photospheric disk. In Figs. 3c and d, we show several radio sources with stable centroid positions at 228 and 408 MHz in the EW direction. On the other hand, in Fig. 3f, we see that the centroid position of the radio source is moving to the south between 14:15 to 14:21 UT. The coordinate is indeed varying from 0.2 R⊙ (180 arcseconds) to finally 0.05 R⊙ (50 arcseconds). This is the signature of a moving type IV radio burst. It lasts about six minutes, with projected speeds in the range 100–140 km s−1. The centroid coordinates in the NS direction are rather stable after 14:22 UT. Figures 3c, d, e, and f show that different components in the type IV radio burst can be distinguished during the post-impulsive phase:
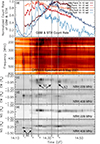 |
Fig. 3. Post-impulsive phase of the C4.0 flare event observed in X-ray and radio. (a) Normalized time profiles of GBM/Fermi X-ray count rates in three energy bands in the 6–25 keV range and STIX X-ray count rates in two energy bands in the 6–14 keV range (solid red and dotted blue curves, respectively). (b) ORFEES radio dynamic spectrum. (c) to (f) time evolution of the 1D projection images obtained with the NRH at 228 and 408 MHz in the east-west (EW) and north-south (NS) directions. The 5 black (or white) long dashed lines throughout (a) to (f) are five important times for the data analysis of the event. The times are 14:15:25 UT (marked as the time of T1), 14:20:25 UT (time T2), 14:24:42 UT (time T3), 14:32:52 UT (time T4), and 14:36:55 UT (time T5), respectively. |
1. A moving type IV burst (the first radio source) between 14:15 and 14:21 UT observed especially at frequencies ≥228 MHz, marked as ‘M’ in Fig. 3f (time interval of T1–T2).
2. A stationary type IV burst that starts around 14:20 UT and lasts until 15:17 UT (end of the NRH observations). It is marked as S1 in Fig. 3c. This stationary type IV burst is not at the position of a pre-existing radio noise storm source observed before the C4.0 flare, which is located more to the west, at least at the highest NRH frequencies.
3. Two sources are sometimes observed (especially at high frequencies) during the stationary type IV burst. The north-western one is the more persistent one (S1). The southeastern one (the third radio source, referred to as S2) displays a series of bursts (e.g., at 14:36:55 UT (time T5)). It is marked by S2 in Fig. 3d at the time of T5.
In Fig. 4, the positions of the radio sources observed at different frequencies and different times by the NRH are overlaid on simultaneous AIA/SDO 171 Å images. The iso-intensity contours at 80% of the maximum brightness are plotted for the different frequencies (151 MHz (ruby), 173 MHz (red), 228 MHz (orange), 271 MHz (yellow), 299 MHz (olive), 327 MHz (cyan), 408 MHz (sky-blue), and 432 MHz (blue)). Fig. 4a shows the position of the moving type IV burst (M). Figs. 4b and c show the positions of the long-lived stationary type IV bursts (north-western source, S1) and Fig. 4d represents the position of the south-eastern more sporadic source (S2). The radio burst times in Fig. 4 are marked in Fig. 3 by black (or white) long dashed lines.
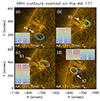 |
Fig. 4. NRH radio contours (the level is plotted at 80% of the maximum value at each frequency). The background is AIA/SDO at 171 Å. The NRH radio contours and AIA/SDO images are given in the same heliographic coordinate system and the unit is arcseconds. The contours in different colors denote different NRH imaging frequencies. The frequencies of 151, 173, 228 and 271 MHz in (a), and 151 and 173 MHz in (b) were removed since there is no radio emission at these frequencies and at the given time. (a) The time of the radio contours is at T1 and the AIA/SDO 171 Å image is at 14:15:21 UT. (b) The time of the radio contours is at T3 and the AIA/SDO 171 Å image is at 14:24:33 UT. (c) The time of the radio contours is at T4 and the AIA/SDO 171 Å image is at 14:32:45 UT. (d) The time of the radio contours is at T5 and the AIA/SDO 171 Å image is at 14:36:57 UT. |
3.3. Location of the hard X-ray sources in the post-impulsive phase
To better understand the association between X-ray and radio emission, the imaging capabilities of STIX are used. There are however two difficulties for the event that is the subject of this work. First, the Solar Orbiter viewing angle is very different from the Earth’s one, so we will have to rotate the X-ray images to the Earth’s viewing point. The other difficulty is linked to the capability of the STIX instrument to provide a precise position of this event, given the distance of Solar Orbiter to the Sun of 0.92 AU. The STIX Aspect System which measures the pointing of STIX relative to the Sun does not give a reliable solution when the distance between the Sun and Solar Orbiter is more than 0.75 AU (Warmuth et al. 2020).
As there is no EUV data from Solar Orbiter for this day, we use the EUVI/STEREO-A observations to attempt to accurately localize the HXR sources in the flaring active region. To achieve this, we rotated the EUVI/STEREO-A 195 Å images to the Solar Orbiter viewpoint and tried to overlay the STIX HXR contours following a method already used successfully by Massa et al. (2022) and Saqri et al. (2023). We used SSWIDL to produce STIX HXR images, following the same method as described in Massa et al. (2022). The expectation maximization method (EM; Massa et al. 2019) was finally chosen to reconstruct the images after comparing with other imaging methods, such as Clean (Högbom 1974) or the maximum entropy method (MEM; Massa et al. 2020).
We used the HXR images at 14:21:30 UT (one of the first strong X-ray peaks above 10 keV observed by STIX in the post-impulsive phase) together with the EUV image at the closest time rotated to the Solar Orbiter field of view (Fig. 5 left). To correct the absolute pointing (see above), we also shifted the STIX images by 15 arcseconds in the direction of solar west and 5 arcseconds in the direction of solar north in the heliocentric coordinate system. In Fig. 5a, we show the STIX contours overlaid on the EUVI/STEREO-A image after shifting. The thermal 6–10 keV source located between two non-thermal 10–18 keV sources overlays an arcade of EUV post-flare loops. All the STIX/SolO X-ray sources plotted later in the paper are shifted by the same value.
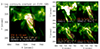 |
Fig. 5. Left panel: STIX contours overlaid on EUVI/STEREO-A 195 Å. The contours (50%, 65%, 80%, and 95% of the maximum value in each image) in orange and light orange, respectively, show the X-ray sources in 6–10 and 10–18 keV. The background is EUVI/STEREO-A 195 Å filter rotated to Solar Orbiter’s point of view. The time for the image in X-rays is at 14:23:13 UT (with the time shift of 43.7 s with respect to the Solar Orbiter time) in the Earth time frame with the integration time of 120 seconds. The time of EUVI is at 14:22:30 UT. Right panel: Evolution of the X-ray sources in the 6–10 and 10–18 keV energy range and of the extreme ultraviolet images in 195 Å. The times for the X-ray images correspond to the time of the black (or white) long dashed lines in Fig. 3. (b) The time of X-ray is at 14:15:13 UT, EUVI is at 14:15 UT. The corresponding time in Fig. 3 is T1. (c) The time of X-ray is at 14:25:13 UT, EUVI is at 14:25 UT. The corresponding time in Fig. 3 is T3. (d) The time of X-ray is at 14:31:13 UT, EUVI is at 14:32:30 UT. The corresponding time in Fig. 3 is T4. (e) The time of X-ray is at 14:35:13 UT, EUVI is at 14:35 UT. The corresponding time in Fig. 3 is T5. |
In Fig. 5b, we show the X-ray contours at 6–10 keV superposed on the 195 Å image at 14:15:25 UT at the end of the main soft X-ray peak (i.e., before the post-impulsive phase). At that time, only one X-ray source is detected in the 6–10 keV range. In Fig. 5c, we show the X-ray sources at the peak time of the X-ray emission above 10 keV. There is a change of position of the 6–10 keV source together with the appearance of two non-thermal new sources in the 10–15 keV range located at both ends of the thermal source. The separation of the two sources is in the north-south direction, whereas the post-flare loops have a significant east-west component. A long flare ribbon at 1600 Å (not shown here) is also oriented north-southward. The double X-ray source hence does not look like the classical configuration of two sources on opposite sides of the photospheric inversion line of the magnetic field. The X-ray sources are rather on opposite sides of the loop arcade, close to the presumed anchor points of an erupting flux rope. The image in Fig. 5d is at 14:31:13 UT close to the peak of the STIX X-ray time profile in the 6–10 keV energy range. There is only a single 10–18 keV X-ray source at the southern end of the structure. The thermal X-ray source is more elongated towards the south-west. In Fig. 5e, we show the X-ray contour in the 6–10 keV range at 14:35:13 UT when the radio source denoted S2 becomes predominant. The X-ray source is larger than before and there is no HXR source in the 10–18 keV range. After 14:34 UT, the HXR emission comes predominantly from the southern part of the X-ray emitting structure; namely, the southern part of the arcade of loops.
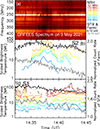 |
Fig. 11. Time profile of the brightness temperature of the south-eastern component of the stationary type IV burst (S2) from 14:32 to 14:45 UT. The top panel presents the ORFEES spectrum. The middle panel is the brightness temperature time profiles of S2 with GBM/Fermi X-ray count rates at in two energy bands in the 6–14 keV energy range. The bottom panel is the brightness temperature time profiles of S1 and of the STIX count rates on the same timescale. |
3.4. Nature of the hard X-ray sources in the post-impulsive phase
In this section, the aim is to determine the thermal and non-thermal contributions in the X-ray emission observed by STIX in the post-impulsive phase. HXR spectra at the time of the images presented in Fig. 5 have been analyzed. The HXR spectra are computed on the 120 second time interval of the image. Using the OSPEX module (Tolbert & Schwartz 2020) dedicated to STIX in SSW, a combination of a variable isothermal component (green lines in Fig. 6), with a non-thermal thick target component (yellow lines), including the contribution of the photospheric albedo component (pink lines), as computed in Kontar et al. (2006), are fitted to the HXR spectrum. The non-thermal component is described by the function thick2 in OSPEX, which directly provides the non-thermal electron spectrum producing HXR emission through thick target radiation. Once the spectral fitting is achieved, the number of non-thermal electrons above a low energy cut-off is computed. In good consistency with what can be expected from the images, the X-ray emission for most of the imaged time intervals does not show any non-thermal component and is mostly produced by the bremsstrahlung radiation of a hot plasma (in the range from 1 to 2 × 10⁷ K), as shown, for instance, in Figure 6b. The HXR spectra obtained at the time of Figures 5a and c do, however, reveal some weak non-thermal component contributing to the X-ray flux above 12 keV, as shown, for instance, in Figure 6 (a). The electron power law index is steep (δ = – 7.6, i.e., at the time given in Figure 5a and δ = – 7.5, i.e., at the time given in Figure 5c. The integrated electron flux above the low energy cutoff (27–30 keV) is, respectively, 2.9 × 1032 electron s−1 and 1.6 × 1032 electron s−1 (which lead to similar numbers around 3.0 × 1032 electron s−1 if the same low energy cut-off of 27 keV is chosen). It should be noted that the spectral analysis performed on one of the Fermi detector (detector 0) during the same period also shows the presence of a steep non-thermal component above 20 keV with a similar slope (δ = – 7.7) and a similar integrated electron flux around 2.9 × 1032 electron s−1. Given that for both STIX and GBM/Fermi the count-rates are low, the detection with both instruments of a non-thermal electron population is a strong confirmation that non-thermal electrons are indeed present in the active region during the beginning of the post-impulsive phase.
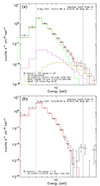 |
Fig. 6. HXR spectral analysis. Top: STIX count spectrum and fit for the time interval of Figure 5a. The figure shows the background-subtracted count spectrum (solid black histogram) overlaid by the total (vth+thick2+albedo) spectral fit (red line). The green, yellow and pink lines show respectively the thermal, non-thermal and albedo contributions. The dashed vertical lines indicate the energy range for the spectral fit. Bottom: STIX count spectrum and fit for the time interval of Figure 5e. |
3.5. Spatial and temporal evolutions of radio and X-ray emission
Figure 7 presents the radio and X-ray contours overlaid on running time difference images of AIA/SDO 171 and 193 Å for two times: at 14:15 and 14:20 UT (T1 and T2 in Fig. 3). The solid white rectangle in Fig. 7b and the quadrilateral of solid white lines in EUVI/STEREO-A images (right column) delimit the same region on the Sun. The first row corresponds to the time interval when the GOES X-ray flux at 0.1–0.8 nm starts to rise again, as well as the HXR count-rates. The first and second rows (Figs. 7a–c and d–f) correspond, respectively, to the start time and close to the end time of the moving type IV burst at high frequencies. The moving type IV source projects onto the southern part of a large-scale erupting feature in the 304 Å images (see online Supplementary Movie 2), and follows its southward motion in projection on the solar disk, at a speed of about 100 km s−1. The erupting feature at 304 Å comprises several loop-shaped fibrils, mostly in emission. As the eruption proceeds, the southern branch of the structure remains visible, becoming fainter while expanding and showing an increasing part in absorption. By its large-scale structure and its outward expansion the feature resembles an erupting filament. But while the Meudon Hα image at 07:52 UT2 displayed a dark linear structure extending southward from the active region in the vicinity of the place where the erupting structure rises later, no dark filament is visible either in the EUV (193 Å and 304 Å) or in Hα (Kanzelhöhe Observatory; not shown here) in the hours before the eruption. For this reason we refer to the feature as an ‘erupting magnetic structure’. As shown on Fig. 7, the radio sources are found to be close to the ascending system of loop-shaped fibrils seen in AIA/SDO and indicated by white arrows. During all that period, the dominant X-ray source is still observed in the active region.
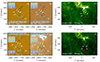 |
Fig. 7. Flare as seen from the Earth and EUV/STEREO points of view. The first two columns show the NRH radio contours at different frequencies (level of 80% maximum value in each frequency) and STIX X-ray contours overlaid on the running time difference images of AIA/SDO 171 and 193 Å at the onset time of ‘M’ (T1) and at the end of moving type IV burst at high frequencies (T2). The contours in different colors represent different NRH frequencies: 228 MHz (orange), 271 MHz (yellow), 299 MHz (olive), 327 MHz (cyan), 408 MHz (sky-blue), and 432 MHz (blue). STIX X-ray contours in blue represent 6–10 keV and cyan is 10–18 keV. (a and b) The times of the AIA/SDO 171 Å and 193 Å images are resp. 14:15:21 UT, and 14:15:16 UT. (d and e) Times of the AIA/SDO 171 Å and 193 Å images are resp. 14:20:21 UT, and 14:20:28 UT. The third column shows EUVI/STEREO-A 195 Å images. The times of each row are similar: more precisely the time of the EUVI/STEREO-A image in (c) is 14:15 UT and in (f) 14:20 UT. The red crosses shown in every image denote the same point on the Sun. |
Figure 8 shows the radio and X-ray contours after the end of the moving type IV burst on top of EUV images as in Fig. 7. The red crosses show the same position in the AIA and EUVI images. The times of radio bursts in Fig. 8 are denoted in Fig. 3 by black long dashes. The first and second rows in Fig. 8 show the positions of the main source of the stationary type IV burst (S1) respectively at T3 (peak time of the X-ray emission above 10 keV) and T4. While the radio emission gradually extends to lower frequencies, the source locations at individual frequencies are stable from 14:24 to 14:34 UT. The radio positions are relatively close to the active region and localized towards its northern part. The last row is at 14:36 UT (T5 in Fig. 3), for some time when the radio source S2 becomes predominant. The source of the second component S2 of the stationary type IV burst is close to the position of the southern part of the X-ray source, which dominates the X-ray emission at that time.
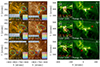 |
Fig. 8. Flare seen from the Earth and EUVI/STEREO-A points of view. The first column is AIA/SDO 171 Å images. The second column shows AIA/SDO 193 Å images. NRH radio contours (level of 80% maximum value in each frequency) are overlaid on the AIA images. The contours in different colors represent different NRH frequencies: 151 MHz (ruby), 173 MHz (red), 228 MHz (orange), 271 MHz (yellow), 299 MHz (olive), 327 MHz (cyan), 408 MHz (sky-blue) and 432 MHz (blue). STIX X-ray contours in blue (or orange) are at 6–10 keV and contours in cyan (or light orange) are at 10–18 keV. The third column shows EUVI/STEREO-A 195 Å images. The times of each row are similar, corresponding to the time of the black (or white) long dashed lines in Fig. 3. For the first row, the radio burst times are at T3 (the time of the AIA/SDO 171 Å image is at 14:24:33 UT, of the AIA/SDO 193 Å image is at 14:24:28 UT and of the EUVI/STEREO-A is at 14:25 UT). For the second row, the radio burst times are at T4 (the time of the AIA/SDO 171 Å image is at 14:32:45 UT, of the AIA/SDO 193 Å image is at 14:32:40 UT and of the EUVI/STEREO-A image is at 14:32:30 UT). For the last row, the radio burst times are at T5 (the time of the AIA/SDO 171 Å image is at 14:36:57 UT, of the AIA/SDO 193 Å image is at 14:36:52 UT and of the EUVI/STEREO-A image is at 14:35 UT). The red crosses shown in every images denote the same point on the Sun. For the last column, the insert on the bottom left shows an enlargement of the active region observed in EUV. STIX contours rotated to the AIA (or STEREO) field of view at 6–10 keV (cyan (or orange)) and 10-18 keV (blue (or light orange)) are overlaid on the AIA (or STEREO) images. |
3.6. Temporal evolution of the hard X-ray emission and radio emission from the moving and stationary components
In order to better understand the association between the X-ray emission and the different components of the radio emission in the post-impulsive phase, the time profiles of the brightness temperature of each of the radio components are extracted from the images. For the moving source, the region where the brightness temperature is computed tracks the centroid of the source. Fig. 9 to Fig. 11 display the time profiles of the brightness temperature of the different radio sources and of the normalized STIX count rates in two energy bands: 6–10 keV and 10–14 keV.
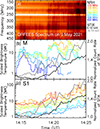 |
Fig. 9. Time profile of the brightness temperature of the moving type IV radio source (‘M’) from 14:14 to 14:25 UT. The top panel is the corresponding ORFEES spectrum. The middle panel is the brightness temperature time profiles of “M” and the STIX X-ray count rates in the 6–10 and 10–14 keV energy ranges. The bottom panel is a similar plot for the main component of the stationary component, denoted as S1. |
Fig. 9 shows the time profile of the moving type IV burst (‘M’) together with the ORFEES spectrum and the time profile of the brightness temperature of the stationary component (S1) for the same time interval. The stationary component starts to rise later than the moving component. The light curves of the moving type IV source consist of several bursts. Each has a finite frequency extent, which shifts to lower frequencies with abrupt jumps, as shown in the ORFEES spectrum at 14:19 UT. While the X-rays also show fluctuations, they do not appear correlated with the moving type IV light curve. The X-rays and the stationary source, S1, have a similar gradual rise that starts during the moving source, but continues to persist well after its disappearance.
Figure 10 shows the temporal evolution of the brightness temperature of the entire stationary type IV burst (S1). It rises gradually from 14:15 to 14:25 UT with possible superposed broadband bursts. A peak is clearly seen at high frequencies around 14:25 UT. A dip close to 14:33 UT in the whole frequency band is followed by a new enhancement until 15:00 UT. There is a very strong correlation in the rise phase of both types of emission. The first radio peak coincides very closely with the X-ray peak observed by STIX above 10 keV. The second rise of the radio emission after 14:33 UT does not correspond however to a new episode of X-ray emission above 10 keV. The peak of the 6-10 keV time profile corresponds to the dip of the radio emission. A second X-ray peak in the 6-10 keV range observed around 14:32 UT corresponds however to a second broad radio peak at high frequencies. Similar trends are observed with GBM/Fermi.
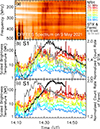 |
Fig. 10. Time profile of the brightness temperature of the main source of the stationary type IV radio sources (S1) from 14:09 to 15:00 UT. The top panel is the ORFEES spectrum. The middle panel is the brightness temperature time profiles of S1 and the STIX X-ray count rate in the 6–10 and 10–14 keV energy ranges. The bottom panel is the same S1 brightness temperature curves as the middle panel and GBM/Fermi X-ray count rates in the 6–10 and 10–14 keV energy ranges. |
Figure 11 finally shows the time evolution of the sporadic south-eastern component of the stationary type IV burst (S2) with the time evolution of the GBM/Fermi count rates. The time evolution of the brightness temperature of the main component (S1) and the STIX count rates are shown for comparison. The brightness temperature of the S2 source has a broad peak around 14:37–14:38 UT at all frequencies which is close to the first peak time of the Fermi X-ray count rate at 6–10 keV. However, at this time, there is no HXR peak above 10 keV.
4. Discussion and conclusion
4.1. Summary of observational results
In this study, we analyze a long duration solar flare, paying particular attention to the development of the post-impulsive phase well observed in X-ray, EUV, and radio wavelengths. The flare was located at the eastern limb as seen from Earth, at the center of the solar disk from the STEREO-A point of view and at the western limb from Solar Orbiter’s point of view. We used a combination of ground-based radio observations with X-ray and EUV observations from different instruments to explore the relationship between the different components of the radio emission (moving and stationary type IV bursts) and the X-ray sources and to search for potential signatures in X-rays of non-thermal electrons related to the different components of the type IV burst. Our findings can be summarized as follows:
1. Long-duration radio emission observed during the post-impulsive phase of the May 9, 2021 event is associated with HXR emission above 6 keV. The strongest radio emission occurs at (or near) the times of the HXR peaks.
2. Based on the radio images, both a moving type IV burst and a stationary type IV burst (with two sources) are observed in the post-impulsive phase.
3. The moving type IV radio burst (M) proceeds in three successive episodes, separated by discrete changes of the overall bandwidth. During each episode the brightness temperature has a similar evolution at several NRH frequencies, with a shift towards lower frequencies between adjacent episodes. The early part of the moving type IV burst occurs earlier than the rise of the post-impulsive X-ray emission observed by STIX/SolO and GBM/Fermi.
4. The moving type IV source (M) moves southward from the active region with a speed around 100 km s−1 in projection on the solar disk. Its sources are essentially cospatial at different frequencies. They project onto the southern leg of an erupting structure seen in 304 Å images and to the vicinity of an ascending system of loops seen at 171 Å with AIA/SDO. During that time, there is still significant X-ray emission present in the previously flaring active region, but there is no significant rise in the X-ray emission associated with the early phase of the moving type IV burst and no new X-ray source observed with the onset of the moving source.
5. In connection with the onset of the stationary type IV burst, there is a change in the position of the 6–10 keV X-ray source, together with the appearance of two sources in the 10–15 keV range located at both ends of the thermal source. The thermal source overlays an arcade of EUV post-flare loops. The two sources in the 10–15 keV range are separated in the north-south direction, which is the line connecting the two footpoints of the eruptive magnetic flux rope.
6. The time profile of the brightness temperature of the main source of the stationary type IV burst (S1) has a good temporal correlation with the X-ray emission: the two types of emission have a similar rise phase and there is a good association between the first radio peak and the X-ray peak observed above 10 keV.
7. At the time of the sporadic south-eastern component of the stationary type IV bursts (S2), there is no new X-ray source appearing. The 6–10 keV source is however more extended towards the south-west with the emission coming predominantly from the southern part of the emitting structure. This evolution is co-temporal with the brightening of the second source of the stationary type IV burst (S2) which is also in the southern part of the active region. The evolution of the brightness temperature of this component, in particular the broad peaks, shows some similarities with the evolution of the X-ray emission below 10 keV observed with Fermi.
8. Non-thermal emission is observed in the active region in the group of peaks observed above 10 keV during the early rise of the stationary type IV source (S1). The peaks in non-thermal X-rays accompany peaks of the radio brightness temperature of S1. The electron power law index is steep (δ around – 7.5). The integrated electron flux above 30 kev is on the order of 1.6 × 1032 electron s−1.
9. Apart from the period mentioned above (between 14:23 and 14:27 UT), the X-ray emission observed in the active region is mostly produced by a hot flaring plasma (in the range 1 to 2 × 10⁷ K) and does not show any significant non-thermal component.
4.2. Considering whether non-thermal X-ray emission was detected with the moving type IV burst
Only a few studies have been performed so far on the association between moving type IV bursts and HXR emission. It is thus worthwhile to compare the results of our present study with the ones of the recently published study by Klein et al. (2024). They indeed report an association between the moving type IV burst and X-ray emission up to a few tens of keV, which follows a similar time evolution as the moving type IV burst at high frequencies (300–432 MHz). Similarities in the time profiles argue in favor of a common origin of the electrons and the authors suggest that these electrons are injected in the rising flux rope (related to the moving type IV burst) from the current sheet behind it. No X-ray images are however shown in this study to confirm that X-ray emitting electrons are indeed close to the rising flux rope. In the present event, there is no significant increase of the X-ray flux related to the moving type IV emission at high frequencies and there is no new X-ray source observed with the onset of the moving type IV burst. One of the reasons could be that energetic electrons associated with the moving source would produce coronal X-ray emission that are usually difficult to observe. This would be supported by the observations of Hayes et al. (2024), who observed a HXR source at altitude > 0.3 R⊙ in a limb-occulted eruptive flare. As the authors argue, the detection was possible because more intense X-ray emission from lower altitudes was occulted. For the same reason, a similar source may have gone undetected in the present event.
4.3. Non-thermal electrons at the onset of the stationary type IV burst
In good consistency with the results of Salas-Matamoros & Klein (2020) and Lv et al. (2021) based on the analysis of many stationary type IV bursts, the present observations show a columnar structure of the stationary type IV burst close to the active region. As in one case published in Salas-Matamoros & Klein (2020), there is a secondary columnar component appearing sporadically at the other side of the active region. There is a good association between the rise phase and the first peak of the main component of the stationary type IV burst and HXR emission above 10 keV produced in the active region. At the time of the more sporadic secondary component of the stationary type IV burst (south-eastern component), the X-ray emission in the 6–10 keV range comes also predominantly from the southern part of the X-ray source. The configuration of both radio and X-ray sources suggests that these two types of emission are produced in a coordinated way. The non-thermal X-ray sources are at the northern and southern ends of the arcade of post-flare loops in EUV. This is probably not identical with the report of X-rays at the footpoints of the erupting filament in Stiefel et al. (2023), but it shows energy released and electrons accelerated near these footpoints. The thermal emission between the two HXR sources projects on the arcade of EUV loops, similar to the “arch” bridging the location of the eruptive filament as in Švestka et al. (1982a). Contrary to what was observed in Salas-Matamoros & Klein (2020), the secondary component of the stationary type IV burst is not related here to electrons traveling in the magnetic flux rope from the first leg to the other, but to a new energy release in the second leg evidenced by the evolution of the X-ray sources in the active region.
This is the first time that HXR emission is clearly detected in the active region at the onset of the stationary type IV burst. Former observations resp. by Crosby et al. (1996) only marginally showed that non-thermal electrons could be detected at the onset of long-duration radio emission. The present detection of deka-keV electrons also confirms the previous estimation by Salas-Matamoros & Klein (2020) of the energy of the electrons radiating stationary type IV bursts. The spectral analysis performed here allows to roughly estimate the number and the spectrum of non-thermal electrons in the active region. The spectral index is relatively steep (δ around – 7.5) similar to the spectral slope observed above 14 keV for one of the first micro-flares observed by STIX (see, e.g., Battaglia et al. 2021). In the present case, the number of electrons is on the order of 1.6 × 1032 electron s−1 above 30 keV and the energy contained in the non-thermal electrons is on the order of 9.0 × 1025 erg s−1 above 30 keV. Compared to the microflare reported in Battaglia et al. (2021), the energy contained in the non-thermal electrons (assuming that the electron population would extend down to a similar low-energy cutoff of 14 keV with a same slope) would be ten times larger. If compared on a similar time interval (20 s), the number of electrons deduced at the onset of the stationary type IV burst is around the low limit of the energetic electrons (above 20 keV) produced in the active region at the time of metric type III bursts (James & Vilmer 2023). The present number would however be consistent with the non-thermal energy content observed in a rare case for coronal thick-target HXR emission in a jet associated with a type III burst (Glesener et al. 2020). All these comparisons point out that similar numbers of non-thermal electrons in the active region could be present at the onset of stationary type IV bursts and in association with type III bursts, showing that these types of emission are associated to flare-like phenomena in the active region in the post-impulsive phase.
It should be noted, however, that the number of electrons in the active region is probably larger than the one related to the radio emission of the stationary type IV burst in the corona, which could represent only a fraction of this electron number. Observing X-ray emission associated with a solar eruption above 0.3 R⊙ related to an occulted flare, Hayes et al. (2024) reported that significant non thermal emission was produced in a coronal source (at altitudes where decimetric and metric radio emission are usually observed). The coronal HXR emission is interpreted as thin target emission and while the total number of non-thermal electrons is estimated to be in the range between 5.1–8.3 × 1035 above 10 keV, the total energy range is in the range between 1.5–2.3 × 1028 ergs above 10 keV. Hayes et al. (2024) also concluded that these non-thermal electrons are likely to be confined in magnetic field line structures located in the legs of the eruptive EUV structure.
4.4. Conclusion
As a final conclusion, the observational results presented here demonstrate the importance of combining X-ray and radio observations in obtaining a further understanding of the production of non-thermal electrons in decimetric and metric type IV bursts, as well as on the non-thermal energetics associated with these phenomena. However, as the HXR observations are obtained with spectro-imager based on indirect techniques implying limited dynamic range, most of the information comes from the strongest chromospheric HXR emission, whereas the coronal HXR emission which is produced by the radio emitting electrons is obscured. Better direct constraints on the properties of radio emitting energetic electrons would result from the direct detection of the X-ray emission in the coronal sources. This would require X-ray observations obtained with instruments with higher sensitivities and dynamic ranges, such as instruments using focusing optics, e.g. the Focusing Optics X-ray Solar Imager (FOXSI; Christe et al. 2018). Combining decimetric and metric radio images with X-ray observations obtained with a direct imager would indeed allow for simultaneous imaging and spectroscopy of both X-ray chromospheric and coronal emission, substantially improving the association between the X-rays and the different components of the radio continua. It would also allow us to identify the locations of particle acceleration and provide better quantitative constraints on the non-thermal population that is directly producing radio continua.
Data availability
Movies associated to Figs. A.1 and A.2 are available at https://www.aanda.org/
Acknowledgments
Solar Orbiter is a mission of international cooperation between ESA and NASA, operated by ESA. The STIX instrument has been funded by the Swiss Space Office, the Polish National Science Centre, CNES, CEA, the Czech Ministry of Education, Deutsches Zentrum für Luft- und Raumfahrt (DLR), the Austrian Space Programme, ESA PRODEX, the Agenzia Spaziale Italiana (ASI) and the Istituto Nazionale di Astrofisica (INAF). The authors acknowledge the Radio Monitoring site (secchirh.obspm.fr) and the Radio Solar Database of Paris Observatory (LESIA, Nançay Radio Observatory) for the data of NRH and ORFEES. They are also thankful to the AIA/SDO team, EUVI/STEREO team, GBM/Fermi team, STIX/SOLO team and SXR/GOES team for providing the relevant data used in this paper. The first author thanks the University of Chinese Academy of Sciences (UCAS) Joint PhD Training Program to provide the funding and also the support by the National Key R&D Program of China (2021YFA1600500 and 2021YFA1600503). The authors acknowledge support from the CNES for the participation to the Solar Orbiter project and DP acknowledges support of the Fondation CFM pour la Recherche. The authors are thankful to Sophie Musset for useful documents and acknowledge helpful discussions with Baolin Tan and Jing Huang during the work in Beijing. The authors thanks the referee for his useful comments which largely improved the present paper.
References
- Bai, T., & Sturrock, P. A. 1989, ARA&A, 27, 421 [NASA ADS] [Google Scholar]
- Bain, H. M., Krucker, S., Saint-Hilaire, P., & Raftery, C. L. 2014, ApJ, 782, 12 [Google Scholar]
- Battaglia, A. F., Saqri, J., Massa, P., et al. 2021, A&A, 656, A4 [NASA ADS] [CrossRef] [EDP Sciences] [Google Scholar]
- Boischot, A. 1957, Comptes Rendus de l’Académie des Sciences, 244, 1326 [Google Scholar]
- Boischot, A. 1958, Ann. Astrophys., 21, 273 [Google Scholar]
- Carley, E. P., Vilmer, N., & Vourlidas, A. 2020, Front. Astron. Space Sci., 7, 551558 [Google Scholar]
- Christe, S., Shih, A. Y., Krucker, S., et al. 2018, Triennial Earth-Sun Summit (TESS), A joint meeting of the Space Physics and Aeronomy Section of the American Geophysical Union (AGU) and the Solar Physics Division (SPD) of the American Astronomical Society, online at https://connect.agu.org/tess2018/home, 404.144 [Google Scholar]
- Crosby, N., Vilmer, N., Lund, N., Klein, K. L., & Sunyaev, R. 1996, Sol. Phys., 167, 333 [Google Scholar]
- Fletcher, L., Dennis, B. R., Hudson, H. S., et al. 2011, Space Sci. Rev., 159, 19 [Google Scholar]
- Glesener, L., Krucker, S., Duncan, J., et al. 2020, ApJ, 891, 8 [NASA ADS] [CrossRef] [Google Scholar]
- Hamini, A., Auxepaules, G., Birée, L., et al. 2021, J. Space Weather Space Clim., 11, 10 [Google Scholar]
- Hayes, L. A., Krucker, S., Collier, H., & Ryan, D. 2024, A&A, 691, A190 [NASA ADS] [CrossRef] [EDP Sciences] [Google Scholar]
- Högbom, J. A. 1974, A&AS, 15, 417 [Google Scholar]
- Holman, G. D., Aschwanden, M. J., Aurass, H., et al. 2011, Space Sci. Rev., 159, 107 [NASA ADS] [CrossRef] [Google Scholar]
- Howard, R. A., Moses, J. D., Vourlidas, A., et al. 2008, Space Sci. Rev., 136, 67 [NASA ADS] [CrossRef] [Google Scholar]
- James, T., & Vilmer, N. 2023, A&A, 673, A57 [NASA ADS] [CrossRef] [EDP Sciences] [Google Scholar]
- Janvier, M., Aulanier, G., & Démoulin, P. 2015, Sol. Phys., 290, 3425 [Google Scholar]
- Kerdraon, A., & Delouis, J. M. 1997, Coronal Physics from Radio and Space Observations, 483, 192 [NASA ADS] [CrossRef] [Google Scholar]
- Klein, L., Anderson, K., Pick, M., et al. 1983, Sol. Phys., 84, 295 [Google Scholar]
- Klein, K.-L., Salas Matamoros, C., Hamini, A., & Kollhoff, A. 2024, A&A, 690, A382 [NASA ADS] [CrossRef] [EDP Sciences] [Google Scholar]
- Kontar, E. P., MacKinnon, A. L., Schwartz, R. A., & Brown, J. C. 2006, A&A, 446, 1157 [NASA ADS] [CrossRef] [EDP Sciences] [Google Scholar]
- Krucker, S., Hurford, G. J., Grimm, O., et al. 2020, A&A, 642, A15 [NASA ADS] [CrossRef] [EDP Sciences] [Google Scholar]
- Kumari, A. 2022, Sol. Phys., 297, 98 [NASA ADS] [CrossRef] [Google Scholar]
- Kumari, A., Morosan, D. E., & Kilpua, E. K. J. 2021, ApJ, 906, 79 [Google Scholar]
- Lantos, P., Kerdraon, A., Rapley, G. G., & Bentley, R. D. 1981, A&A, 101, 33 [NASA ADS] [Google Scholar]
- Lemen, J. R., Title, A. M., Akin, D. J., et al. 2012, Sol. Phys., 275, 17 [Google Scholar]
- Lin, R. P., Dennis, B. R., Hurford, G. J., et al. 2002, Sol. Phys., 210, 1 [Google Scholar]
- Lv, M., Chen, Y., Vasanth, V., et al. 2021, Sol. Phys., 296, 38 [Google Scholar]
- Massa, P., Piana, M., Massone, A. M., & Benvenuto, F. 2019, A&A, 624, A130 [NASA ADS] [CrossRef] [EDP Sciences] [Google Scholar]
- Massa, P., Schwartz, R., Tolbert, A. K., et al. 2020, ApJ, 894, 46 [NASA ADS] [CrossRef] [Google Scholar]
- Massa, P., Battaglia, A. F., Volpara, A., et al. 2022, Sol. Phys., 297, 93 [NASA ADS] [CrossRef] [Google Scholar]
- Meegan, C., Lichti, G., Bhat, P. N., et al. 2009, ApJ, 702, 791 [Google Scholar]
- Morosan, D. E., Kumari, A., Kilpua, E. K. J., & Hamini, A. 2021, A&A, 647, L12 [NASA ADS] [CrossRef] [EDP Sciences] [Google Scholar]
- Müller, D., St. Cyr, O. C., Zouganelis, I., et al. 2020, A&A, 642, A1 [Google Scholar]
- Pick, M. 1986, Sol. Phys., 104, 19 [NASA ADS] [CrossRef] [Google Scholar]
- Pick, M., & Steinberg, J. L. 1961, Ann. Astrophys., 24, 45 [Google Scholar]
- Pick, M., & Vilmer, N. 2008, A&ARv., 16, 1 [NASA ADS] [CrossRef] [Google Scholar]
- Purkhart, S., Veronig, A. M., Dickson, E. C. M., et al. 2023, A&A, 679, A99 [NASA ADS] [CrossRef] [EDP Sciences] [Google Scholar]
- Raulin, J. P., & Klein, K. L. 1994, A&A, 281, 536 [Google Scholar]
- Salas-Matamoros, C., & Klein, K. L. 2020, A&A, 639, A102 [NASA ADS] [CrossRef] [EDP Sciences] [Google Scholar]
- Saqri, J., Veronig, A. M., Dickson, E. C. M., et al. 2023, A&A, 672, A237 [Google Scholar]
- Stiefel, M. Z., Battaglia, A. F., Barczynski, K., et al. 2023, A&A, 670, A89 [NASA ADS] [CrossRef] [EDP Sciences] [Google Scholar]
- Svestka, Z. 1989, Sol. Phys., 121, 399 [Google Scholar]
- Švestka, Z., Stewart, R., Hoyng, P., et al. 1982a, Sol. Phys., 75, 305 [Google Scholar]
- Švestka, Z., Dennis, B. R., Pick, M., et al. 1982b, Sol. Phys., 80, 143 [Google Scholar]
- Tolbert, K., & Schwartz, R. 2020, Astrophysics Source Code Library [record ascl:2007.018] [Google Scholar]
- Trottet, G. 1986, Sol. Phys., 104, 145 [NASA ADS] [CrossRef] [Google Scholar]
- Warmuth, A., Önel, H., Mann, G., Rendtel, J. 2020, Sol. Phys., 295, 90 [NASA ADS] [CrossRef] [Google Scholar]
- White, S. M., Benz, A. O., Christe, S., et al. 2011, Space Sci. Rev., 159, 225 [CrossRef] [Google Scholar]
- Wild, J. P., Smerd, S. F., & Weiss, A. A. 1963, ARA&A, 1, 291 [NASA ADS] [CrossRef] [Google Scholar]
- Yu, S., Chen, B., Reeves, K. K., et al. 2020, ApJ, 900, 17 [Google Scholar]
Appendix A: Supplementary Movie
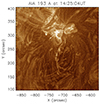 |
Fig. A.1. Snapshot of online Supplementary Movie 1 showing the entire flare period in the EUV waveband, observed by AIA/SDO at 193 Å from 13:40 to 15:00 UT. |
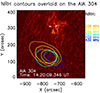 |
Fig. A.2. Snapshot from online Supplementary Movie 2 showing the moving type IV burst (M) against with the background of AIA images at 304 Å from 14:12 to 14:26 UT. The erupting magnetic structure seen from the Earth points of view during the M period (14:14 to 14:21 UT). The NRH frequency contours are plotted in the movies at each time, only when the relevant radio bursts are available. |
All Figures
|
Fig. 1. Spacecraft position on May 9, 2021. The location of the event is indicated by the red star. It is located on the eastern limb of the Sun from the Earth view, at the center of the solar disk from the STEREO-A point of view and on the western limb of the Sun from the Solar Orbiter’s point of view. |
| In the text | |
|
Fig. 2. Overview of the event observed in X-ray and radio. (a) GOES soft X-ray flux profile at 0.1–0.8 nm (1.5–12.4 keV) (black curves) and GBM/Fermi X-ray count rates in three energy bands between 6 and 25 keV (solid red curves). The GBM/Fermi X-ray count rates are the sum of the count rate recorded by the three detectors NaI00, NaI01, and NaI05. (b) STIX X-ray count rates in three energy bands between 6 and 28 keV (dotted blue lines) and NRH radio flux time profiles at 150.9 MHz (ruby) and 228.0 MHz (orange, the same colors as the colors of the NRH imaging contours shown later in the paper). The NRH radio flux profiles come from the full Sun. (c) ORFEES radio dynamic spectrum. |
| In the text | |
|
Fig. 3. Post-impulsive phase of the C4.0 flare event observed in X-ray and radio. (a) Normalized time profiles of GBM/Fermi X-ray count rates in three energy bands in the 6–25 keV range and STIX X-ray count rates in two energy bands in the 6–14 keV range (solid red and dotted blue curves, respectively). (b) ORFEES radio dynamic spectrum. (c) to (f) time evolution of the 1D projection images obtained with the NRH at 228 and 408 MHz in the east-west (EW) and north-south (NS) directions. The 5 black (or white) long dashed lines throughout (a) to (f) are five important times for the data analysis of the event. The times are 14:15:25 UT (marked as the time of T1), 14:20:25 UT (time T2), 14:24:42 UT (time T3), 14:32:52 UT (time T4), and 14:36:55 UT (time T5), respectively. |
| In the text | |
|
Fig. 4. NRH radio contours (the level is plotted at 80% of the maximum value at each frequency). The background is AIA/SDO at 171 Å. The NRH radio contours and AIA/SDO images are given in the same heliographic coordinate system and the unit is arcseconds. The contours in different colors denote different NRH imaging frequencies. The frequencies of 151, 173, 228 and 271 MHz in (a), and 151 and 173 MHz in (b) were removed since there is no radio emission at these frequencies and at the given time. (a) The time of the radio contours is at T1 and the AIA/SDO 171 Å image is at 14:15:21 UT. (b) The time of the radio contours is at T3 and the AIA/SDO 171 Å image is at 14:24:33 UT. (c) The time of the radio contours is at T4 and the AIA/SDO 171 Å image is at 14:32:45 UT. (d) The time of the radio contours is at T5 and the AIA/SDO 171 Å image is at 14:36:57 UT. |
| In the text | |
|
Fig. 5. Left panel: STIX contours overlaid on EUVI/STEREO-A 195 Å. The contours (50%, 65%, 80%, and 95% of the maximum value in each image) in orange and light orange, respectively, show the X-ray sources in 6–10 and 10–18 keV. The background is EUVI/STEREO-A 195 Å filter rotated to Solar Orbiter’s point of view. The time for the image in X-rays is at 14:23:13 UT (with the time shift of 43.7 s with respect to the Solar Orbiter time) in the Earth time frame with the integration time of 120 seconds. The time of EUVI is at 14:22:30 UT. Right panel: Evolution of the X-ray sources in the 6–10 and 10–18 keV energy range and of the extreme ultraviolet images in 195 Å. The times for the X-ray images correspond to the time of the black (or white) long dashed lines in Fig. 3. (b) The time of X-ray is at 14:15:13 UT, EUVI is at 14:15 UT. The corresponding time in Fig. 3 is T1. (c) The time of X-ray is at 14:25:13 UT, EUVI is at 14:25 UT. The corresponding time in Fig. 3 is T3. (d) The time of X-ray is at 14:31:13 UT, EUVI is at 14:32:30 UT. The corresponding time in Fig. 3 is T4. (e) The time of X-ray is at 14:35:13 UT, EUVI is at 14:35 UT. The corresponding time in Fig. 3 is T5. |
| In the text | |
|
Fig. 11. Time profile of the brightness temperature of the south-eastern component of the stationary type IV burst (S2) from 14:32 to 14:45 UT. The top panel presents the ORFEES spectrum. The middle panel is the brightness temperature time profiles of S2 with GBM/Fermi X-ray count rates at in two energy bands in the 6–14 keV energy range. The bottom panel is the brightness temperature time profiles of S1 and of the STIX count rates on the same timescale. |
| In the text | |
|
Fig. 6. HXR spectral analysis. Top: STIX count spectrum and fit for the time interval of Figure 5a. The figure shows the background-subtracted count spectrum (solid black histogram) overlaid by the total (vth+thick2+albedo) spectral fit (red line). The green, yellow and pink lines show respectively the thermal, non-thermal and albedo contributions. The dashed vertical lines indicate the energy range for the spectral fit. Bottom: STIX count spectrum and fit for the time interval of Figure 5e. |
| In the text | |
|
Fig. 7. Flare as seen from the Earth and EUV/STEREO points of view. The first two columns show the NRH radio contours at different frequencies (level of 80% maximum value in each frequency) and STIX X-ray contours overlaid on the running time difference images of AIA/SDO 171 and 193 Å at the onset time of ‘M’ (T1) and at the end of moving type IV burst at high frequencies (T2). The contours in different colors represent different NRH frequencies: 228 MHz (orange), 271 MHz (yellow), 299 MHz (olive), 327 MHz (cyan), 408 MHz (sky-blue), and 432 MHz (blue). STIX X-ray contours in blue represent 6–10 keV and cyan is 10–18 keV. (a and b) The times of the AIA/SDO 171 Å and 193 Å images are resp. 14:15:21 UT, and 14:15:16 UT. (d and e) Times of the AIA/SDO 171 Å and 193 Å images are resp. 14:20:21 UT, and 14:20:28 UT. The third column shows EUVI/STEREO-A 195 Å images. The times of each row are similar: more precisely the time of the EUVI/STEREO-A image in (c) is 14:15 UT and in (f) 14:20 UT. The red crosses shown in every image denote the same point on the Sun. |
| In the text | |
|
Fig. 8. Flare seen from the Earth and EUVI/STEREO-A points of view. The first column is AIA/SDO 171 Å images. The second column shows AIA/SDO 193 Å images. NRH radio contours (level of 80% maximum value in each frequency) are overlaid on the AIA images. The contours in different colors represent different NRH frequencies: 151 MHz (ruby), 173 MHz (red), 228 MHz (orange), 271 MHz (yellow), 299 MHz (olive), 327 MHz (cyan), 408 MHz (sky-blue) and 432 MHz (blue). STIX X-ray contours in blue (or orange) are at 6–10 keV and contours in cyan (or light orange) are at 10–18 keV. The third column shows EUVI/STEREO-A 195 Å images. The times of each row are similar, corresponding to the time of the black (or white) long dashed lines in Fig. 3. For the first row, the radio burst times are at T3 (the time of the AIA/SDO 171 Å image is at 14:24:33 UT, of the AIA/SDO 193 Å image is at 14:24:28 UT and of the EUVI/STEREO-A is at 14:25 UT). For the second row, the radio burst times are at T4 (the time of the AIA/SDO 171 Å image is at 14:32:45 UT, of the AIA/SDO 193 Å image is at 14:32:40 UT and of the EUVI/STEREO-A image is at 14:32:30 UT). For the last row, the radio burst times are at T5 (the time of the AIA/SDO 171 Å image is at 14:36:57 UT, of the AIA/SDO 193 Å image is at 14:36:52 UT and of the EUVI/STEREO-A image is at 14:35 UT). The red crosses shown in every images denote the same point on the Sun. For the last column, the insert on the bottom left shows an enlargement of the active region observed in EUV. STIX contours rotated to the AIA (or STEREO) field of view at 6–10 keV (cyan (or orange)) and 10-18 keV (blue (or light orange)) are overlaid on the AIA (or STEREO) images. |
| In the text | |
|
Fig. 9. Time profile of the brightness temperature of the moving type IV radio source (‘M’) from 14:14 to 14:25 UT. The top panel is the corresponding ORFEES spectrum. The middle panel is the brightness temperature time profiles of “M” and the STIX X-ray count rates in the 6–10 and 10–14 keV energy ranges. The bottom panel is a similar plot for the main component of the stationary component, denoted as S1. |
| In the text | |
|
Fig. 10. Time profile of the brightness temperature of the main source of the stationary type IV radio sources (S1) from 14:09 to 15:00 UT. The top panel is the ORFEES spectrum. The middle panel is the brightness temperature time profiles of S1 and the STIX X-ray count rate in the 6–10 and 10–14 keV energy ranges. The bottom panel is the same S1 brightness temperature curves as the middle panel and GBM/Fermi X-ray count rates in the 6–10 and 10–14 keV energy ranges. |
| In the text | |
|
Fig. A.1. Snapshot of online Supplementary Movie 1 showing the entire flare period in the EUV waveband, observed by AIA/SDO at 193 Å from 13:40 to 15:00 UT. |
| In the text | |
|
Fig. A.2. Snapshot from online Supplementary Movie 2 showing the moving type IV burst (M) against with the background of AIA images at 304 Å from 14:12 to 14:26 UT. The erupting magnetic structure seen from the Earth points of view during the M period (14:14 to 14:21 UT). The NRH frequency contours are plotted in the movies at each time, only when the relevant radio bursts are available. |
| In the text | |
Current usage metrics show cumulative count of Article Views (full-text article views including HTML views, PDF and ePub downloads, according to the available data) and Abstracts Views on Vision4Press platform.
Data correspond to usage on the plateform after 2015. The current usage metrics is available 48-96 hours after online publication and is updated daily on week days.
Initial download of the metrics may take a while.