Fig. 3.
Download original image
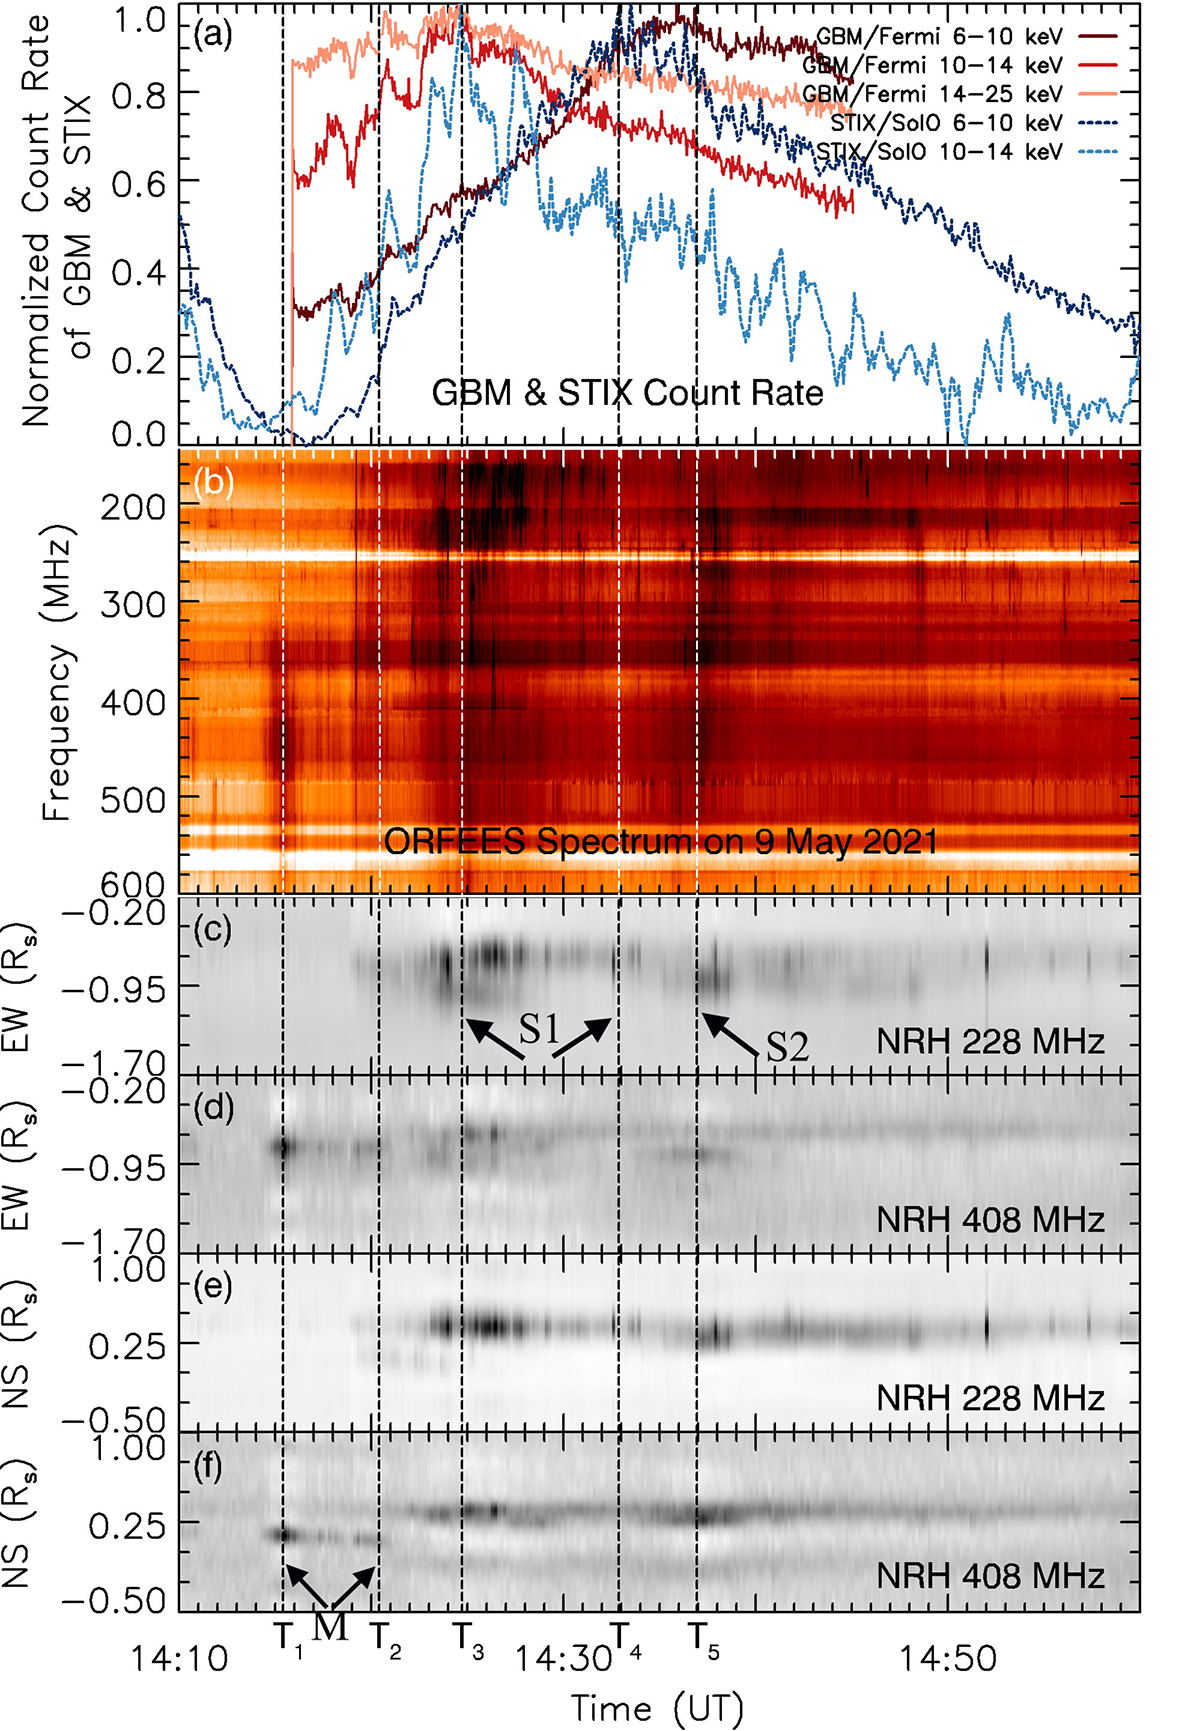
Post-impulsive phase of the C4.0 flare event observed in X-ray and radio. (a) Normalized time profiles of GBM/Fermi X-ray count rates in three energy bands in the 6–25 keV range and STIX X-ray count rates in two energy bands in the 6–14 keV range (solid red and dotted blue curves, respectively). (b) ORFEES radio dynamic spectrum. (c) to (f) time evolution of the 1D projection images obtained with the NRH at 228 and 408 MHz in the east-west (EW) and north-south (NS) directions. The 5 black (or white) long dashed lines throughout (a) to (f) are five important times for the data analysis of the event. The times are 14:15:25 UT (marked as the time of T1), 14:20:25 UT (time T2), 14:24:42 UT (time T3), 14:32:52 UT (time T4), and 14:36:55 UT (time T5), respectively.
Current usage metrics show cumulative count of Article Views (full-text article views including HTML views, PDF and ePub downloads, according to the available data) and Abstracts Views on Vision4Press platform.
Data correspond to usage on the plateform after 2015. The current usage metrics is available 48-96 hours after online publication and is updated daily on week days.
Initial download of the metrics may take a while.