Fig. 5.
Download original image
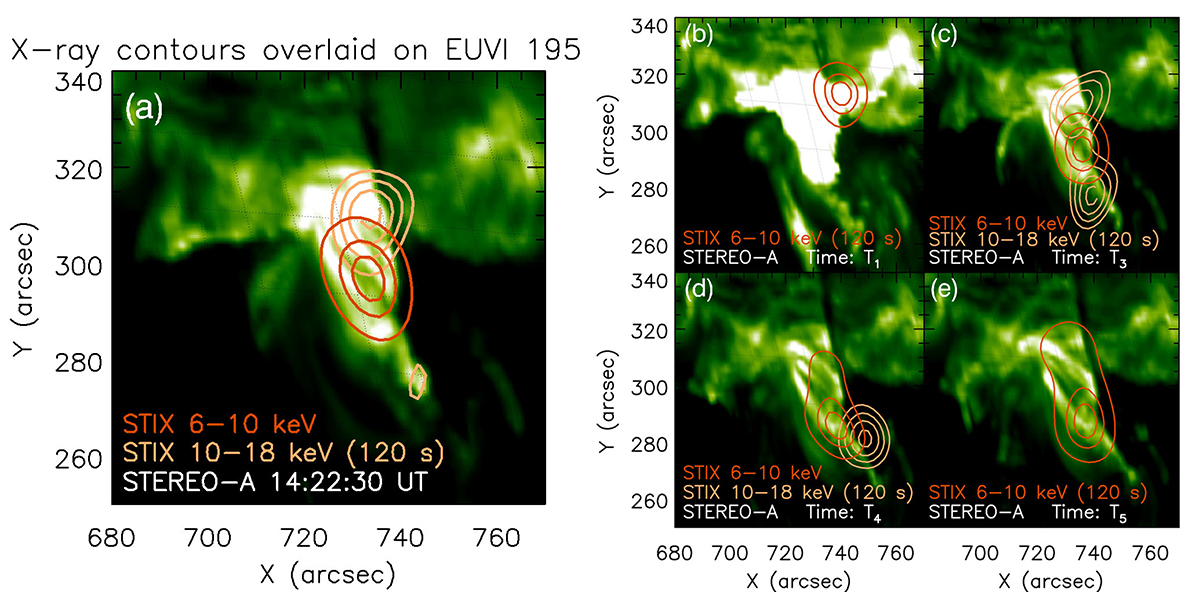
Left panel: STIX contours overlaid on EUVI/STEREO-A 195 Å. The contours (50%, 65%, 80%, and 95% of the maximum value in each image) in orange and light orange, respectively, show the X-ray sources in 6–10 and 10–18 keV. The background is EUVI/STEREO-A 195 Å filter rotated to Solar Orbiter’s point of view. The time for the image in X-rays is at 14:23:13 UT (with the time shift of 43.7 s with respect to the Solar Orbiter time) in the Earth time frame with the integration time of 120 seconds. The time of EUVI is at 14:22:30 UT. Right panel: Evolution of the X-ray sources in the 6–10 and 10–18 keV energy range and of the extreme ultraviolet images in 195 Å. The times for the X-ray images correspond to the time of the black (or white) long dashed lines in Fig. 3. (b) The time of X-ray is at 14:15:13 UT, EUVI is at 14:15 UT. The corresponding time in Fig. 3 is T1. (c) The time of X-ray is at 14:25:13 UT, EUVI is at 14:25 UT. The corresponding time in Fig. 3 is T3. (d) The time of X-ray is at 14:31:13 UT, EUVI is at 14:32:30 UT. The corresponding time in Fig. 3 is T4. (e) The time of X-ray is at 14:35:13 UT, EUVI is at 14:35 UT. The corresponding time in Fig. 3 is T5.
Current usage metrics show cumulative count of Article Views (full-text article views including HTML views, PDF and ePub downloads, according to the available data) and Abstracts Views on Vision4Press platform.
Data correspond to usage on the plateform after 2015. The current usage metrics is available 48-96 hours after online publication and is updated daily on week days.
Initial download of the metrics may take a while.