Fig. 8.
Download original image
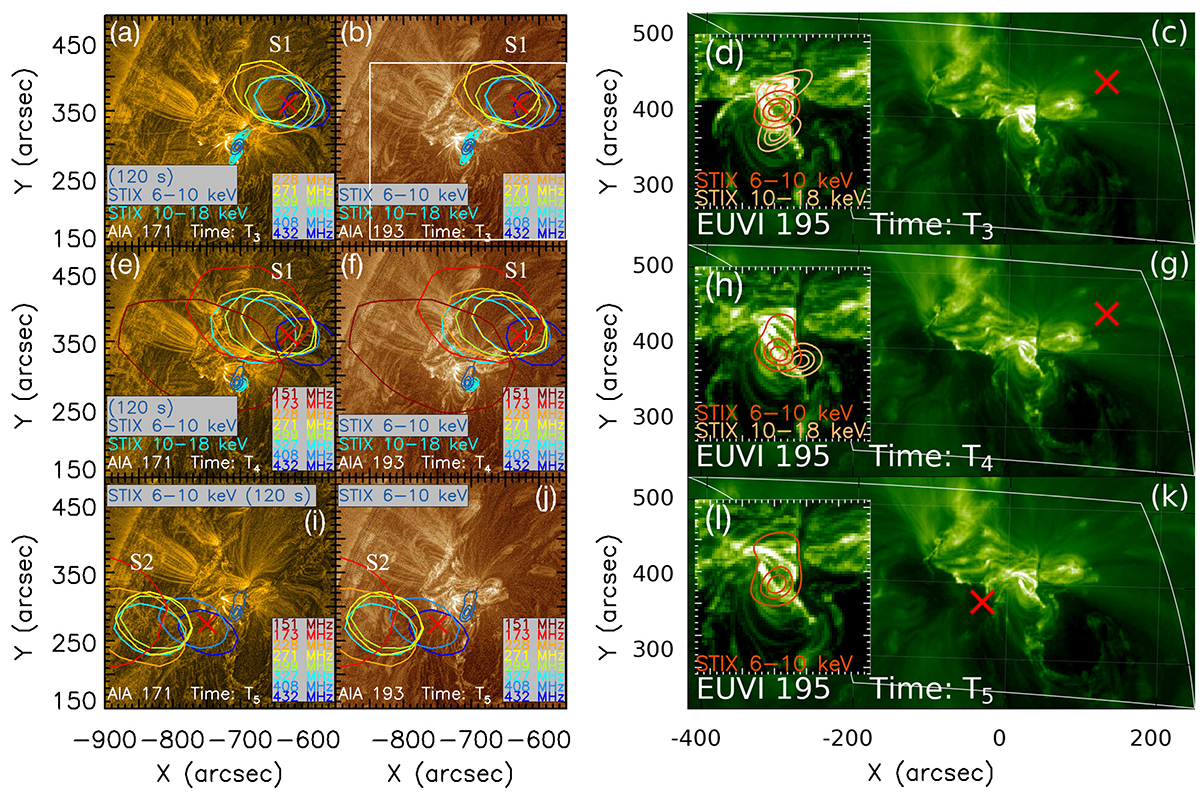
Flare seen from the Earth and EUVI/STEREO-A points of view. The first column is AIA/SDO 171 Å images. The second column shows AIA/SDO 193 Å images. NRH radio contours (level of 80% maximum value in each frequency) are overlaid on the AIA images. The contours in different colors represent different NRH frequencies: 151 MHz (ruby), 173 MHz (red), 228 MHz (orange), 271 MHz (yellow), 299 MHz (olive), 327 MHz (cyan), 408 MHz (sky-blue) and 432 MHz (blue). STIX X-ray contours in blue (or orange) are at 6–10 keV and contours in cyan (or light orange) are at 10–18 keV. The third column shows EUVI/STEREO-A 195 Å images. The times of each row are similar, corresponding to the time of the black (or white) long dashed lines in Fig. 3. For the first row, the radio burst times are at T3 (the time of the AIA/SDO 171 Å image is at 14:24:33 UT, of the AIA/SDO 193 Å image is at 14:24:28 UT and of the EUVI/STEREO-A is at 14:25 UT). For the second row, the radio burst times are at T4 (the time of the AIA/SDO 171 Å image is at 14:32:45 UT, of the AIA/SDO 193 Å image is at 14:32:40 UT and of the EUVI/STEREO-A image is at 14:32:30 UT). For the last row, the radio burst times are at T5 (the time of the AIA/SDO 171 Å image is at 14:36:57 UT, of the AIA/SDO 193 Å image is at 14:36:52 UT and of the EUVI/STEREO-A image is at 14:35 UT). The red crosses shown in every images denote the same point on the Sun. For the last column, the insert on the bottom left shows an enlargement of the active region observed in EUV. STIX contours rotated to the AIA (or STEREO) field of view at 6–10 keV (cyan (or orange)) and 10-18 keV (blue (or light orange)) are overlaid on the AIA (or STEREO) images.
Current usage metrics show cumulative count of Article Views (full-text article views including HTML views, PDF and ePub downloads, according to the available data) and Abstracts Views on Vision4Press platform.
Data correspond to usage on the plateform after 2015. The current usage metrics is available 48-96 hours after online publication and is updated daily on week days.
Initial download of the metrics may take a while.