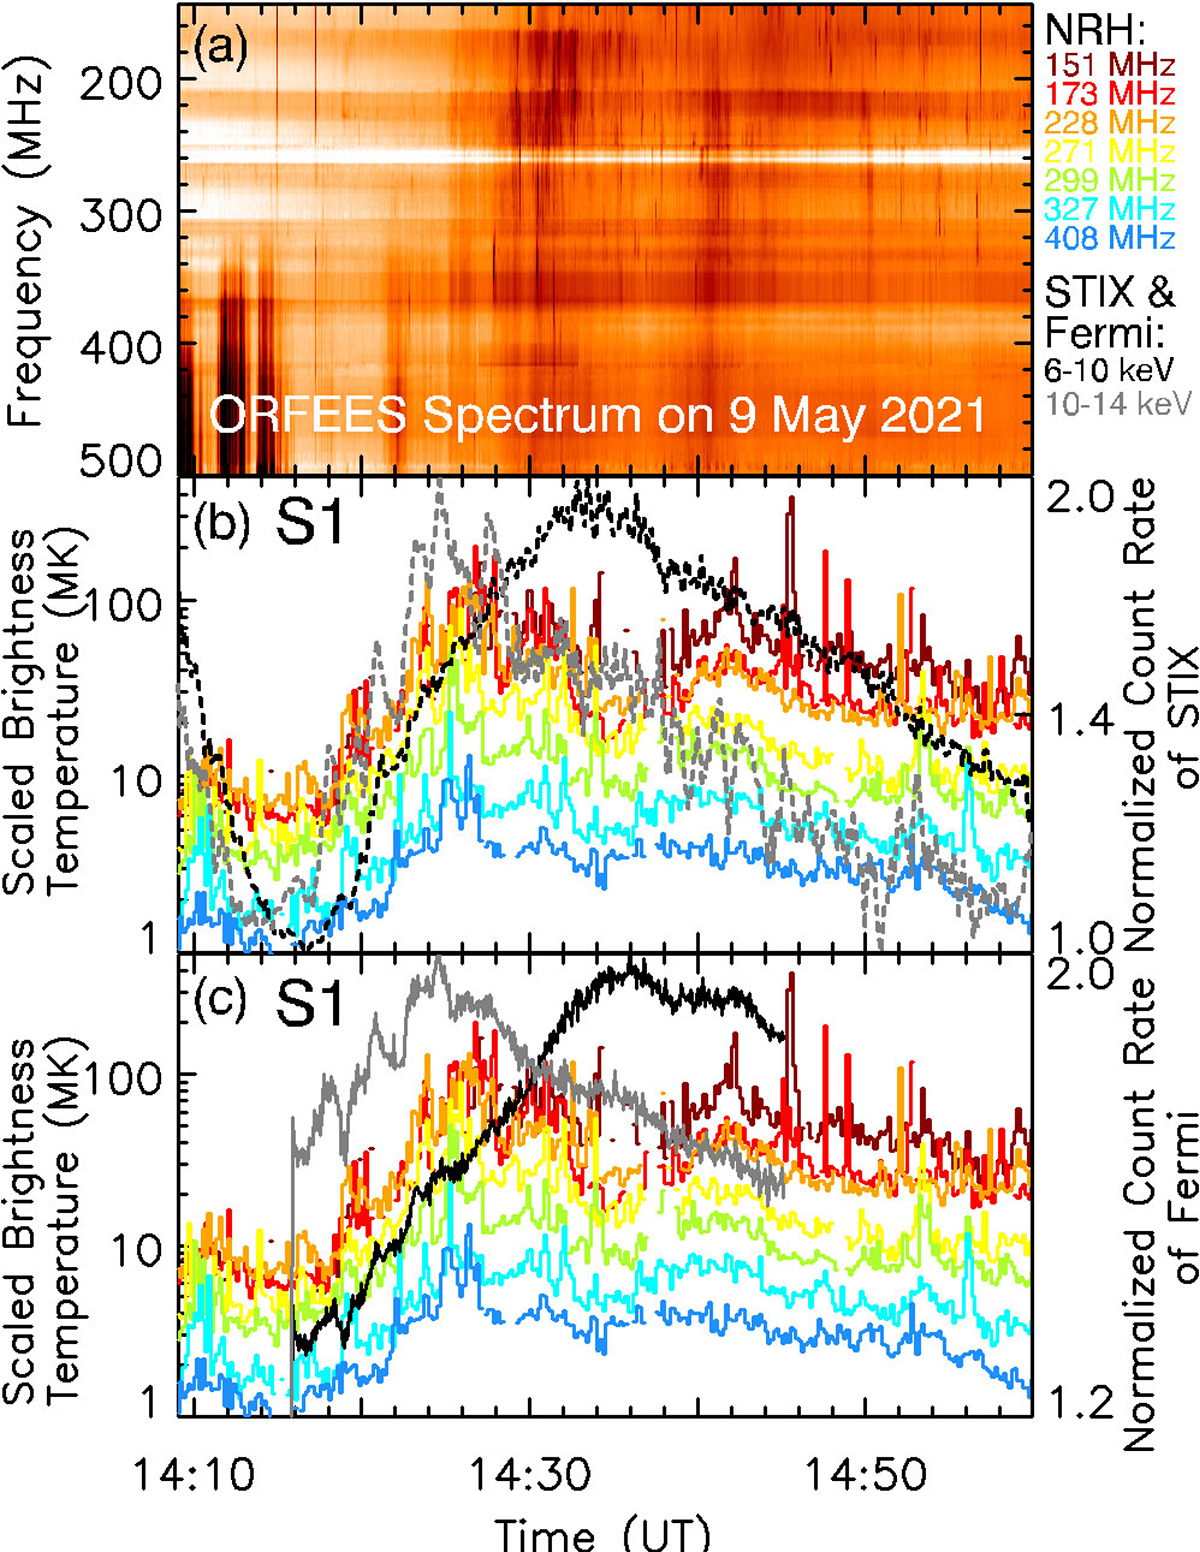
Fig. 10.
Download original image
Time profile of the brightness temperature of the main source of the stationary type IV radio sources (S1) from 14:09 to 15:00 UT. The top panel is the ORFEES spectrum. The middle panel is the brightness temperature time profiles of S1 and the STIX X-ray count rate in the 6–10 and 10–14 keV energy ranges. The bottom panel is the same S1 brightness temperature curves as the middle panel and GBM/Fermi X-ray count rates in the 6–10 and 10–14 keV energy ranges.
Current usage metrics show cumulative count of Article Views (full-text article views including HTML views, PDF and ePub downloads, according to the available data) and Abstracts Views on Vision4Press platform.
Data correspond to usage on the plateform after 2015. The current usage metrics is available 48-96 hours after online publication and is updated daily on week days.
Initial download of the metrics may take a while.