Fig. 2.
Download original image
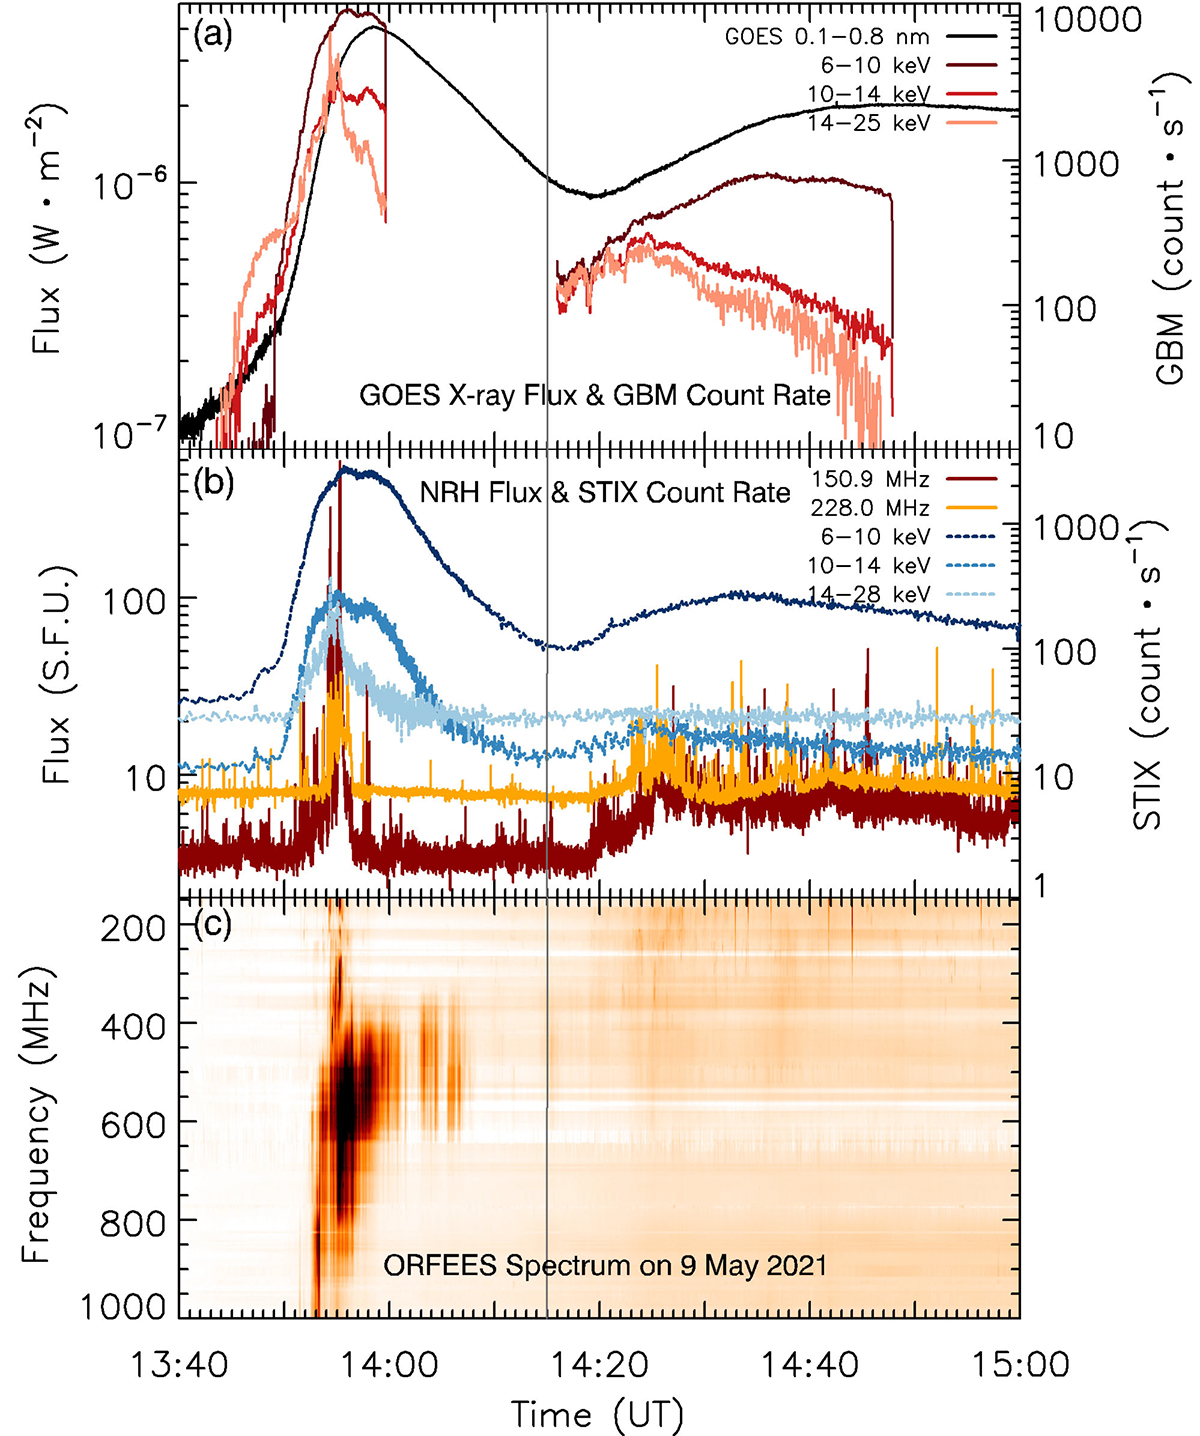
Overview of the event observed in X-ray and radio. (a) GOES soft X-ray flux profile at 0.1–0.8 nm (1.5–12.4 keV) (black curves) and GBM/Fermi X-ray count rates in three energy bands between 6 and 25 keV (solid red curves). The GBM/Fermi X-ray count rates are the sum of the count rate recorded by the three detectors NaI00, NaI01, and NaI05. (b) STIX X-ray count rates in three energy bands between 6 and 28 keV (dotted blue lines) and NRH radio flux time profiles at 150.9 MHz (ruby) and 228.0 MHz (orange, the same colors as the colors of the NRH imaging contours shown later in the paper). The NRH radio flux profiles come from the full Sun. (c) ORFEES radio dynamic spectrum.
Current usage metrics show cumulative count of Article Views (full-text article views including HTML views, PDF and ePub downloads, according to the available data) and Abstracts Views on Vision4Press platform.
Data correspond to usage on the plateform after 2015. The current usage metrics is available 48-96 hours after online publication and is updated daily on week days.
Initial download of the metrics may take a while.