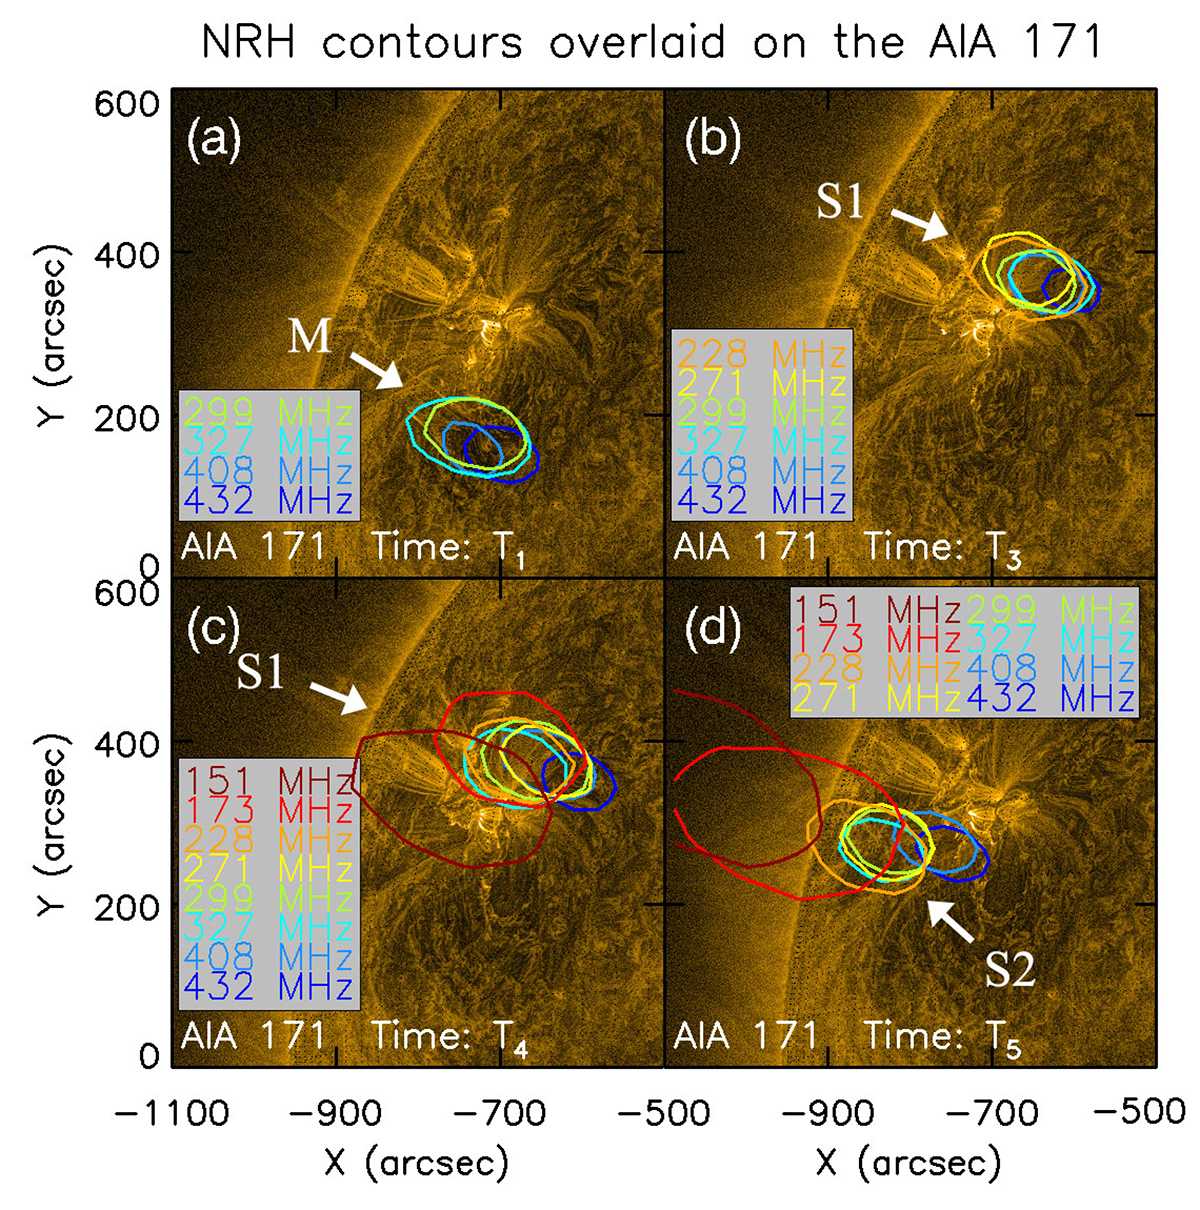
Fig. 4.
Download original image
NRH radio contours (the level is plotted at 80% of the maximum value at each frequency). The background is AIA/SDO at 171 Å. The NRH radio contours and AIA/SDO images are given in the same heliographic coordinate system and the unit is arcseconds. The contours in different colors denote different NRH imaging frequencies. The frequencies of 151, 173, 228 and 271 MHz in (a), and 151 and 173 MHz in (b) were removed since there is no radio emission at these frequencies and at the given time. (a) The time of the radio contours is at T1 and the AIA/SDO 171 Å image is at 14:15:21 UT. (b) The time of the radio contours is at T3 and the AIA/SDO 171 Å image is at 14:24:33 UT. (c) The time of the radio contours is at T4 and the AIA/SDO 171 Å image is at 14:32:45 UT. (d) The time of the radio contours is at T5 and the AIA/SDO 171 Å image is at 14:36:57 UT.
Current usage metrics show cumulative count of Article Views (full-text article views including HTML views, PDF and ePub downloads, according to the available data) and Abstracts Views on Vision4Press platform.
Data correspond to usage on the plateform after 2015. The current usage metrics is available 48-96 hours after online publication and is updated daily on week days.
Initial download of the metrics may take a while.