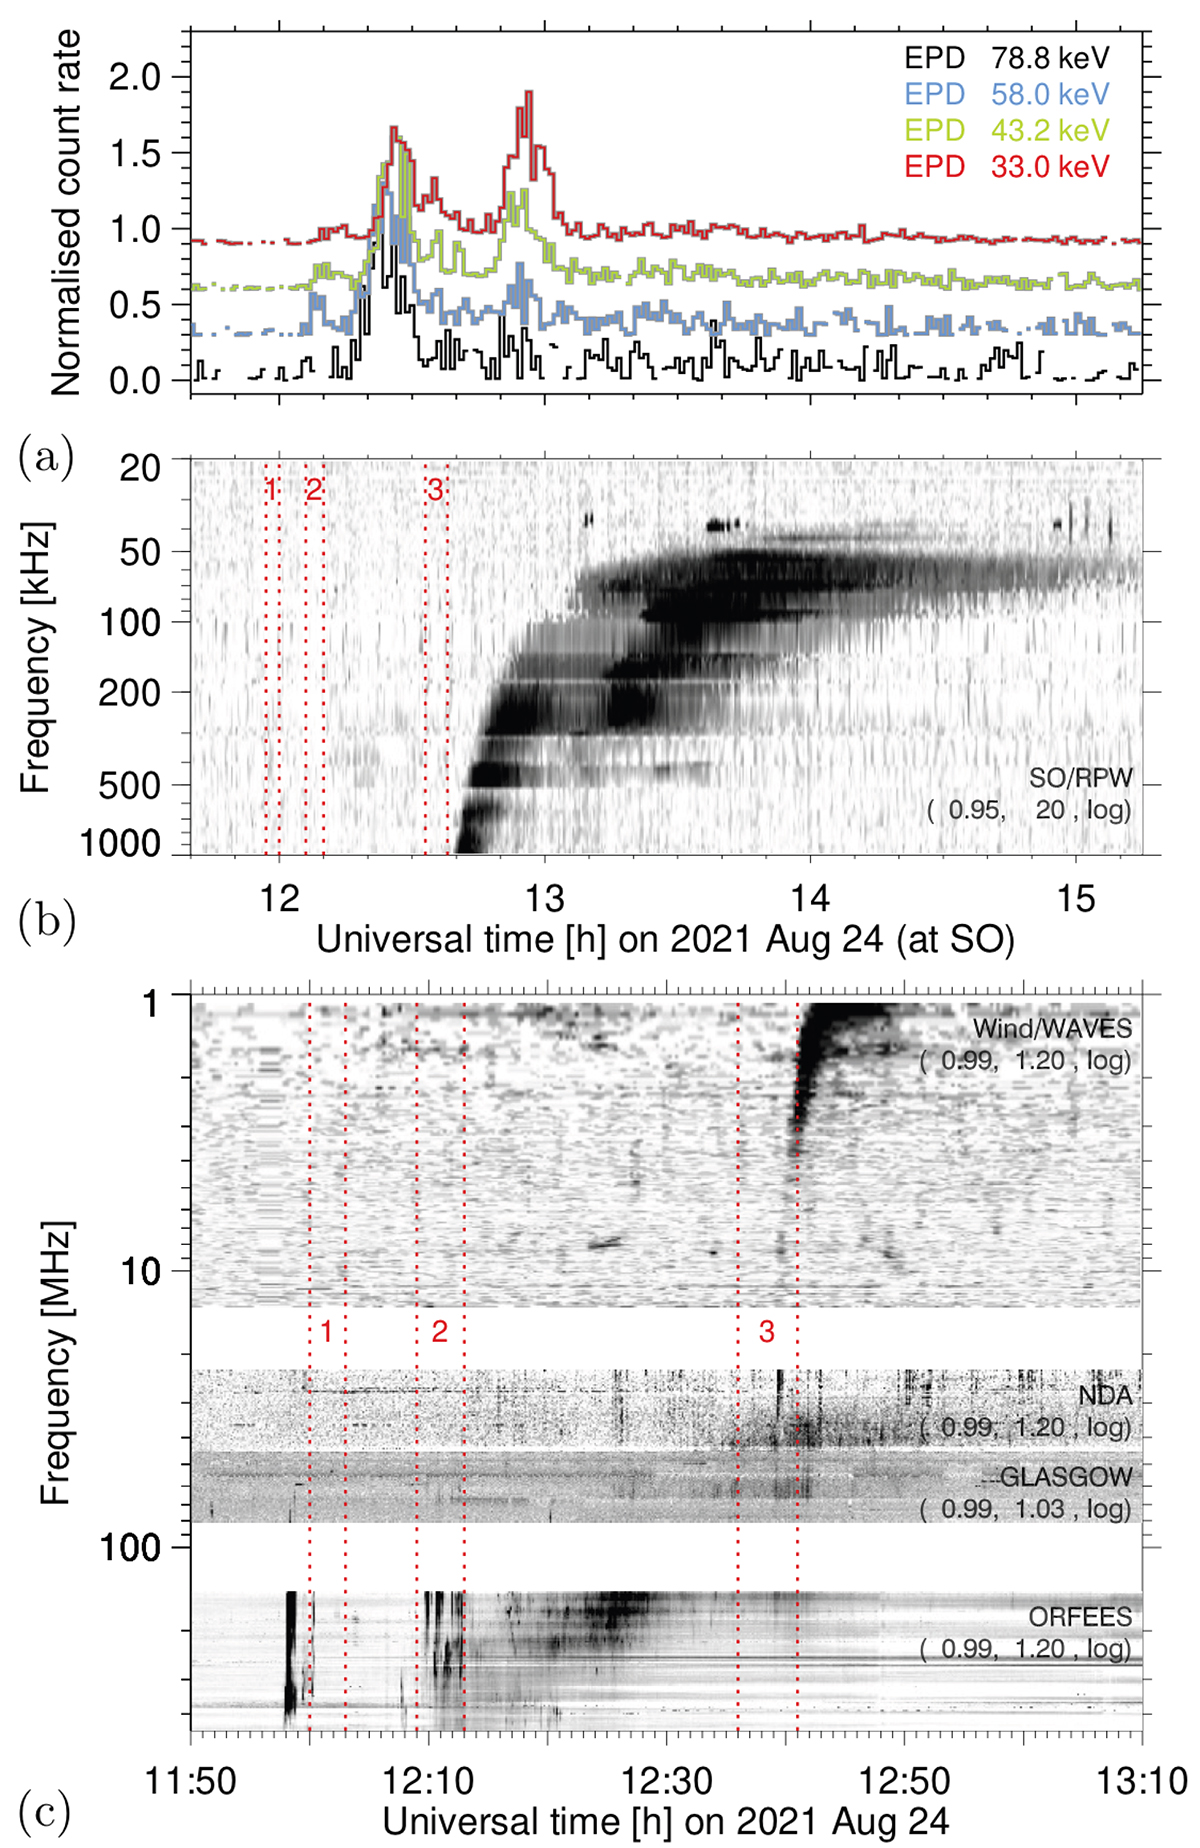
Fig. 11.
Download original image
Time histories of the electron events (a) and radio and Langmuir wave emission observed at Solar Orbiter (b) and broadband radio spectrum seen from the terrestrial viewpoint (c) on 2021 August 24. (a): Count rates of energetic electrons in different channels (Solar Orbiter/EPD/EPT). (b): Dynamic spectrum of the hectometric-to-kilometric type III burst and Langmuir waves (Solar Orbiter/RPW). The time given is the time at the spacecraft. Horizontal bands in (b) are residuals of radio interference. The vertical red lines in (b) are the initial solar release times of the three energetic electron events, to which the photon travel time of 320 s from the Sun to Solar Orbiter has been added. (c): Dynamic radio spectrum as seen from 1 AU (as Fig. 1). Red vertical lines show the initial release times of the electron events with added photon travel time 500 s.
Current usage metrics show cumulative count of Article Views (full-text article views including HTML views, PDF and ePub downloads, according to the available data) and Abstracts Views on Vision4Press platform.
Data correspond to usage on the plateform after 2015. The current usage metrics is available 48-96 hours after online publication and is updated daily on week days.
Initial download of the metrics may take a while.