Fig. 8.
Download original image
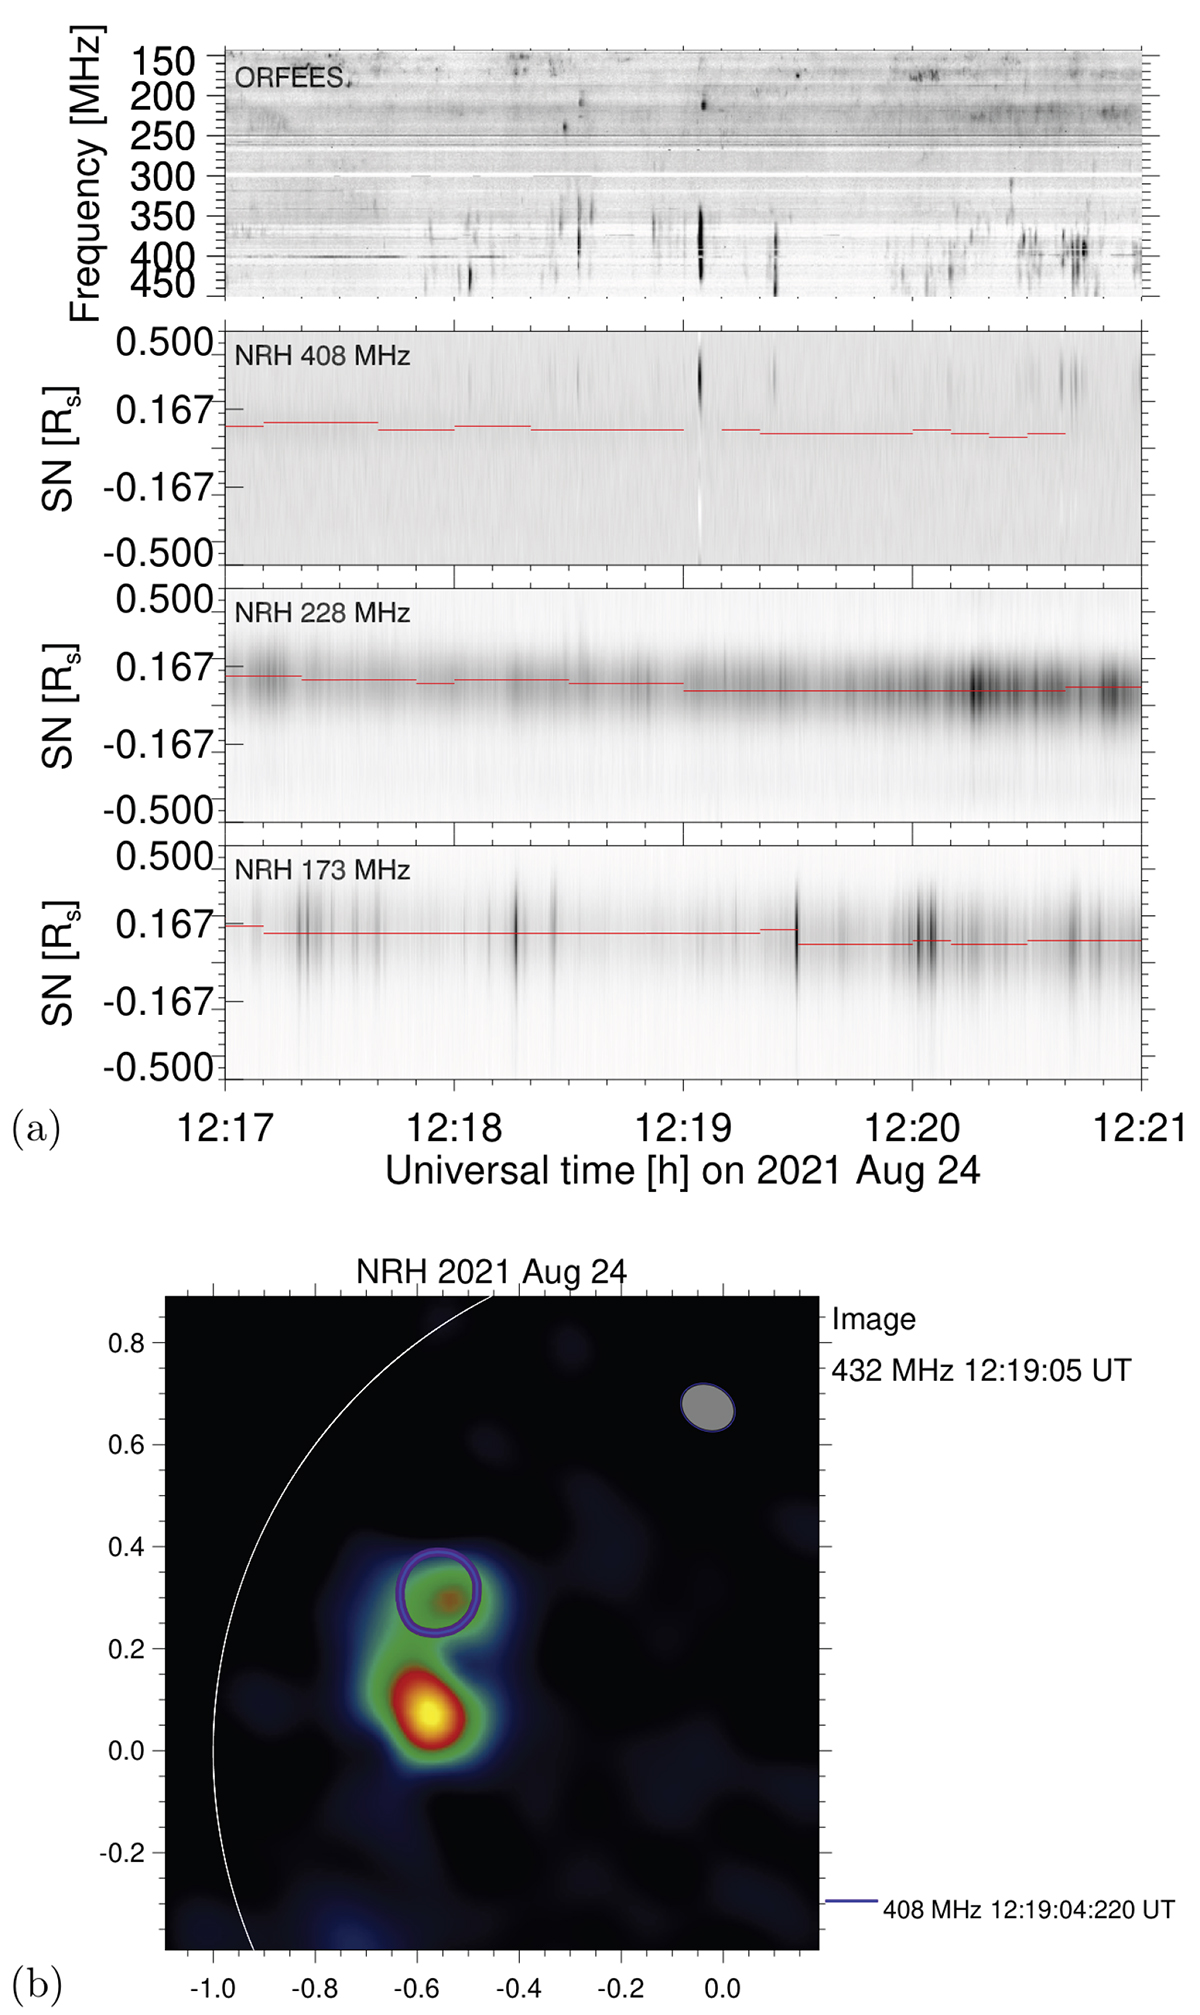
Time-differenced dynamic spectrum during part of the burst group 12:09–12:14 UT (a; dark shading shows increasing flux density) and the source configurations (b, c) during the first (∼12:09:35 UT) and third (∼12:09:46 UT) burst attaining the low-frequency border of the dynamic spectrum in (a). Time resolutions 1 s (ORFEES). The sources in (b, c) are represented by iso-intensity contours at half-maximum (NRH images with 0.25 s integration) at 228, 173, and 151 MHz overplotted on an image of the type IV source at 432 MHz (integration 10 s). The tilted ellipses near the upper right corner of the plots show the half-maximum levels of the interferometric beam.
Current usage metrics show cumulative count of Article Views (full-text article views including HTML views, PDF and ePub downloads, according to the available data) and Abstracts Views on Vision4Press platform.
Data correspond to usage on the plateform after 2015. The current usage metrics is available 48-96 hours after online publication and is updated daily on week days.
Initial download of the metrics may take a while.