Open Access
Fig. 6.
Download original image
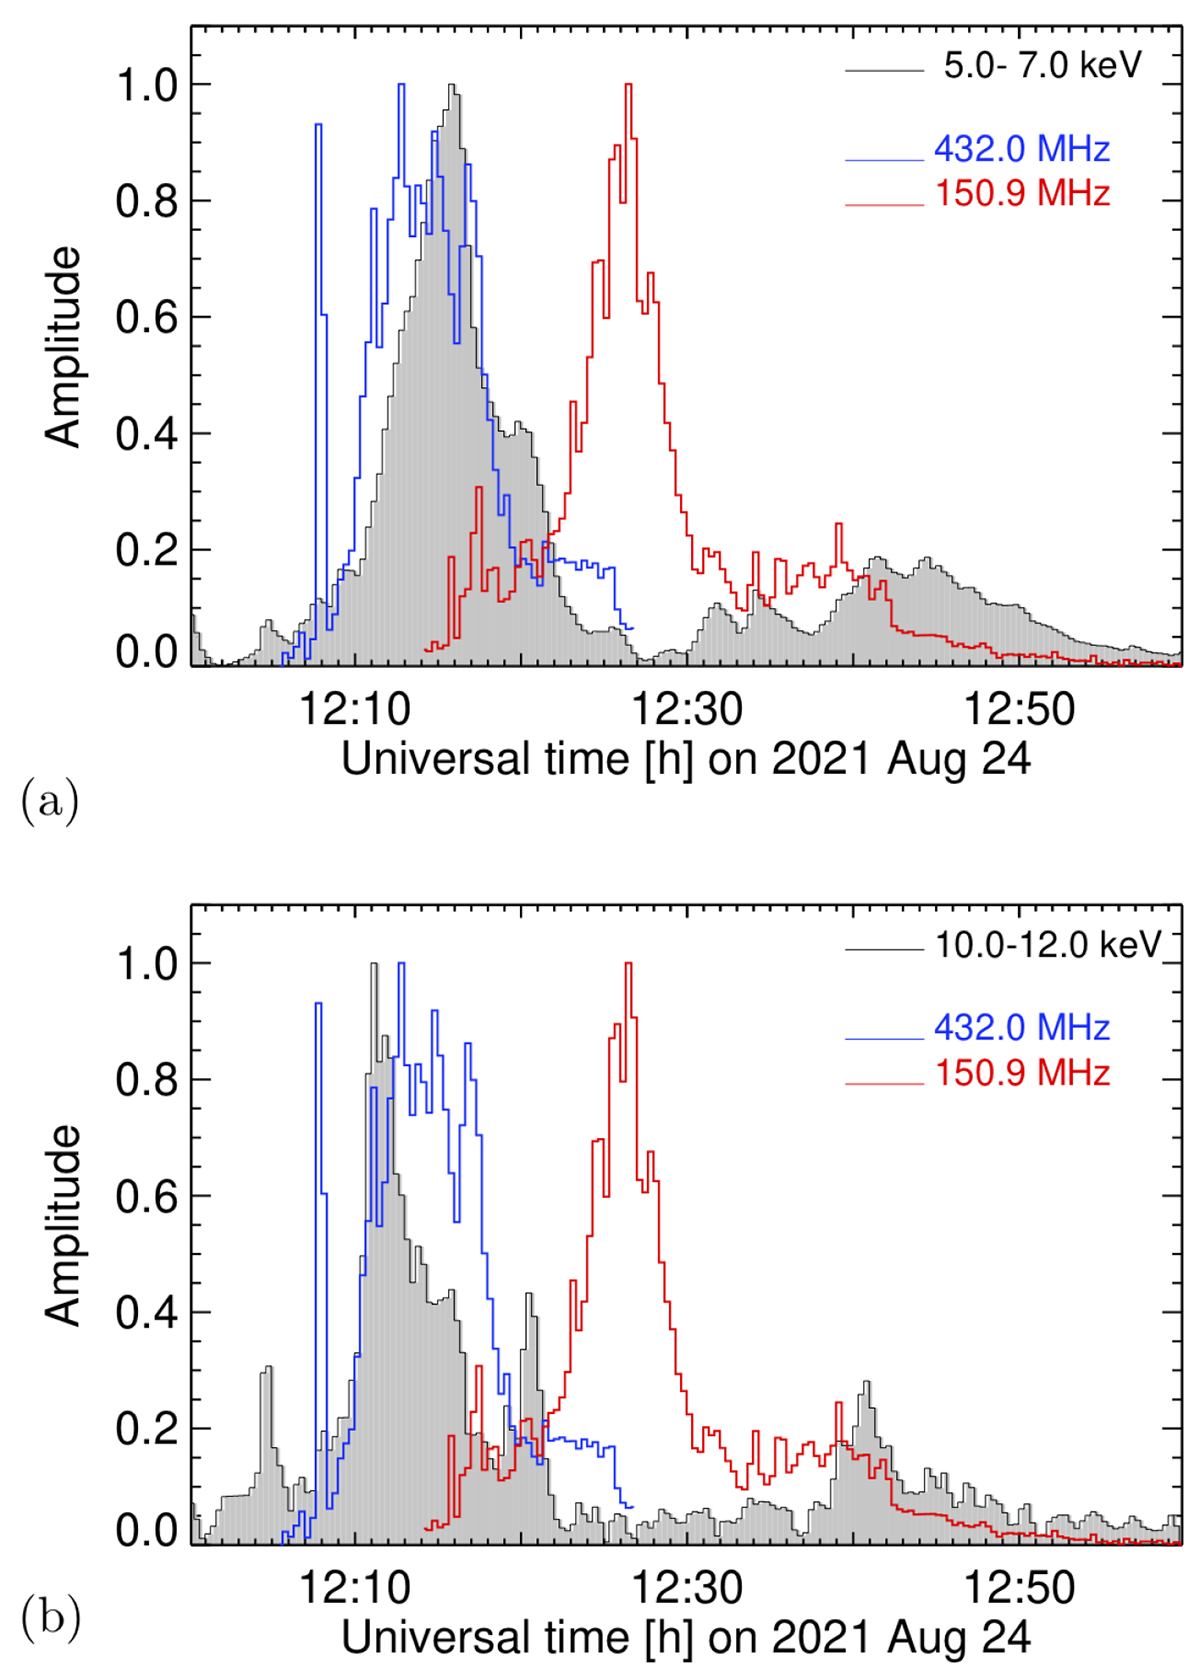
Comparison of radio brightness temperature profiles at 432 MHz (blue curve) and 151 MHz (red) with the X-ray count rates in two nominal energy ranges (black curve and grey-shaded background). The minimum value over the plot time range was subtracted from each light curve, which was then normalised to its maximum.
Current usage metrics show cumulative count of Article Views (full-text article views including HTML views, PDF and ePub downloads, according to the available data) and Abstracts Views on Vision4Press platform.
Data correspond to usage on the plateform after 2015. The current usage metrics is available 48-96 hours after online publication and is updated daily on week days.
Initial download of the metrics may take a while.