Fig. 12.
Download original image
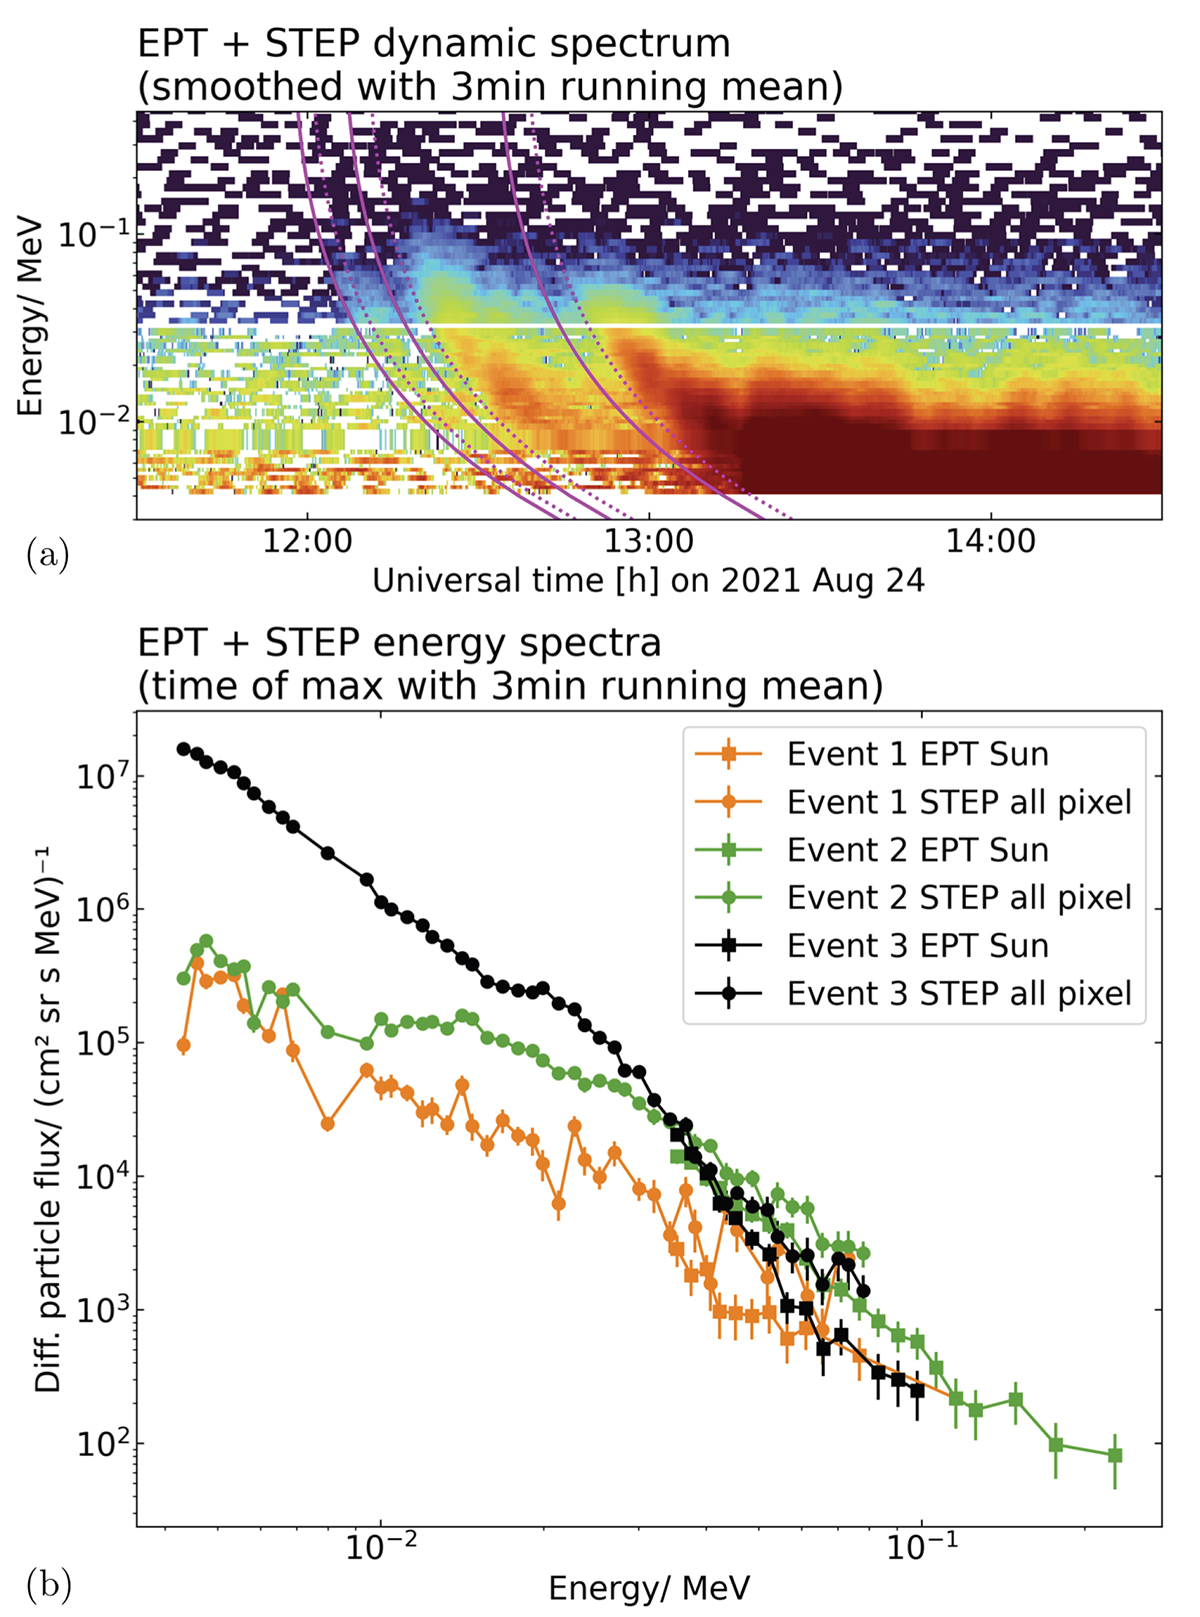
Dynamic and peak energy spectra of the electron events observed by the Solar Orbiter/EPD suite on 2021 August 24. (a) Dynamic spectrogram (EPT and STEP detectors). The data were smoothed by a running mean over 3 min. The magenta lines show the ideal dispersion for electrons injected at the earliest (solid lines) and latest (dotted lines) SRT times given for each event in Table 1. (b) Spectra of the differential electron flux at the maxima in each detector channel. A pre-event background taken 30 minutes before the first event was subtracted.
Current usage metrics show cumulative count of Article Views (full-text article views including HTML views, PDF and ePub downloads, according to the available data) and Abstracts Views on Vision4Press platform.
Data correspond to usage on the plateform after 2015. The current usage metrics is available 48-96 hours after online publication and is updated daily on week days.
Initial download of the metrics may take a while.