Fig. 5.
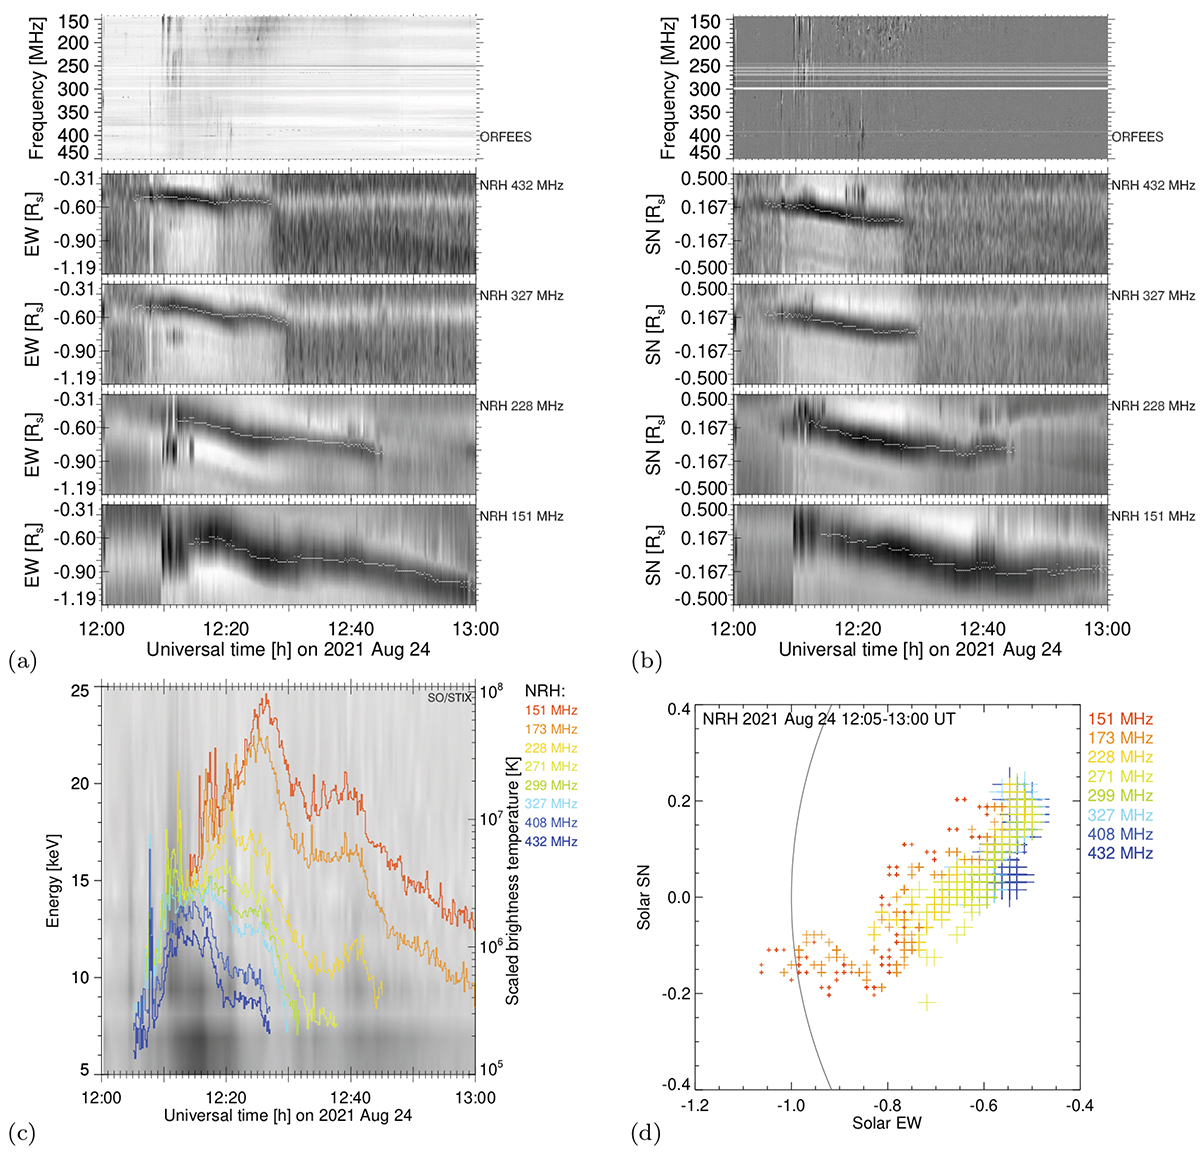
Download original image
First moving type IV burst: Time histories of the 1D brightness temperature scans projected onto the solar east–west (a) and south–north (b) directions at four NRH frequencies with the whole-Sun dynamic spectrum (a) and its time derivative (b) in the top panels. Dark shading of the 1D images means bright emission. The overplotted white lines show the positions of the brightest emission. The time histories of the peak brightness temperatures, scaled to a common beam width, are overplotted in (c) on the X-ray count-rate spectrum. Panel (d) shows the peak positions in the course of the event. The source motion proceeds south-eastward from the upper right to the lower left (see online Movie 01).
Current usage metrics show cumulative count of Article Views (full-text article views including HTML views, PDF and ePub downloads, according to the available data) and Abstracts Views on Vision4Press platform.
Data correspond to usage on the plateform after 2015. The current usage metrics is available 48-96 hours after online publication and is updated daily on week days.
Initial download of the metrics may take a while.