Fig. 2.
Download original image
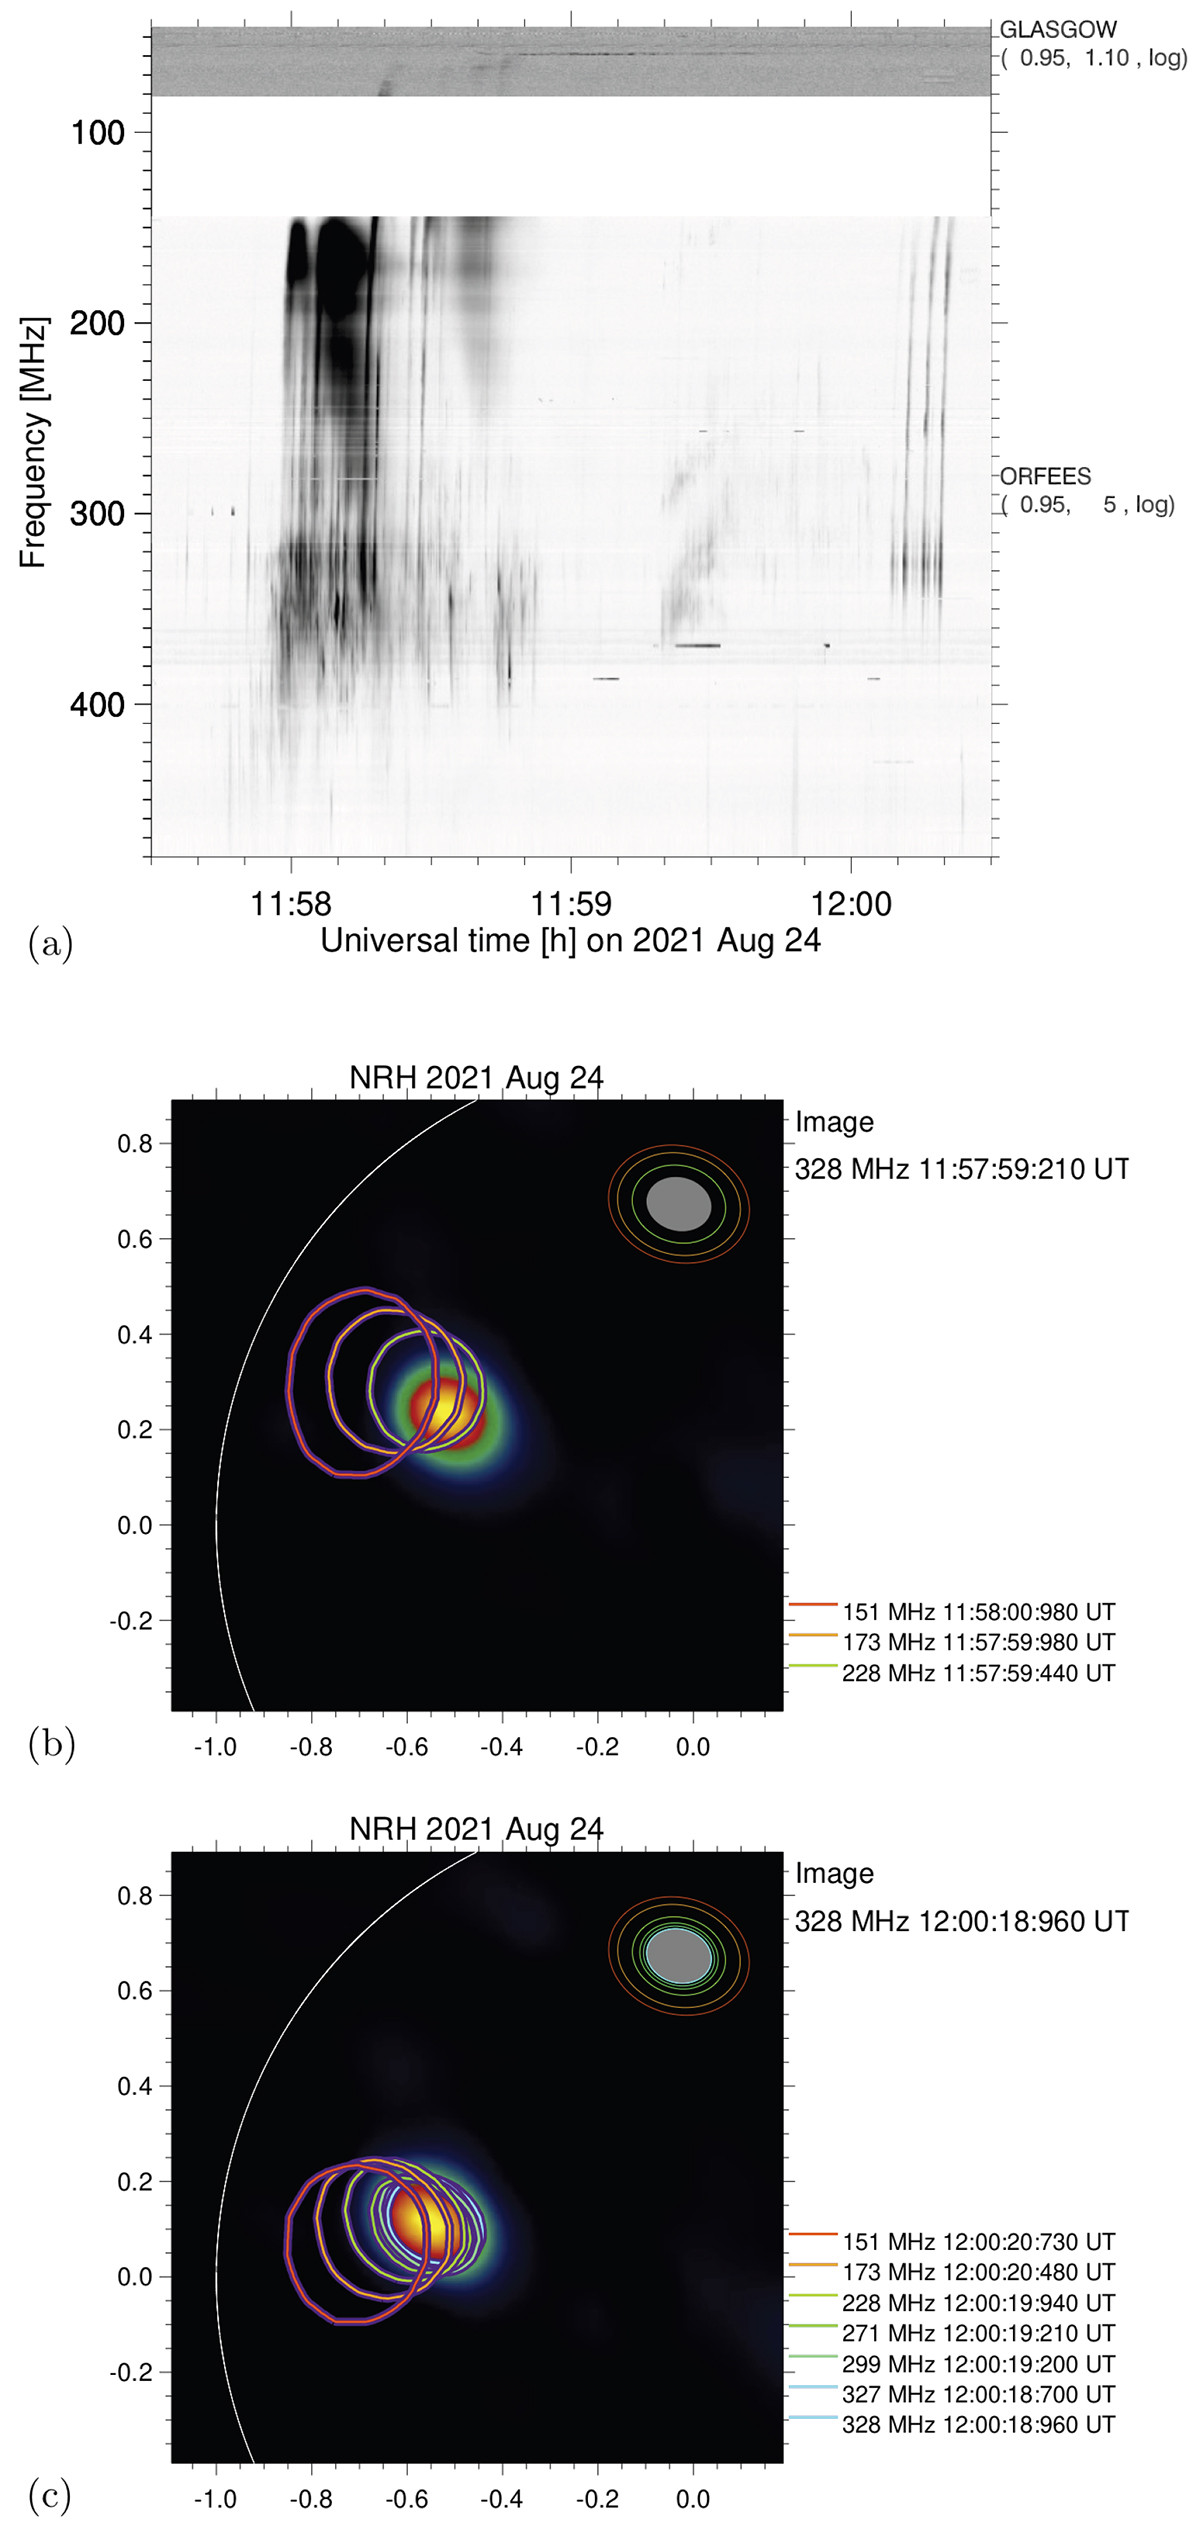
Decimetric-metric radio emission during the impulsive phase of the 2021 August 24 event. Panel (a): Dynamic spectrum (ORFEES, 0.1 s; Glasgow e-Callisto station, 0.25 s resolution). Dark shading indicates bright emission. Panels (b and c): NRH maps (iso-intensity contours superposed on an image) of the first J burst (b; 11:58:00 UT) and the last type III burst (panel c; 12:00:19 UT). The contours delineate the half-maximum level at the burst peak (0.25 s resolution); the different colours represent different frequencies (see legend at right). The set of tilted ellipses in the upper right corner shows the half-maximum levels of the nominal interferometric antenna beam. Solar north is at the top, east on the left. The white arc shows the optical solar limb.
Current usage metrics show cumulative count of Article Views (full-text article views including HTML views, PDF and ePub downloads, according to the available data) and Abstracts Views on Vision4Press platform.
Data correspond to usage on the plateform after 2015. The current usage metrics is available 48-96 hours after online publication and is updated daily on week days.
Initial download of the metrics may take a while.