Fig. 9.
Download original image
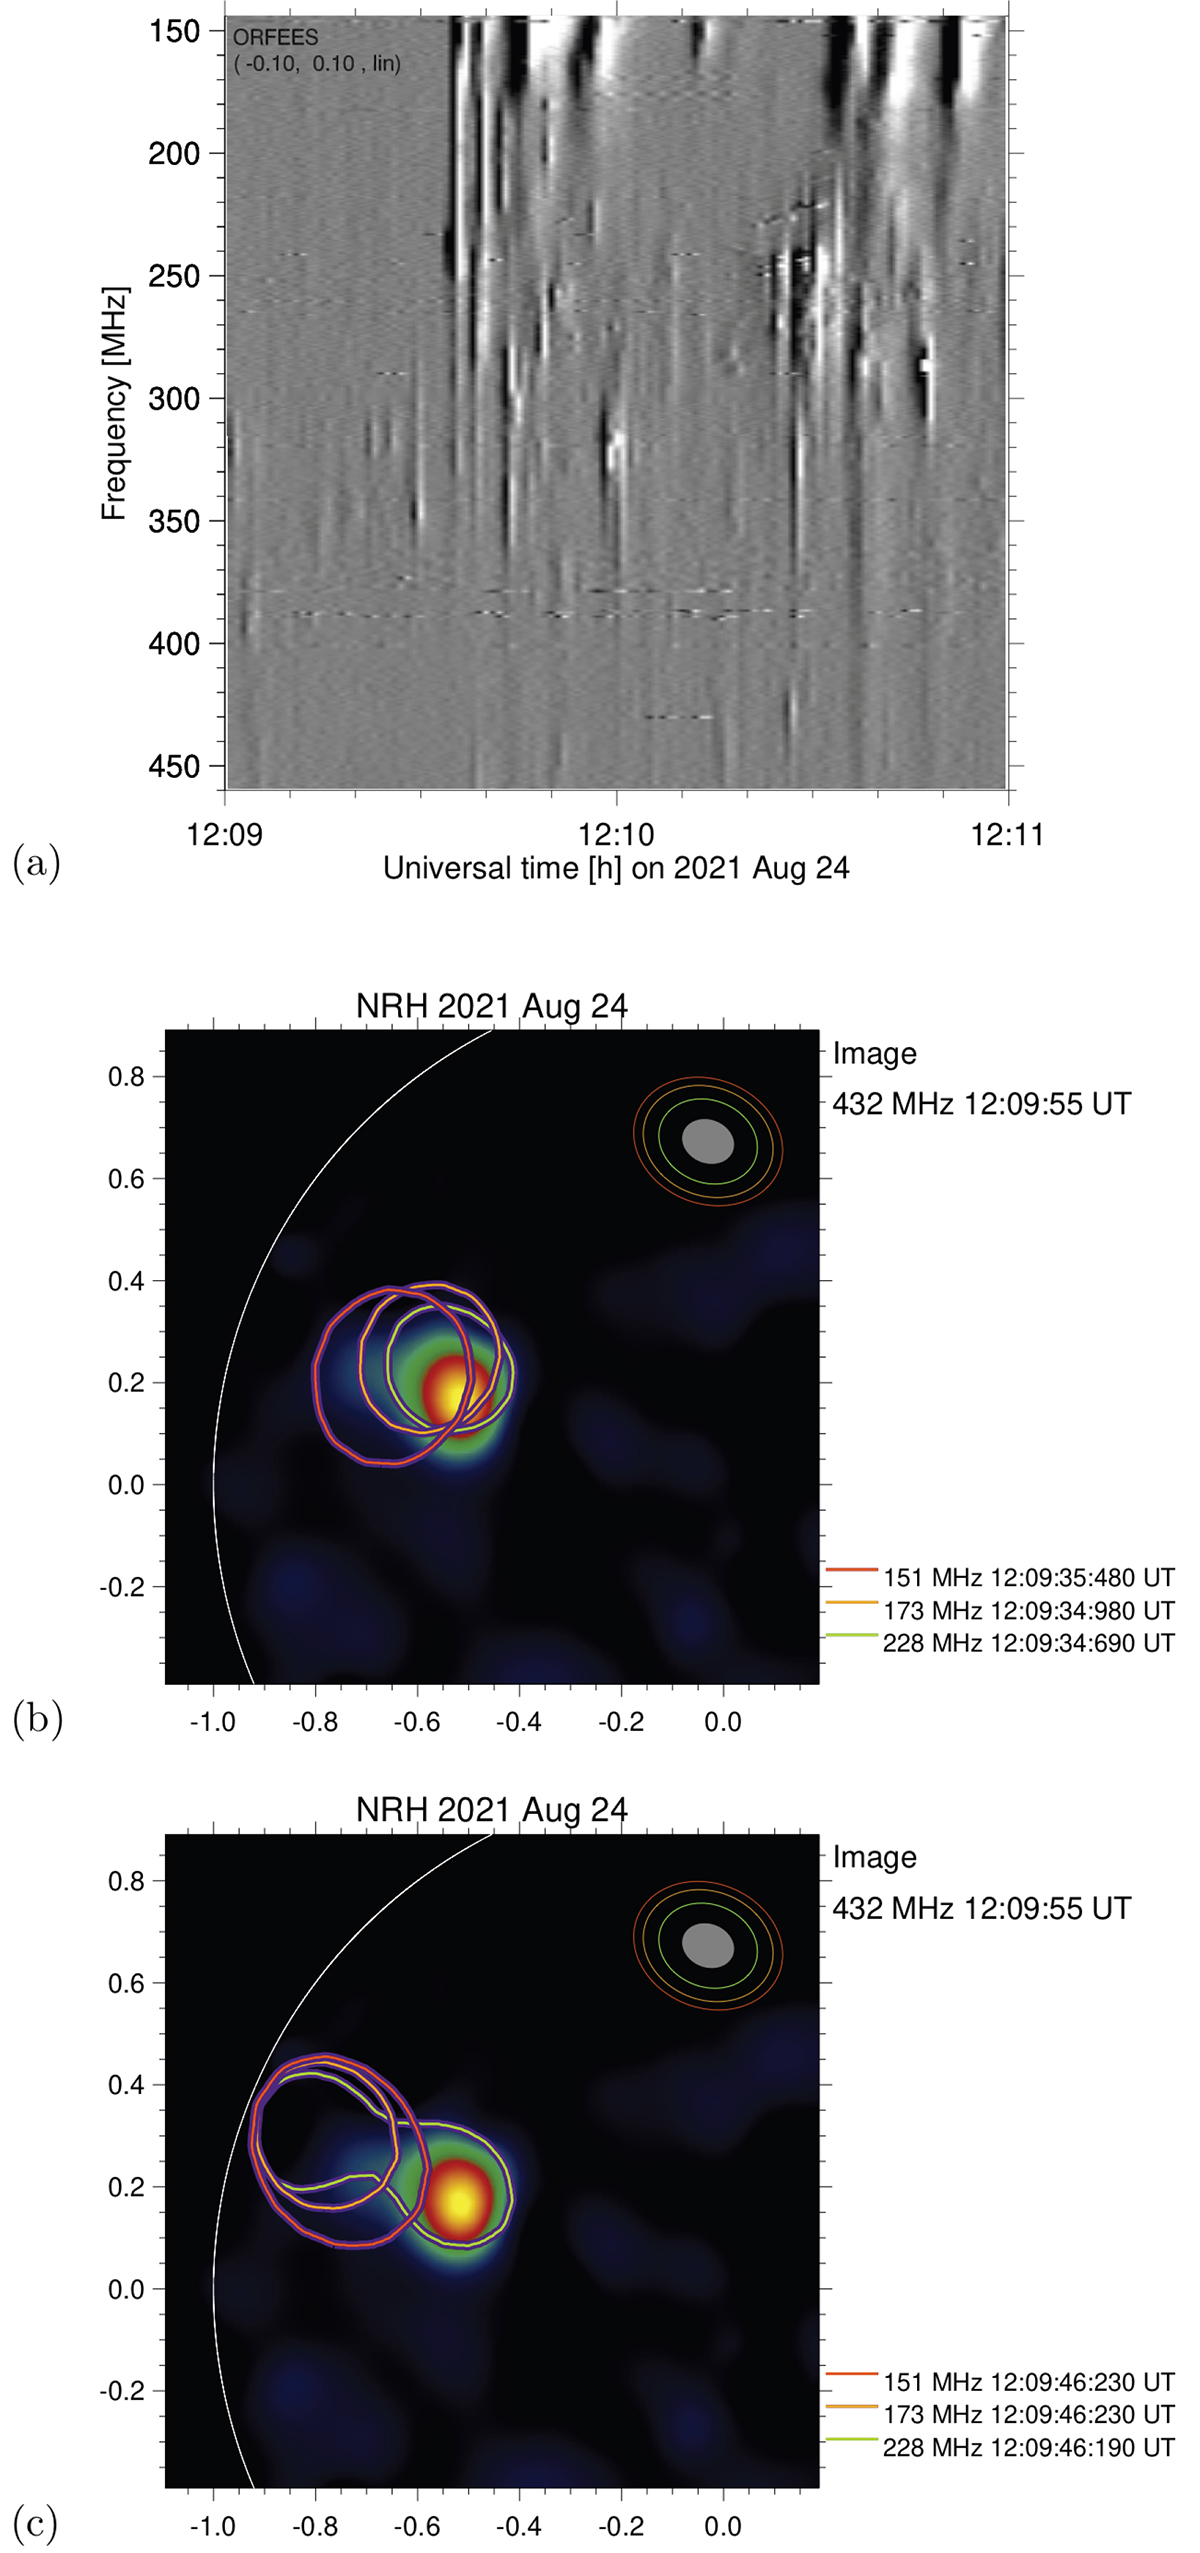
Dynamic spectrum and source location during the high-frequency burst group 12:17–12:21 UT. (a) ORFEES dynamic spectrum using 0.1 s time resolution (top panel; grey levels graded from 0.99 to 1.5 times the pre-event background, logarithmic scale), and the corresponding 1D images at three frequencies (NRH, 0.25 s integration). The overplotted red line marks the peak positions of the first moving type IV source (NRH, 10 s integration). (b) Map of the burst at 12:19:04 UT (iso-intensity contour at half-maximum at 408 MHz overplotted on the simultaneous image at 432 MHz; 0.25 s integration).
Current usage metrics show cumulative count of Article Views (full-text article views including HTML views, PDF and ePub downloads, according to the available data) and Abstracts Views on Vision4Press platform.
Data correspond to usage on the plateform after 2015. The current usage metrics is available 48-96 hours after online publication and is updated daily on week days.
Initial download of the metrics may take a while.