| Issue |
A&A
Volume 667, November 2022
|
|
|---|---|---|
| Article Number | A72 | |
| Number of page(s) | 16 | |
| Section | Stellar structure and evolution | |
| DOI | https://doi.org/10.1051/0004-6361/202142731 | |
| Published online | 08 November 2022 | |
From 3D hydrodynamic simulations of common-envelope interaction to gravitational-wave mergers⋆
1
Zentrum für Astronomie der Universität Heidelberg, Institut für Theoretische Astrophysik, Philosophenweg 12, 69120 Heidelberg, Germany
2
Heidelberger Institut für Theoretische Studien, Schloss-Wolfsbrunnenweg 35, 69118 Heidelberg, Germany
e-mail: fabian.schneider@h-its.org
3
Zentrum für Astronomie der Universität Heidelberg, Astronomisches Rechen-Institut, Mönchhofstr. 12-14, 69120 Heidelberg, Germany
4
Max Planck Computing and Data Facility, Gießenbachstraße 2, 85748 Garching, Germany
5
Max Planck Institute for Astrophysics, Karl-Schwarzschild-Str. 1, 85748 Garching, Germany
6
University of Oxford, St Edmund Hall, Oxford OX1 4AR, UK
Received:
23
November
2021
Accepted:
10
July
2022
Modelling the evolution of progenitors of gravitational-wave merger events in binary stars faces two major uncertainties: the common-envelope phase and supernova kicks. These two processes are critical for the final orbital configuration of double compact-object systems with neutron stars and black holes. Predictive one-dimensional models of common-envelope interaction are lacking and multidimensional simulations are challenged by the vast range of relevant spatial and temporal scales. Here, we present three-dimensional, magnetohydrodynamic simulations of the common-envelope interaction of an initially 10 M⊙ red supergiant primary star with a black-hole and a neutron-star companion. Employing the moving-mesh code AREPO and replacing the core of the primary star and the companion with point masses, we show that the high-mass regime is accessible to full ab initio simulations. About half of the common envelope is dynamically ejected at the end of our simulations and the ejecta mass fraction keeps growing. Almost complete envelope ejection seems possible if all ionised gas left over at the end of our simulation eventually recombines and the released energy continues to help unbind the envelope. We find that the dynamical plunge-in of both companions terminates at orbital separations that are too wide for gravitational waves to merge the systems in a Hubble time. However, the orbital separations at the end of our simulations are still decreasing such that the true final value at the end of the common-envelope phase remains uncertain. We discuss the further evolution of the system based on analytical estimates. A subsequent mass-transfer episode from the remaining 3 M⊙ core of the supergiant to the compact companion does not shrink the orbit sufficiently either. A neutron-star–neutron-star and neutron-star–black-hole merger is still expected for a fraction of the systems if the supernova kick aligns favourably with the orbital motion. For double neutron star (neutron-star–black-hole) systems we estimate mergers in about 9% (1%) of cases while about 77% (94%) of binaries are disrupted; that is, supernova kicks actually enable gravitational-wave mergers in the binary systems studied here. Assuming orbits smaller by one-third after the common-envelope phase enhances the merger rates by about a factor of two. However, the large post-common-envelope orbital separations found in our simulations mean that a reduction in predicted gravitational-wave merger events appears possible.
Key words: hydrodynamics / methods: numerical / stars: massive / supergiants / binaries: close
Movies associated to Figs. A.1 and A.2 are only available at https://www.aanda.org
© M. M. Moreno et al. 2022
 Open Access article, published by EDP Sciences, under the terms of the Creative Commons Attribution License (https://creativecommons.org/licenses/by/4.0), which permits unrestricted use, distribution, and reproduction in any medium, provided the original work is properly cited.
This article is published in open access under the Subscribe-to-Open model. Subscribe to A&A to support open access publication.
1. Introduction
Common-envelope (CE) interaction is one of the major uncertainties in modelling the progenitor evolution of gravitational-wave-induced mergers of neutron stars (NSs) and black holes (BHs) within the framework of isolated binaries (e.g. Voss & Tauris 2003; Dominik et al. 2012; Ivanova et al. 2013; Tauris et al. 2017; Vigna-Gómez et al. 2018; Giacobbo & Mapelli 2018; Kruckow et al. 2018; Belczynski et al. 2020). In these CE phases, the compact companion in a binary system is engulfed by the envelope of a supergiant primary star and gravitational drag leads to its inspiral. The ‘core binary’ formed from the compact object and the core of the supergiant transfers orbital energy and angular momentum to the envelope material, which may cause envelope ejection. This process leaves behind a system with a short orbital period that may eventually merge due to gravitational wave emission, provided it is not disrupted by the supernova (SN) explosion of the supergiant’s core – which is the other major uncertainty in the evolution (e.g. Podsiadlowski et al. 2004; Vigna-Gómez et al. 2018; Giacobbo & Mapelli 2018; Belczynski et al. 2020; Mandel et al. 2021).
Rate predictions for gravitational wave emission events (e.g. Abadie et al. 2010; Mandel & Broekgaarden 2022) require the modelling of the source evolution. Population synthesis studies commonly used for this purpose employ simple parametrised treatments of CE evolution; see for example Hurley et al. (2002), Dominik et al. (2012), Stevenson et al. (2017), Vigna-Gómez et al. (2018), Mapelli & Giacobbo (2018), Kruckow et al. (2018), and Belczynski et al. (2020). A predictive modelling of the entire CE phase also appears difficult in more elaborate one-dimensional (1D), stellar evolution models; for example because the CE process itself lacks spatial symmetry, especially during the dynamic plunge-in of the companion into the envelope of the giant star (e.g. Bodenheimer & Taam 1984; Ivanova et al. 2013, 2015; Ivanova & Nandez 2016; Clayton et al. 2017; Fragos et al. 2019). While these simplified 1D CE models are very useful and deliver much insight, a full and proper treatment requires three-dimensional hydrodynamic simulation approaches.
Even for systems involving low-mass stars, such hydrodynamic simulations pose substantial challenges: The spatial scale range spanned by the extent of the giant star’s envelope, its tiny core, and the – perhaps compact – companion has to be resolved. This wide range of spatial scales introduces a severe timescale problem because of the Courant–Friedrichs–Lewy (CFL) stability condition (Courant et al. 1928) when using time-explicit hydrodynamics solvers. Moreover, setting up CE simulations requires diligence to ensure initial hydrostatic equilibrium (HSE) in the envelope of the primary star. Usually, these problems are addressed by replacing the stellar cores with point masses (see e.g. Ohlmann et al. 2017, for a consistent procedure).
In systems involving massive primary stars, the challenges increase even further: The larger spatial extent of supergiants amplifies the scale problem. Supergiant stars have a less pronounced core–envelope structure and it is unclear which part of the core can safely be absorbed in the simplified point mass treatment (see e.g. Dewi & Tauris 2000; Tauris & Dewi 2001; Podsiadlowski et al. 2003; Kruckow et al. 2016). For very massive stars, additional physical effects such as radiation transport become important for the stellar structure (Ricker et al. 2019b), and convection may also play a role, especially after the dynamical plunge-in (e.g. Meyer & Meyer-Hofmeister 1979; Sabach et al. 2017; Wilson & Nordhaus 2019, 2020). Given these difficulties in simulating CE interaction with massive stars, there are only a limited number of published models (e.g. Terman et al. 1995; Ricker et al. 2019b; Law-Smith et al. 2020; Lau et al. 2022). These are clearly challenged by the wide spatial and temporal scale ranges. Some early models consider the inspiral of a NS into the envelopes of 16 M⊙ and 24 M⊙ stars and conclude that the binary can likely avoid a merger and thus survive the CE phase if the massive primary star is an evolved red supergiant (Terman et al. 1995). Ricker et al. (2019a) present a test setup with a very massive primary star (82.1 M⊙ at the onset of CE evolution) and follow a system with a massive BH companion for a few orbits. Law-Smith et al. (2020) shortcut the scale problem by removing the outer layers of their 12 M⊙ (at zero-age main sequence) primary star trimming its envelope from the ∼1000 R⊙ it has at the onset of CE evolution to 10 R⊙ before starting their hydrodynamic simulation with a companion representing a NS.
Here, we present simulations with the moving-mesh (magneto-) hydrodynamic code AREPO (Springel 2010) that follow the inspiral and envelope-ejection phase of systems with an initially 10 M⊙ red supergiant (RSG) primary star and two companion masses, 1.4 and 5.0 M⊙, chosen to represent a NS and a BH, respectively. The NS and BH companions are not resolved and we do not consider accretion processes, jet launching, or neutrino cooling from such objects among other things. Similar simulations of CE interaction in lower mass systems with the AREPO code were published by Ohlmann et al. (2016a,b), Sand et al. (2020), Kramer et al. (2020), and Ondratschek et al. (2022). We demonstrate that the high-mass star regime is accessible to current three-dimensional (3D) hydrodynamic simulations comprising the entire CE system and covering the full inspiral phase. Lau et al. (2022) conduct simulations similar to ours, but they employ smoothed-particle-hydrodynamics (SPH) computations of the CE phase and consider an initially 12 M⊙ star.
In CE simulations with lower mass primary stars, the final orbital separations of the remnant core binary are typically too wide compared to observations of post-CE binaries (see e.g. Iaconi et al. 2017). For our simulations with a massive primary star, we encounter a similar phenomenon: the inspiral on a dynamic timescale comes to an end and the orbital separations at the end of the simulations are too wide for gravitational-wave emission to immediately and robustly result in NS-NS and NS-BH mergers. Hence, we discuss the further evolution of the remnant binary after CE ejection through another phase of mass transfer and the second SN (see also Tauris et al. 2015; Jiang et al. 2021).
In Sect. 2, we briefly summarise our CE simulation methods and describe the preparation of the primary star model and the setup of the binary systems. The results of our 3D hydrodynamic simulations are presented in Sect. 3 and the further evolutionary modelling of the post-CE binary up to the compact-object merger stage is considered in Sect. 4. We discuss our results in Sect. 5 and conclude in Sect. 6.
2. Methods
We follow the procedures developed by Ohlmann et al. (2016a, 2017), and Sand et al. (2020) for conducting simulations of CE interaction and refer to these publications for further details. Here, we summarise only a few key aspects of our modelling.
Our approach consists of three steps: First, we evolve a 1D model of a massive star with MESA version 12115 (Paxton et al. 2011, 2013, 2015, 2018, 2019) until it reaches the desired supergiant stage (Sect. 2.1). This model is then mapped into the moving-mesh code AREPO (Springel 2010), which was adapted to CE problems (Ohlmann et al. 2016a). Second, the mapped model is relaxed in AREPO to ensure that the star is in HSE and remains so over several dynamic timescales (Sect. 2.2). Third, the actual simulation of the interacting binary system is carried out by adding a companion to the primary-star model (Sect. 2.3).
In the moving-mesh magnetohydrodynamics (MHD) code AREPO, we use the tabulated OPAL equation of state (Rogers et al. 1996; Rogers & Nayfonov 2002). This requires a Riemann solver that is compatible with such a general equation of state. For solving the Riemann problems at the cell interfaces, we employ the HLLD scheme (Miyoshi & Kusano 2005) with fallback options to the HLL (Harten et al. 1983) and the Rusanov fluxes (Rusanov 1961), as described in Pakmor et al. (2011).
2.1. Common-envelope progenitor
Simulating the evolution of CE phases is challenging in itself and becomes numerically even more difficult with more massive primary stars relevant for the formation of NS-NS, NS-BH, and BH-BH mergers. In more massive stars, the gravitational potential is deeper, and therefore greater temperatures and higher sound speeds are reached, reducing the CFL-limited integration time-steps. Also, the spatial scales become larger and even radiation transport is important in the envelopes of very massive stars (≳30 M⊙; see e.g. Sanyal et al. 2017; Ricker et al. 2019b).
In order to ease the CE computations, we select a primary star that has an initial mass that is as low as possible while still forming a NS at the end of its life. We pick an initially 10 M⊙ star of solar metallicity (e.g. Sukhbold et al. 2016). The evolution of the star is followed through core carbon burning to identify a RSG stage at which the star has developed a clear core–envelope structure and where the binding energy of the envelope,
is lower than the available orbital energy,
In Eqs. (1) and (2), the integrals are from some inner core boundary Mcore to the surface Msurf, m is the mass coordinate and r the corresponding radius, u is the internal energy (including recombination energies), and the factor αth quantifies the fraction of internal energy considered in the overall envelope-binding energy. The mass of the primary star at the onset of CE interaction is M1 and M2 denotes the mass of the companion. The initial and final orbital separations are ai and af. Having an orbital energy exceeding the binding energy of the envelope makes a successful envelope ejection energetically possible.
A successful CE phase will remove almost the entire hydrogen-rich envelope of stars and can thereby influence their further evolution and final fate. In particular, losing the envelope of an initially 10 M⊙ star early on in the evolution may make it impossible for the star to explode in a supernova and produce a neutron star. However, this appears unlikely if the envelope is lost only after core-helium burning (Podsiadlowski et al. 2004; Schneider et al. 2021).
For these reasons, in our CE simulation, we use a post core-helium-burning star as primary that has just reached a radius in excess of its maximum radius before core-helium burning. At this point in evolution (at an age of about 25.5 Myr), the model has a present-day mass of M1 = 9.40 M⊙, a radius of 395 R⊙, a logarithmic luminosity of log L/L⊙ = 4.35, and an effective temperature of 3564 K. The chemical structure of the model and the envelope binding energy are shown in Fig. 1, and the density structure in Fig. 2.
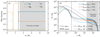 |
Fig. 1. Chemical composition as a function of mass coordinate m (panel a) and envelope binding energy as a function of radius r (panel b) of the RSG primary star. In both panels, the grey shaded area indicates the convective envelope and the vertical dot-dashed black line is the location at which the hydrogen mass fraction X = 0.1. In panel b, the released orbital energy of inspiralling companions of 1.4 and 5.0 M⊙ are also shown (Eq. (2)) as well as the envelope binding energies as computed from the relaxed AREPO model (thick transparent lines at r ≥ 20 R⊙; the maximum deviation with respect to the MESA model is < 5%). |
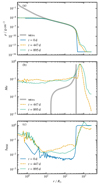 |
Fig. 2. Original MESA and mapped models of the primary star. Shown are (a) density, (b) Mach number and (c) relative deviation from HSE according to Eq. (3) as a function of radius (quantities are averages over spherical shells). The times t = 447 d and t = 895 d correspond to the end of the damping and the end of the relaxation step, respectively. At time t = 0 d, there are no velocities in the AREPO model yet, and this is why the Mach number in panel b cannot be seen. |
It is a priori unknown how much of the envelope mass will be ejected in a CE phase and several criteria are currently being used to determine how much of the envelope needs to be ejected to avoid an immediate re-growth of the giant star. The latter can be approximated, for example, by the so-called compression point where the sonic velocity reaches a maximum (i.e. local maximum of the ratio of pressure and density; Ivanova 2011) and by the point in the envelope where the hydrogen mass fraction X drops below 0.1 (Dewi & Tauris 2000). Both points are below the convective envelope (mass coordinate m = 3.07 M⊙, radius r = 17.9 R⊙) and inside the hydrogen-burning shell (Fig. 1a): the maximum compression point is at m = 2.78 M⊙ (r = 0.40 R⊙) while the point of X = 0.1 is at m = 2.76 M⊙ (r = 0.33 R⊙). Therefore, in our model the two characteristic points almost coincide.
The envelope binding energy at these points (Fig. 1b) is lower by at least one order of magnitude than the available orbital energy of binary systems with companion masses of M2 = 1.4 M⊙ and 5.0 M⊙. The binding energies increase only slightly from the bottom of the convective envelope to the location at which X = 0.1 (by factors of 2.3, 2.9 and 5.3 for αth = 0.0, 0.5 and 1.0, respectively). On the contrary, the available orbital energy increases by a factor of 48.3. These energetics render a successful envelope ejection very likely, as confirmed by the simulations discussed in Sect. 3.
To map the structure of the primary star to the unstructured grid of AREPO, we follow the procedure developed by Ohlmann et al. (2017). From the surface of the star to the core, the density spans more than 13 orders of magnitude. Simulating the entire star in AREPO would render the CFL-limited numerical integration time-steps prohibitively small. Unfortunately, it is not currently possible to cut out only the helium core and have the entire hydrogen-rich layers (including the X = 0.1 point) on the AREPO grid because of the wide range of scales. In our three primary star models, we therefore replace the innermost Rcut = 10 R⊙, 20 R⊙, and 40 R⊙ with point particles of 2.92 M⊙, 2.97 M⊙, and 3.03 M⊙, respectively. These interact only gravitationally with the envelope gas and the (later added) companion star. As discussed in Sect. 5.2, we find converged results in terms of orbital separation in our CE simulations for the models with Rcut = 10 R⊙ and Rcut = 20 R⊙. We attribute this to the rather slow increase in the binding energy as a function of radius throughout the hydrogen-rich envelope (Fig. 1b) and the small amount of mass contained in the hydrogen-burning shell (0.31 M⊙), which is the region above the helium core and below the convective envelope. However, this is a complex issue and we discuss it in depth in Sect. 5.
In the following, Rcut = 19.7 R⊙ ≈ 20 R⊙ is our default model, that is, the cut is applied very close to the bottom of the convective envelope, which is located at 17.9 R⊙. The innermost 20 R⊙ of the stellar structure is replaced by a point particle of Mcore = 2.97 M⊙ and the inner gas cells in the cut-out core region are filled according to the solution of a modified Lane–Emden equation smoothly blending into the HSE in the envelope structure (Ohlmann et al. 2017). The point particle together with the gas cells in the inner region then comprise exactly (deviating only by 1%) the material of the cut-out core which in the MESA model has a total mass of 3.09 M⊙.
Of the 2.97 M⊙ mass of the core particle, 2.74 M⊙ can be attributed to the carbon-oxygen core and the surrounding helium shell in the original MESA model, while the remaining 0.23 M⊙ is material that is chemically part of the hydrogen-rich envelope. We thus include about 97% of the hydrogen-rich envelope on the hydrodynamic grid of the simulation.
2.2. Relaxation
The mapping from the 1D MESA model to the coarser hydrodynamic grid in AREPO introduces discretisation errors that perturb the HSE of the envelope and cause spurious velocities. These are damped out in a relaxation step following Ohlmann et al. (2017): Without adding a companion, the primary star is evolved over ten dynamical timescales (corresponding to about 895 d). During the first half of this time, velocities are reduced by a damping term in the momentum equation that weakens with time, while in the second half the velocities are no longer artificially suppressed to test the stability of the resulting structure.
Furthermore, we map the 1D MESA density structure onto the 3D AREPO grid. This also introduces a mass discretisation error such that the resulting AREPO model has an approximately 2% larger total mass of ≈9.6 M⊙ compared to the MESA target mass of 9.4 M⊙. When presenting and discussing our CE simulations, we therefore always refer to the relaxed AREPO model and not the original MESA star.
The domain of the AREPO simulation extends far beyond the radius of the primary star. The cubic simulation box has a length of 3158 R⊙ during the relaxation and 480 000 R⊙ in the CE simulation, which is large enough so that no material from the stars is able to reach the boundaries of the simulation box during our computations. The total number of hydrodynamic grid cells in our simulation fluctuates around 5 million because of the explicit refinement in AREPO. Our main refinement criterion is Lagrangian, that is, we aim to keep the mass of all cells within a factor of two around 1.6 × 10⁻⁶ M⊙. We also refine a cell if any of its direct neighbours has a volume that is at least a factor of five smaller than its current volume to avoid abrupt changes in resolution at steep density gradients. Moreover, we employ explicit refinement and derefinement to limit the smallest cells to a minimum volume of 4.2 × 1029 cm3 and the largest cells to a maximum volume of 3.7 × 1046 cm3 to prevent derefinement of the background mesh.
Our refinement setting ensures a high spatial resolution close to the core of the primary star and to the companion while the exterior of the simulated systems is less well resolved. The resolution is therefore highly non-uniform over the entire simulation domain. As the vacuum outside the star cannot be represented in our hydrodynamic simulations, the grid cells outside the stellar structure are filled with a ‘pseudo-vacuum’ consisting of material with a density of 10−15 g cm−3 and temperature of 4000 K.
The gravitational potential of the point particles representing the core of the primary and the companion is softened out to a radius of Rsoft = Rcut. To avoid unphysical interaction between the stellar cores when softened regions overlap, the gravitational softening length is adaptively reduced as they approach each other such that overlap of the softened regions is avoided.
Figure 2 illustrates the result of the setup procedure for our standard stellar model with Rcut = 20 R⊙, where we (linearly) resolve the softening length with Ncps = 40 grid cells, exploiting the adaptive mesh refinement capability of AREPO (‘cps’ stands for ‘cells per softening length’, i.e. the softened volume is discretised with about 403 cells). The total number of grid cells, Ncells, at the end of the relaxation is about 4.7 million. The relaxed model fulfills the stability criteria set out by Ohlmann et al. (2017). The Mach numbers Ma after the relaxation step stay at values around 0.1 inside the envelope (see Fig. 2b). This is consistent with the original stellar structure, where large parts of the resolved envelope are convective (cf. Fig. 1), although the corresponding Mach numbers derived from the employed mixing length theory are somewhat lower than in the AREPO model, similar to what Ohlmann et al. (2017) find. Only at the edge of the star do the Mach numbers of both the original and the mapped models approach a value of one. The lower panel of Fig. 2 shows that in the relevant parts of the envelope there is less than 1% deviation from HSE, defined as
where ρ, g, and P denote mass density, gravitational acceleration, and pressure, respectively. The deviations are larger only near the centre (r ≲ 3 R⊙) and in the pseudo-vacuum (r ≳ 400 R⊙), which is not set up in HSE anyway. This demonstrates that the stellar model is in an acceptable state of equilibrium before starting the actual binary interaction simulation. The relaxations of our stellar models with altered cut radii (but retaining Ncps = 40) give similar results in terms of stability of the important parts of the envelope.
As our mapped model cannot completely resolve the steep pressure gradient at the stellar surface, there is a slight expansion of material (see top panel in Fig. 2). For consistency with our previous work, we define the radius of the primary star as that containing 99.9% of the total mass on the AREPO grid, which includes some of the pseudo vacuum and yields a radius of 438 R⊙.
To test the convergence of the initial models with respect to numerical parameters, we perform two additional simulations. First, we relax our standard model with Rcut = 20 R⊙ to a grid with the total number of grid cells after the relaxation reduced to Ncells = 1.6 million. Second, the number of hydrodynamic grid cells resolving the gravitational softening length of the core particle is reduced to Ncps = 20. The results are shown in Fig. 3. A reduction of the number of cells per softening leads to a strong deviation of the density profile after the relaxation compared with the initial MESA structure. We conclude that a sufficiently high resolution of the pressure gradient close to the core particle is needed to preserve the HSE structure of the original model and perform all simulations described in the following with Ncps = 40. In contrast, the total number of grid cells seems to have little impact on the density structure the MESA model relaxes into – at least in the range tested here. Still, we opt for the higher resolution to improve the representation of the interaction between the envelope material and the companion and to better resolve (magneto-)hydrodynamic instabilities.
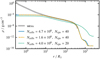 |
Fig. 3. Density profiles of the original stellar model (‘MESA’) and after relaxation on AREPO grids with the indicated total number of cells, Ncells, and the number of cells per softening length, Ncps. Our default model is represented in blue. |
2.3. Common-envelope phase
For the binary interaction simulations, we choose a companion of M2 = 5.0 M⊙ representing a BH and a companion of M2 = 1.4 M⊙ to represent a NS. Both are implemented in our model as point masses that interact only gravitationally, treated in the same way as the core of the primary star. The companion is placed at an orbital separation of 60% of that when the RSG primary star fills its Roche radius. The Roche radius is calculated approximately according to Eggleton (1983) and the radius of the primary star after the AREPO relaxation is used (438 R⊙). We assume corotation of the envelope of the giant star with the binary system and therefore introduce the corresponding rotational velocity (i.e. the envelope is initially in solid-body rotation). To account for the release of recombination in the expanding envelope gas, we employ the OPAL equation of state (Rogers et al. 1996; Rogers & Nayfonov 2002) as in Sand et al. (2020) and Kramer et al. (2020). We assume all released recombination energy to thermalise locally and no energy to be lost from dilute parts of the envelope by radiation.
We add a dipole magnetic field with polar field strength of 10−6 G to the primary star at the beginning of the CE run. The implementation of the magneto-hydrodynamic solver in AREPO is explained in Pakmor et al. (2011) and we apply the Powell scheme (Powell et al. 1999) for magnetic-field divergence control (see Pakmor & Springel 2013). The seed magnetic field is strongly amplified in our simulation (cf. Ohlmann et al. 2016b), and magnetically driven bipolar outflows are observed similar to those in the CE simulation with a low-mass primary star of Ondratschek et al. (2022). The magnetic-field energy saturates at around 1045 erg, and the ratio of magnetic to kinetic energy never exceeds 3% in our simulations. The magnetic fields are irrelevant for the orbital evolution during the dynamic plunge-in of the CE phase and the ejection of the bulk of the hydrogen-rich envelope, similar to what is found in lower mass CE simulations by Ohlmann et al. (2016b) and Ondratschek et al. (2022). In the future evolution of the remaining binary systems, the magnetically driven outflow may affect the binary orbit. However, there is only relatively little mass left inside the binary orbits at the very end of our simulations (≈10−3 M⊙), limiting the immediate angular-momentum loss from the binary systems. These effects will be discussed in a forthcoming publication.
At the end of our simulations, the deviations of total energy and total angular momentum compared to the initial states are ≲ 0.1% and ≲ 1%, respectively. A summary of the key initial conditions of both models at the beginning of the CE runs can be found in Table 1.
Initial conditions of the CE simulations with the NS-like and BH-like companions.
3. Results
3.1. Black-hole mass companion
The evolution of our 3D MHD simulation of CE interaction with a BH-mass companion (mass ratio q = M2/M1 = 0.53) is illustrated in the top row of Fig. 4, and a summary of the final configuration can be found in Table 2. After setting up the companion at a distance of 501 R⊙, which is well above the surface of the primary star, we follow the system for about six times the initial orbital period, a duration that corresponds to 187 orbits of the progressively tightening core binary system. Although the stellar envelope and the companion are in corotation initially, tidal interaction quickly leads to deformation of the envelope structure, accumulation of material in the vicinity of the companion, and a drag force causing the companion to plunge into the envelope. The core of the primary RSG star and the BH companion orbit each other. Their supersonic motion inside the envelope leads to the formation of a spiral shock structure, which is most easily visible in the snapshot taken at t = 255 d in Fig. 4. By this time, the companion has completed about one and a half orbits and the separation between the cores has decreased to less than 50% of its initial value. Within the spiral arms, shear flows give rise to instabilities that leave their imprints on the density structure (see snapshot at t = 612 d in Fig. 4), similar to what is observed in low-mass systems (Ohlmann et al. 2016a). After 2721 d, the overall density has decreased significantly due to envelope expansion (top right panel in Fig. 4). The spiral structure is still visible, although perturbed by shear instability. The evolution of the density in the orbital plane is shown in the video in Fig. A.1.
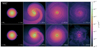 |
Fig. 4. Simulation of CE interaction of a 10 M⊙ red giant primary star with a BH-mass companion (top row) and with a NS-mass companion (bottom row). Shown is the density in slices through the orbital plane at the times indicated in the panels. The core of the primary star is marked by a plus symbol and the cross symbol marks the position of the companion. The scale bar applies to all snapshots. |
Final configuration of the CE simulations with the NS-like and BH-like companions.
We now turn to the question of envelope ejection. We determine the mass of unbound envelope material according to three different energy criteria: gas inside a hydrodynamic grid cell is considered unbound if its net energy is positive. In our first, most conservative criterion, we only count gravitational potential energy and kinetic energy as the net energy of the cell. We refer to this as the kinetic energy criterion hereafter. A weaker, ‘thermal energy criterion’ adds the thermal energy of the gas to the net budget. The third, most optimistic estimate for envelope unbinding is the ‘internal energy criterion’, which adds the entire internal energy of the gas including its ionisation and radiation energy. The ionisation energy may be released in recombination processes if envelope expansion moves material below the ionisation threshold. We assume local thermalisation of recombination energy and therefore it supports envelope ejection in our model. Our optimistic internal energy criterion may overestimate this effect, because it is not guaranteed that recombination occurs in all parts of the envelope. The possibility that some of the released recombination energy is radiated (Grichener et al. 2018, but see Ivanova 2018) away instead is also not accounted for in our simplified model.
The evolution of the fraction of ejected envelope mass compared to the initial envelope mass that is contained in our hydrodynamic grid (i.e. 97% of the original hydrogen-rich envelope of the MESA progenitor; see Sect. 2.1),
is plotted in Fig. 5. After an initial co-evolution of the fractions measured according to the three criteria in the first orbit, fej, int starts to rise quickly. The unbound mass fractions determined with the ‘kinetic’ and ‘thermal’ criteria stagnate around 20% from 500 d onward. After only about 1200 d, the envelope has expanded sufficiently for parts of its material to fall below the ionisation thresholds of hydrogen and helium. Recombination energy is released and converted into thermal and ultimately kinetic energy of the envelope gas. Therefore, fej, therm and fej, kin start to rise, but lag behind the evolution of fej, int. By the time we terminate the simulation (3197 d), we find fej, int = 0.98, while fej, therm = 0.57 and fej, kin = 0.48 are still rising steadily. Given this trend, almost complete envelope ejection appears possible.
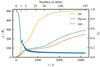 |
Fig. 5. Orbital evolution (solid line, left axis) and mass ejection according to the three energy criteria defined in Sect. 3.1 (dashed lines, right axis) in the simulation with a BH-mass companion. |
We also show the orbital evolution of the system in Fig. 5. The separation of the BH-mass companion and the core of the primary star shrinks by more than 400 R⊙ during the first few orbits in about 500 d, after which the orbital decay slows down significantly. The oscillations apparent in the evolution of the orbital distance are caused by an eccentricity that develops from the originally circular orbit. The eccentricity at the end of the simulation is ≈ 0.06. There is only a small decrease in the orbital separation over the many orbits between 1000 d and 3197 d when we stop the simulation. By this time, the distance between the core of the primary and the companion has reduced to 47 R⊙, and it keeps decreasing at a rate of about 1.0 R⊙ yr−1. If this rate were to stay constant, the orbit would decay within 47 yr, that is, over the next ≈ 1300 orbits. This is well beyond what can be followed with a code such as AREPO, and signals the transition from the fast to the slow inspiral process.
The decay rate itself also decreases (Fig. 5). We therefore expect the orbital separation to settle to a final value once the rest of the envelope material is expelled completely and the drag forces cease, as is the case in the CE simulations of lower mass stars of Ondratschek et al. (2022). However, in our simulations with a massive primary star, the CFL-restricted time-steps become prohibitively small, preventing us from following the evolution over many more orbits.
3.2. Neutron-star mass companion
The simulation with a NS-mass companion (q = 0.15) and our reference RSG primary model with Rcut = 20 R⊙ was started with an initial orbital separation of 479 R⊙, again placing the companion above the stellar surface. The evolution was followed for a duration of about four initial orbital periods. As visible in the lower panel of Fig. 4, the hydrodynamic evolution resembles the case of the BH-mass companion, but there are important differences: The NS-mass companion spirals in faster and deeper than the more massive BH-mass companion discussed in Sect. 3.1, because its weaker gravitational force causes less perturbation to the envelope material. It therefore takes longer to expand the envelope and to reduce the drag force such that the rapid orbital decay comes to an end. When the simulation is terminated at 1620 d, the system has completed 309 orbits of the tightening core binary system, while the 187 orbits we follow for the BH-mass companion case take 3197 d.
The deeper inspiral causes a more rapid destruction of spiral shock structure in the envelope by large-scale instabilities (compare video Fig. A.2 with that for the BH-mass companion, Fig. A.1). As a result of the faster and less ordered morphological evolution, the structure in the last snapshot of the time series in Fig. 4 is more dilute in the case of a NS-mass companion (bottom row) than in the BH-mass companion simulation (top row). It is also more irregular, and lacks the traces of the previous spiral shocks imprinted on the envelope material which are still visible in the BH-mass companion case.
The evolution of the unbound mass fraction and the orbital decay shown in Fig. 6 support this interpretation. Compared to the simulation with the BH-mass companion (Fig. 5), the inspiral of the NS-mass object in the first few orbits is deeper and less affected by eccentricity, which generally seems much less pronounced in the case of the NS-mass companion. After this initial plunge-in, the core binary system evolves into a tighter and less eccentric orbit, similar to what is observed for lower mass systems (e.g. Sand et al. 2020 find a linear relation between the mass ratio in the binary system and the ratio of initial to final orbital separation). At the end of the simulation, the orbital separation is 15 R⊙, and is still decreasing at a rate of about 0.3 R⊙ yr−1. The eccentricity at the end is ≈ 0.01. As in the BH case (Sect. 3.2), the decay rate itself is slowing down, and we are witnessing the transition from the fast to the slow inspiral process. The entire orbital decay would take ≈50 yr given a constant orbital decay rate, that is, ≈ 5700 orbits. However, as shown in Sect. 5.2.2 below, the decay is not constant but slowly levels off. Thus, we expect the system to reach a true final orbital separation, but we cannot follow the evolution for much longer given our CFL-limited time-steps.
After about 500 d, the rate of recombination energy release is higher in the case of a NS-mass companion than with a BH-mass one. According to the ‘internal energy criterion’, envelope ejection is nearly complete already by 1000 d. For the BH-mass companion, ejection takes more than twice this time. The faster evolution can be attributed to the deeper inspiral of the NS-mass companion, which releases about 20% more orbital energy, leading to a more rapid expansion of the envelope. Shifting larger parts of it quicker below the ionisation threshold, the released recombination energy and its conversion into thermal and kinetic energy proceeds faster. By the end of our simulation, fej, therm = 0.68 and fej, kin = 0.54 and both are rising steadily. Again, almost complete envelope ejection from the system seems possible (fej, int > 0.99).
3.3. Effective CE ejection efficiencies
In population-synthesis and other models, the CE phase is often described by an energy formalism where orbital energy released in the inspiral of the companion is used to unbind the envelope. Here, the envelope-ejection efficiency, αCE, is defined as the ratio of envelope binding energy (Ebind < 0; Eq. (1)) and the released orbital energy in the CE phase (Eq. (2)),

The final orbital separation is therefore
![$$ \begin{aligned} a_\mathrm{f}&= a_i \frac{M_\mathrm{core} }{M_1} \left[ 1 - \frac{1}{\alpha _\mathrm{CE} } \frac{2 E_\mathrm{bind} a_i}{G M_1 M_2} \right]^{-1}, \nonumber \\&= a_i \frac{M_\mathrm{core} }{M_1} \left[ 1 + \frac{2}{\alpha _\mathrm{CE} \lambda } \frac{M_\mathrm{env} }{M_2} \frac{a_i}{R_1} \right]^{-1}, \end{aligned} $$](/articles/aa/full_html/2022/11/aa42731-21/aa42731-21-eq6.gif)
where we have introduced the often-used, re-defined envelope binding energy in terms of the so-called λ parameter (cf. Eq. (1)),
In the latter equation, Menv = M1 − Mcore is the envelope mass and R1 is the radius of the supergiant at the onset of the CE phase. Both Ebind and λ depend sensitively on how exactly the envelope binding energy is computed, that is, whether or not one accounts for thermal and ionisation energy (i.e. αth), and the core–envelope boundary that sets Mcore (i.e. also Menv and the lower integration boundary in Eq. (7)). In this regard, Ebind and λ are functions of αth and Mcore.
The core–envelope boundary setting Mcore is usually interpreted as the radius down to which the remaining stellar core no longer reacts on a dynamical timescale with re-expansion to the removal of all envelope material at larger radii such that the CE phase comes to an end. In Sect. 2.1, we show that two often-used definitions of this limiting point, the maximum compression point and the point where X = 0.1, are almost identical in our case.
We now compute the expected final orbital separations, applying the energy formalism in Eq. (6) to the MESA RSG model as would be done in population synthesis models, for example. Using the maximum-compression point to separate core and envelope, and assuming αth = 1, we compute the envelope binding energy of the MESA RSG model (cf. Fig. 1b). From Eq. (6) and setting αCE = 1, we then find final orbital separations of af ≈ 5.9 R⊙ and af ≈ 19.2 R⊙ for the NS-mass and BH-mass companion, respectively. These values are upper limits, because we assume a maximum envelope-ejection efficiency of αCE = 1 and that the entire internal energy of the envelope gas can be used to unbind the CE (αth = 1).
These final orbital separations are in contrast to af ≈ 15 R⊙ and af ≈ 47 R⊙ found in our CE simulations in case of the NS-mass and BH-mass companion, respectively. The reason for this discrepancy is the a priori unknown core–envelope boundary at which the dynamical spiral-in stops and that has been estimated at a much deeper location in the RSG model by the maximum-compression point than what we find in our AREPO simulation: the drag force on the RSG core and the inspiralling companion is greatly reduced at much larger separations than predicted by the maximum-compression point. As shown in Sects. 3.1 and 3.2, the orbits still shrink at the end of our simulations, and it remains uncertain as to whether improved numerics, different physical setups, and/or yet missing physics would result in smaller final orbital separations in the AREPO models (see Sect. 5.2 for a more detailed discussion on the final orbital separation). In this regard, our final orbital separations should be interpreted as upper limits.
In order to still obtain a meaningful envelope ejection efficiency for use, for example, in population synthesis models, we have to properly adjust the core–envelope boundary in the energy formalism to the outcome of our CE simulation. We can then compute the CE ejection efficiency directly from our AREPO simulation. Using the relaxed AREPO model of the RSG progenitor, we compute spherical shell averages of internal energy and then integrate the envelope binding energies following Eqs. (1) and (7), cf. thick lines in Fig. 1b. From the AREPO progenitor with R1 = 438 R⊙, M1 = 9.61 M⊙, and Mcore = 2.97 M⊙ at the onset of the CE phase, we find λ = 0.510, 0.805 and 1.911 for αth = 0.0, 0.5, and 1.0, respectively (Table 3).
Determined CE ejection efficiencies.
Rearranging Eq. (6) for αCEλ, we find (see e.g. Webbink 1984; Dewi & Tauris 2000)
![$$ \begin{aligned} \alpha _\mathrm{CE} \lambda = \frac{G M_1 M_\mathrm{env} }{R_1} \left[ \frac{G M_\mathrm{core} M_2}{2 a_\mathrm{f} } - \frac{G M_1 M_2}{2 a_\mathrm{i} } \right]^{-1}\cdot \end{aligned} $$](/articles/aa/full_html/2022/11/aa42731-21/aa42731-21-eq8.gif)
Assuming full envelope ejection (see Sect. 5.1), we get the effective αCEλ values from the initial and final orbital separations in our simulations. In the case of the 1.4 M⊙ NS companion, we find (αCEλ)NS = 1.17 and, from the simulation with the 5.0 M⊙ BH companion, we find (αCEλ)BH = 1.32. This translates to CE ejection efficiencies of αCE = 0.61 − 2.29 in the NS case and αCE = 0.69 − 2.60 in the BH case, depending on the choice of αth and hence λ (Table 3).
Formally, ejection efficiencies of αCE > 1 indicate that there are energy sources yet unaccounted for in the energy balance. With the inclusion of the internal energy of the gas (i.e. thermal and ionisation energy), we obtain αCE < 1 for a definition of the core-envelope boundary representative of our CE simulation (Table 3).
4. Evolution and final fate of the post-CE binaries
Both the 1.4 M⊙ and 5.0 M⊙ companions can possibly eject most of the formerly convective, hydrogen-rich envelope of the RSG primary star. The orbital separations after the dynamical ejection of the CE are still decreasing. Although we cannot predict the true final orbit accurately in this work (Sect. 3), the measured orbital separations are upper limits. To account for the ongoing orbital decay observed at the end of our simulations, we also consider scenarios with reduced separations below. The 2.97 M⊙ remnant of the RSG star has a remaining lifetime until core collapse of about 6 × 10⁴ yr, which opens several possible evolutionary paths for the post-CE binary. In the following, we assume that the two companion stars are indeed genuine compact objects, that is, a 1.4 M⊙ NS and a 5 M⊙ BH, and that the entire envelope material of the AREPO models has been ejected.
Given the mass of the 2.74 M⊙ helium core of the RSG remnant star and the 0.23 M⊙ remaining hydrogen-rich layer, the star is expected to re-expand again to radii of several tens of R⊙ (e.g. Tauris et al. 2017; Woosley 2019; Laplace et al. 2020; Vigna-Gómez et al. 2022). This may even happen regardless of the 0.23 M⊙ hydrogen-rich layer on top of the helium core (Sect. 2.1). Taking our final orbital separations (periods) of 15 R⊙ (≈3.2 d) and 47 R⊙ (≈13.2 d) in case of the NS and BH companion, respectively, another mass-transfer phase from the RSG remnant onto the compact object appears inevitable.
If no mass-transfer phase sets in, the binary system contains a hot helium star orbiting a compact object. The spectrum of such a hot helium star will be between an O-type star and a subdwarf, depending on the exact amount of hydrogen on the stellar surface (Götberg et al. 2018). Finding such envelope-stripped, hot helium stars in orbit around other stars is of great interest as they emit ionising radiation that is thought to be important, for example, for the reionisation of the Universe (Rosdahl et al. 2018; Götberg et al. 2019, 2020).
However, it is more likely that the RSG remnant will initiate a mass-transfer phase upon re-expansion. From a binary-evolutionary point of view (e.g. Dewi et al. 2002; Dewi & Pols 2003; Ivanova et al. 2003; Tauris et al. 2013, 2015; Jiang et al. 2021), mass transfer is most likely stable (e.g. see fig. 3 in Ivanova et al. 2003 for a ≈3 M⊙ donor and an orbital period of ≈3.2 d). The aforementioned studies are for pure helium star donors while our RSG remnant may have a hydrogen-rich surface layer. Still, given the rather tight post-CE binary orbits, the RSG remnant cannot expand to such large radii that it can develop a deep convective envelope, and therefore the ensuring mass-transfer phase is most likely stable and does not immediately lead to another CE phase.
Mass transfer will occur in two phases: first, the remaining hydrogen-rich layers will be transferred on their thermal timescale. Secondly, a thermal-timescale mass-transfer episode of helium-rich material sets in. The timescale of the first mass-transfer phase will be faster. In principle, mass transfer during this first phase can be so fast that mass accumulates near the accreting compact object such that it also fills the accretor’s Roche volume and a contact phase could eventually be established. Given the ≈3 M⊙ mass of the RSG remnant, such mass-transferring binaries may be observable as intermediate-mass X-ray binaries (IMXB). If the mass transfer can bring the donor mass below ≈2 M⊙ within the remaining lifetime of the donor star, the system will be classified as a low-mass X-ray binary (LMXB). However, the duration of mass transfer is of the order of 104 yr, which makes it difficult to observe such systems.
The accretion onto the NS and BH is likely Eddington-limited,
where R is the radius of the compact object, c is the speed of light, κ is the opacity that we approximate by the electron-scattering opacity, κes = 0.2(1 + X) cm2 g−1, and we apply a hydrogen mass fraction of X = 0.7 by default. Super-Eddington accretion may also be possible, rendering mass transfer more conservative (see below). For a NS with radius 10 km and a non-rotating BH (Schwarzschild radius of ≈14.8 km), we find mass-accretion rates of 1.8 × 10⁻⁸ M⊙ yr−1 and 2.6 × 10⁻⁸ M⊙ yr−1, respectively. The rates increase by 70% for X = 0.0. Given the remaining lifetime of the RSG remnant, the compact object can at most accrete some 1 − 3 × 10⁻³ M⊙, which is a small amount of mass but enough to potentially moderately spin it up.
With Eddington-limited accretion, the mass transfer is highly non-conservative (typical mass-transfer rates for evolved helium stars are three to four orders of magnitude larger than the Eddington limit; e.g. Tauris et al. 2015). Assuming that a fraction β of the mass-transfer rate Ṁ1 from the RSG remnant onto the compact object is re-emitted with the specific orbital angular momentum of the compact object, we can follow the orbital evolution of the post-CE binary. In this case, the accretion rate of the compact object is Ṁ2 = −(1−β) Ṁ1 (Ṁ1 < 0). For 0 ≤ β < 1, we follow Tauris (1996) and, for β = 1, we use (see also Podsiadlowski et al. 2002; Postnov & Yungelson 2014)
where the index i denotes values at the onset of the mass-transfer phase, a is the orbital separation, M1 is the mass of the RSG remnant, and M2 is the mass of the compact object (including the accreted mass). This solution agrees with that of Tauris (1996) for β → 1. Given these assumptions, β = 0 corresponds to conservative and β = 1 to non-conservative mass transfer.
The evolution of the orbital separation with respect to its initial value is shown as a function of donor mass M1 in Fig. 7 for β = 1.0, 0.5 and 0.0. In case of the NS companion of 1.4 M⊙, the orbit shrinks by at most 30% while the orbit always widens in the 5.0 M⊙ BH case. The orbit widens by at most a factor of 3 for donor masses larger than 1.4 M⊙. Therefore, the already relatively large orbital separation of the post-CE system with a 5 M⊙ BH only gets larger by mass transfer, making a NS–BH merger induced by gravitational-wave emission even less likely to occur within a Hubble time. The orbital shrinkage by 30% in the case of the 1.4 M⊙ NS companion may reduce the orbital separation from 15 R⊙ to ≈10 R⊙. A NS–NS merger induced by gravitational-wave radiation may therefore be possible depending on the exact further orbital shrinkage just after the dynamic CE phase (see Sect. 3.2) and the supernova explosion of the RSG remnant (see below).
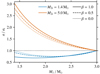 |
Fig. 7. Hypothetical orbital evolution of the remnant binary system. The ratio of present-day to initial orbital separation, a/ai, is plotted as a function of the mass of the remnant primary star, M1. Evolution is from right to left, that is, from high masses M1 to low masses. The initial companion masses are M2i = 1.4 M⊙ and 5.0 M⊙, and three different mass ejection fractions β are applied for each mass. |
Assuming a mass-transfer rate of 10−4 M⊙ yr−1 (e.g. Tauris et al. 2015) and a duration of mass transfer of 104 yr gives a total ≈1 M⊙ loss from the RSG remnant. A significant fraction of the helium layer may therefore be lost (Fig. 1a) and the star could explode as a so-called ultra-stripped star with a remaining envelope mass of less than ≈0.2 M⊙ (Tauris et al. 2013, 2015). A type Ib, iron core-collapse SN therefore seems most plausible with the possibility of an ultra-stripped SN of low ejecta mass. Detailed binary evolution models are required to settle this scenario.
The mass loss in a SN explosion leads to a widening of the orbit and a higher eccentricity, and the newly born NS will receive a kick that further perturbs the orbit. Without a NS kick and assuming that a mass ΔM is instantaneously lost from a binary star of masses M1 and M2, the eccentricity of the orbit is e = ΔM/(M1 + M2 − ΔM) and the final orbital separation is
if the binary orbit was initially circular. For example, for M1 = 3.0 M⊙, M2 = 1.4 M⊙, and ΔM = 1.6 M⊙, that is, assuming that no mass transfer takes place after the CE event and that there is no NS kick when the 3.0 M⊙ star explodes and forms a 1.4 M⊙ NS, the orbit widens by a factor of 2.3 and has an eccentricity of about 0.57. In case of the BH companion of M2 = 5.0 M⊙, an orbital widening from the SN explosion by a factor of 1.3 and an eccentricity of about 0.25 is expected. Following Peters (1964), the GW merger times for the post-SN binary systems of M1 = M2 = 1.4 M⊙, a = 2.3 ⋅ 15 R⊙ ≈ 34.5 R⊙, and e = 0.57 is ≈5500 Gyr, and for M1 = 1.4 M⊙, M2 = 5.0 M⊙, a = 1.3 ⋅ 47 R⊙ ≈ 61.1 R⊙, and e = 0.25 it is ≈38 000 Gyr. Therefore, under the assumptions of no mass transfer and no NS kick, the post-CE binaries will neither lead to a NS–NS nor a NS–BH merger event within a Hubble time of 13.787 Gyr (Planck Collaboration VI 2020). Compact-object mergers would be possible if the orbital separations at the end of the CE phase were smaller than ≈3.4 R⊙ and ≈6.7 R⊙ in the NS and BH case, respectively.
Neutron-star kicks may disrupt binaries, but they can also result in tighter orbital separations and larger eccentricities; for example if the kick points in the opposite direction of the motion of the exploding star. In order to quantify the extent to which NS kicks help in facilitating a later compact-object merger in our post-CE binaries, we computed the post-SN orbital separation and eccentricity following the formalism of Brandt & Podsiadlowski (1995), specifically using their Eqs. (2.4) and (2.8). A NS of 1.4 M⊙ is assumed to form from the SN of the RSG remnant core and we use isotropic NS kicks with kick velocities following a Maxwellian distribution with σkick = 265 km s−1 (Hobbs et al. 2005). From the post-SN orbital separation and eccentricity of the non-disrupted binary systems, we then computed the time it takes the compact objects to merge via gravitational-wave emission, again following Peters (1964). In Fig. 8, we show the fraction of binary systems that merge within a Hubble time, fmerge, and the fractions of binary systems that remain bound, fbound, and that are disrupted by the SN explosion, fdisrupt.
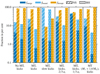 |
Fig. 8. Fraction of systems that merge within a Hubble time, fmerge, that remain bound after SN, fbound, and that are disrupted by the SN kick, fdisrupt, in six post-CE evolutionary scenarios of binaries with the 1.4 M⊙ and 5.0 M⊙ companions. The six scenarios are as follows: (i) no mass transfer after the CE and SN kicks; (ii) our default scenario of non-conservative (β = 1.0) mass transfer with final mass M1 = 2.0 M⊙ and SN kicks; (iii) same as the default scenario (ii) but with slower NS kicks from a Maxwellian with σkick = 50 km s−1; (iv) same as the default scenario but assuming an orbital separation after the CE that is smaller by one-third; (v) same as (iv) but with an orbital separation that is smaller by two-thirds; (vi) same as the default scenario but assuming a final mass of M1 = 1.6 M⊙. |
We consider six scenarios for the evolution after the CE phase to explore the likelihood of compact-object mergers from the two binary systems studied in this work. The scenarios, which are listed below, were chosen such that the biggest uncertainties in predicting the most likely final fate of the binary systems are considered.
(i) No mass transfer takes place and the forming NS receives a kick as described above. Without NS kicks, the binary systems with the NS and BH companion do not lead to compact-object mergers within a Hubble time. With NS kicks, the binaries disrupt in ≳ 85% of cases, but also lead to a NS–NS and NS–BH merger in about 4.2% and 1.9% of cases, respectively. The merger rates are higher with a NS companion because of the shorter orbital separation.
(ii) In our default scenario, we assume non-conservative mass transfer with β = 1.0 until the donor star reaches a mass of M1 = 2.0 M⊙ and NS kicks as before. Because of the mass transfer, the orbit shrinks in the case of the NS companion and widens for the BH companion. This results in a larger fraction of bound, post-SN binaries of about 23.1% in the NS case and a smaller fraction of 6.5% in the BH case when compared to scenario (i) without the previous mass-transfer phase. Correspondingly, the NS–NS merger fraction increases to 8.7% and that of NS–BH mergers decreases to 0.6%.
(iii) The mass transfer episode may lead to an ultra-stripped star with a small iron core such that the forming NS may receive a slower kick (e.g. Suwa et al. 2015; Janka 2017). For illustrative purposes, we assume a Maxwellian kick-velocity distribution with σkick = 50 km s−1 (cf. Pfahl et al. 2002; Podsiadlowski et al. 2004). Less than 10% and 15% of binaries with the NS and BH companion, respectively, are disrupted. However, the larger fraction of bound binaries does not automatically imply higher merger rates. In the NS case, the merger fraction even drops compared to our default scenario (ii), because the NS kick is no longer strong enough to cause the same fraction of mergers. In the BH case, the merger rate increases because the orbital separation at the SN stage is wider and the orbital velocity is therefore smaller, such that the NS kick now provides more favourable conditions for a merger to take place within a Hubble time (NS kicks perturb orbits most if they exceed the orbital velocity). This slow-kick scenario becomes more relevant the less massive the RSG remnant is at its SN stage.
(iv) The orbital separation at the end of our CE simulations is still decreasing and here we assume that it decreases by one-third. Mass transfer and SN kicks are then treated as in our default scenario (ii). Because of the tighter binary orbit, the bound and merger fractions increase. The merger rate is now 16.2% and 1.5% in the NS and BH cases, respectively.
(v) Decreasing the orbit after the CE phase by two-thirds further increases the chances for NS–NS and NS–BH mergers to 41.2% and 5.5%, respectively.
(vi) We assume that the SN takes place when the donor star has reached a mass of M1 = 1.6 M⊙. The SN ejecta mass is now decreased to 0.2 M⊙ compared to 0.6 M⊙ in the other models, which results in a slight increase in the NS–NS merger rate (9.1%) and a slight decrease in the NS–BH merger rates (0.3%) compared to our default scenario (ii). The latter decrease is because of the wider orbit at the end of mass transfer with M1 = 1.6 M⊙ compared to the default scenario with M1 = 2.0 M⊙ (see Fig. 7).
In summary, without a NS kick, we do not expect NS–NS or NS–BH mergers within a Hubble time from the binary systems studied here unless there is significant shrinkage of the orbits directly after the dynamical CE phase. Despite disrupting most binaries, SN kicks are required to shrink the orbits or lead to large eccentricities such that compact-object mergers become possible. In our default scenario, the post-CE binaries have a chance of 8.7% and 0.6% in resulting in a NS–NS and NS–BH merger within a Hubble time, respectively. The greatest enhancement in merger rates is found for shorter orbital separations directly after the dynamical CE phase. Weaker NS kicks actually do not change the merger fractions drastically but rather only the fraction of bound, double compact-object binaries. In very rare cases, < 0.002% and < 0.02%, the NS is kicked into a bound orbit such that it merges immediately with the other NS and BH, respectively, on periastron passage. In such rare cases, a gravitational-wave merger event and short-duration gamma-ray burst may possibly immediately follow the SN explosion.
5. Discussion
5.1. Envelope ejection
In Sect. 3.3, we estimate the CE ejection efficiency from an energy formalism. Material in grid cells is considered unbound if the sum of its gravitational potential, kinetic energy, and – in the thermal and internal energy criteria – thermal or internal energies is positive. For a number of reasons, this is only an approximation.
As discussed in Sect. 2.1, not all material down to the X = 0.1 (or maximum compression) point is contained in our grid. We cut the envelope structure at a larger radius and absorb some of the gas into the point particle representing the core. There is still some gas in the inner hydrodynamic cells, but it does not properly represent envelope material because it is distributed over the entire core and the gravitational potential is altered according to the applied softening. The envelope material between Rcut and the X = 0.1 point has a non-negligible binding energy (Fig. 1b) and would not be removed by the orbital energy released in our simulations.
However, resolved material that is unbound according to our kinetic energy criterion is also not guaranteed to be ejected if it is embedded in bound layers. Therefore, a better criterion would be based on dynamical considerations, for example comparing the radial velocity of the mass element to its escape velocity from the gravitational potential or an analysis of the final velocity profile to check whether or not the envelope is in homologous expansion. Such an analysis should be carried out once the simulations have been evolved to a stage where the unbound mass fractions according to the kinetic energy criterion saturate. Nevertheless, this is not the case in the simulations presented here and we therefore discuss possible envelope ejection results.
By the time we terminate our simulations, envelope ejection is almost complete for both the NS-mass and BH-mass companion cases according to the internal energy criterion. The unbound mass fraction according to the kinetic and thermal energy criteria are still increasing (see Figs. 5 and 6). This indicates that complete mass ejections according to the most stringent kinetic energy criterion may eventually be possible, but this is not guaranteed. It is possible that some part of the released recombination energy and perhaps also some of the thermal energy is radiated away instead of aiding envelope ejection (Grichener et al. 2018, but also see Ivanova 2018 and for further discussion Reichardt et al. 2020 and Sand et al. 2020). However, such effects are not accounted for in our model. Radiation transport is not included and local thermalisation of recombination energy is assumed. Future simulations should implement an appropriate treatment of radiation transport processes in the envelope.
The possibility remains that some material remains fully ionised and never releases its ionisation energy (e.g. material close to the remnant binary). In the internal-energy criterion, it is implicitly assumed that this ionisation energy is also available for envelope ejection, but this is not true. In the NS and BH cases, there is about 0.8 × 10⁻³ M⊙ and 3.0 × 10⁻³ M⊙ of material left close to the binary (Table 2), respectively, which leads to a negligible overestimation of the unbound envelope mass. The situation is the same in the simulation of CE interaction in a system with a low-mass primary star that is carried out to complete envelope ejection according to the kinetic energy criterion (Ondratschek et al. 2022): There remains almost no material close to the binary, meaning that the internal-energy criterion only marginally overestimates the respective envelope ejection efficiency. This is of course at best a plausibility argument and emphasises the need to follow our models for longer periods of time.
Even if radiation losses or unfavourable deposition of recombination energy prevent complete envelope ejection in our model, other, currently neglected effects may still enable it. Treating the companions as point particles is a crude approximation. In their passages through the envelope, accretion onto the companions may be possible. Accretion luminosity and perhaps nuclear burning and the formation of jets may help to expel additional envelope material (e.g. Shiber et al. 2019). However, the results of MacLeod & Ramirez-Ruiz (2015) indicate that the angular momentum barrier due to the density stratification may prevent efficient mass accretion and the formation of an accretion disk around compact companions (but see also Murguia-Berthier et al. 2017 and Chamandy et al. 2018 for cases where accretion is likely possible). Alternatively, instabilities in the (partly ejected) envelope may be triggered that can further help eject material (e.g. Clayton et al. 2017). Envelope gas that is not ejected will fall back onto the remnant binary system, and some parts can be accreted while others may remain in a circumbinary disk. Indeed, such circumbinary disks are observationally found in, for example, post-AGB systems that may have evolved from CE phases (e.g. de Ruyter et al. 2006; van Winckel et al. 2009; Dermine et al. 2013).
5.2. Orbital evolution
5.2.1. Physical considerations
We observe an orbital evolution similar to those found in other CE simulations with lower mass primary stars (e.g. Passy et al. 2012; Ricker & Taam 2012; Ohlmann et al. 2016a; Iaconi et al. 2017; Prust & Chang 2019; Sand et al. 2020; Reichardt et al. 2020; Ondratschek et al. 2022). After a dynamical plunge-in that rapidly reduces the separation of the cores over the first few orbits, the orbital decay slows down rather abruptly (see Figs. 5 and 6). In our simulations, this turn-over in the orbital decay occurs at separations far above the thresholds that would immediately render the considered systems progenitors of mergers observable in gravitational wave detectors.
Law-Smith et al. (2020) take a different approach to finding the final orbital separation of a CE phase of a massive 12 M⊙ RSG primary and a NS-mass companion. These authors argue that the envelope of the RSG primary is easily ejected, and therefore strip the RSG primary down to 10 R⊙ before starting the CE simulation by placing a NS companion at a distance of 8 R⊙ from the centre of the primary. Our simulation with a NS companion follows the evolution left out by this shortcut and indicates that the setup of Law-Smith et al. (2020) may not be realistic: The inspiral of the NS companion in our simulation perturbs the loosely bound outer parts of the envelope so strongly that the drag forces are unable to reduce the orbital separation to values chosen by Law-Smith et al. (2020) as initial conditions.
However, as discussed in Sect. 5.1, our models do not capture the innermost envelope material down to the X = 0.1 point and we cannot determine whether it would be ejected. Depending on how much of this mass would need to be ejected, the final orbit would shrink further. A solid definition of the core of our massive primary star and a hydrodynamic model that resolves the gas down to this core radius are required to settle this question.
The rather shallow inspiral after the plunge-in and early CE phase in our simulations indicates that our considered setups do not immediately produce the progenitors of NS–NS and NS–BH that merge in less than a Hubble time. The observation of merging neutron stars in gravitational-wave detectors (Abbott et al. 2017) raises the question of how reliably our models predict the evolution of the orbital separation in the core binary system. Interestingly, a similar problem is encountered in lower mass systems, where the orbital separations obtained from simulations are commonly larger than those of observed post-CE binary systems (Iaconi et al. 2017). Although some observational bias may play a role in this case, the phenomenon could also indicate a systematic discrepancy caused by either numerical problems, our inability to evolve CE simulations for sufficient durations, or the absence of important physical effects in the models. It is also conceivable that the inspiral results in tighter orbits in less evolved primary stars with a higher envelope binding energy.
The view of the classical and simplified model of CE evolution is that the inspiral stalls once a sufficient amount of orbital energy has been released to expel the envelope material so that the drag on the cores ceases. However, a simple inspiral at constant orbital-decay rate to a separation where the difference in orbital energy is equal to the binding energy of the envelope is not observed in self-consistent hydrodynamic simulations. The inspiralling companion rather leads to a complex 3D perturbation of the envelope structure. The release of recombination energy and its conversion into kinetic energy, which arguably (see Sect. 5.1) is a measure of how much envelope material has actually been removed from the system, occurs only after the orbital decay has settled into the slow evolution phase where the core separation changes only slightly. Thus, ejection of the outer envelope has little effect on the orbital evolution of the central core binary system. This picture is supported by simulations comparing CE evolution with and without taking the release of recombination energy into account. While this process is fundamental for envelope ejection, it has only a minor effect on the orbital evolution and the final core separation (e.g. Sand et al. 2020).
There are several effects that determine the evolution of the orbital separation instead. The drag force acting on the cores (recently measured in 3D hydrodynamic CE simulations by Chamandy et al. 2019 and Reichardt et al. 2019) depends strongly on the Mach number characterising their motion through the envelope gas (e.g. Ostriker 1999). The drag force reaches a maximum at a Mach number of just above unity and drops sharply in the subsonic regime, which is approached when the companion spirals into the central parts of the primary star where the sound speed is higher. Moreover, although the envelope is not unbound at an early stage, it is lifted by the energy injection, lowering the gas density near the cores. Additionally, the drag force is reduced when the envelope gas spins up and approaches corotation by the action of the inspiralling companion. At the same time, changing the orbital separation noticeably requires a drag force on the order of the gravitational force acting on the cores and determining their orbit. With tightening orbit, the gravitational force between the cores increases, reducing the effect of the decreasing drag force even more. These physical effects seem plausible and all described effects are in principle accounted for in the physical modelling basis of our simulations. We therefore argue that the large orbital separations we observed after the inspiral phase are the correct outcome under the assumptions and approximations made in our model.
5.2.2. Numerical considerations
A remaining concern is that the numerical implementation of our model may determine the late orbital evolution rather than the physics. This concern originates from our approach, whereby we represent the core of the primary RSG star and the companion as point masses that interact with each other and the gas only via gravitation. For defining the core particles, the original stellar profile was cut at a radius Rcut and the gravitational potential of both point particles is softened within the same radius. This clearly limits the accuracy of representation of the stellar profile and the gravitational potential close to the cores. The impact of the choice of the gravitational softening length on the results of CE simulations for low-mass systems was addressed by Reichardt et al. (2020). While in our simulations the orbital separation of the system with the BH-mass companion remains well above Rcut, the turnover in the orbital decay occurs suspiciously close to it in the case of the NS-mass companion and the final orbital separation of about 15 R⊙ is even below this radius. This is a reason for concern, because for a cut radius chosen to be larger than the core of the giant star, envelope material that should still contribute to the drag force on the companion is missing at close distances.
These arguments highlight the importance of choosing a cut radius that is as small as possible, but this implies high computational costs. Capturing parts of the core on the hydrodynamic grid requires fine spatial resolution and drastically reduces the CFL time-step. Therefore Rcut = 20 R⊙ was chosen in our reference model as a compromise. As can be seen from the top panel of Fig. 2, this choice may still be acceptable because the cut density structure starts to deviate rather slowly from the original model below Rcut = 20 R⊙; the difference between the profiles is just about 1% at R = 15 R⊙. Moreover, Rcut = 20 R⊙ is only very slightly above the bottom of the convective envelope (Fig. 1). As described in Sect. 2.1, the compression point and the location where the hydrogen mass fraction is X = 0.1 are not covered by our simulations. However, there is only little mass between these bifurcation points and the bottom of the convective envelope (≈0.3 M⊙) and the binding energy of this envelope part is negligible compared to the available orbital energy (Fig. 1b). It therefore appears that the outcome of our CE simulation might not be significantly affected by the inability to resolve the hydrogen envelope in our AREPO runs down to these points.
In order to asses convergence more quantitatively, we performed additional simulations applying Rcut = 10 R⊙ and Rcut = 40 R⊙ to the same RSG primary model combined with our NS-mass companion. The resulting evolution of the orbital separation between the cores and the unbound mass fraction according to the internal energy criterion is shown in Fig. 9. For all three cases, the mass ejection proceeds very similarly pointing to convergence in this quantity. The orbital evolution and the final separation between the cores in the model with Rcut = 40 R⊙ differ from the other two models, indicating that convergence is not reached when the core of the primary star is cut out at this radius in the convective part of the envelope. However, the models with lower Rcut agree well on the average orbital separation. This suggests that the evolution of the distance between the cores reaches an acceptable level of convergence for Rcut ≲ 20 R⊙. As the gravitational softening length is adaptively reduced when the cores approach each other, the approximate treatment of gravity inside it is not responsible for the large orbital separation after rapid plunge-in. However, the eccentricities show sudden changes in their temporal evolution and vary considerably. We find final eccentricities of about 0.06, 0.01, and 0.05 for Rcut = 10 R⊙, 20 R⊙, and 40 R⊙, respectively. Our models do not provide reliable results for this quantity. Moreover, the eccentricities change when the gravitational softening lengths around the cores are reduced with tightening orbits. This dependence on numerical parameters prevents a reliable determination of the physical eccentricities.
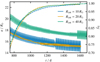 |
Fig. 9. Orbital evolution (solid lines) and mass ejection according to the internal energy criterion (dashed lines) for CE simulations with different Rcut in the primary star model. |
While completing this work, Lau et al. (2022) presented 3D SPH simulations of the CE phase in systems with a 12 M⊙ primary star and companions with masses typical for NSs and BHs. These are largely in agreement with our findings and support our interpretation.
6. Conclusions
We present simulations of CE interaction between a 9.4 M⊙ red supergiant primary star and companions of 1.4 M⊙ and 5 M⊙, typical for NSs and BHs, respectively. Our results demonstrate that the CE phase in the massive-star regime is accessible to 3D hydrodynamic simulations. This paves the way to studying the important yet uncertain CE phases in the progenitor evolution of compact object mergers observed in gravitational waves. Our findings can be summarised as follows.
-
Despite the challenging range of spatial scales, it is possible to represent the structure of a 9.4 M⊙ RSG star on the grid of the (magneto-)hydrodynamic code AREPO. This is achieved by replacing the inner core (i.e. roughly the region below the convective envelope) by a point mass. Its associated gravitational softening length is (linearly) resolved with at least 40 cells. The resulting stellar model is stable over at least five dynamic timescales.
-
We are able to follow the CE evolution with the NS-mass and BH-mass companions over 309 and 187 orbits, and find that at least 54% and 48% of the envelope is unbound, respectively. These fractions are still increasing when we terminate our simulations. Almost full envelope ejection would be achieved in the optimistic scenario where all remaining ionisation energy is released by the expanding envelope and can be used for unbinding the material.
-
At the end of our simulations, the final orbital separations are 15 R⊙ and 47 R⊙ in the NS and BH cases, respectively, and the orbits are still decaying at rates of 0.3 and 1.0 R⊙ yr−1. We observe a slowing of the orbital decay and expect this to come to a complete halt once the entire envelope is ejected and there are no longer any drag forces acting on the remnant binary. The 1.4 M⊙ companion spirals in deeper, releases more orbital energy, and the envelope unbinding proceeds faster than with the more massive 5 M⊙ companion.
-
Similar to the case of CE evolution with lower mass primary stars (Iaconi et al. 2017), the final orbital separations in our simulations are wider than expected in the sense that without further orbital evolution or perturbation, no GW-induced merger is possible for the considered systems in a Hubble time. Although simple energy arguments would suggest that complete envelope ejection requires a deeper inspiral, the drag force on the cores becomes so weak that the orbital decay rate drops by more than two orders of magnitude at the end of our simulations. During the plunge-in, the orbits shrink at rates of the order of 1 R⊙ d−1 while this rate is only 0.3 − 1.0 R⊙ yr−1 in the end.
-
Within the αCEλ-energy formalism of CE phases and assuming full envelope ejection, we find αCEλ = 1.17 and αCEλ = 1.32 in the case of a NS-mass and a BH-mass companion, respectively. Accounting for thermal and ionisation energies (i.e. αth = 1.0), we find λ = 1.91 from the relaxed AREPO model and therefore CE envelope-ejection efficiencies of αCE = 0.61 and αCE = 0.69 for the NS and BH companion, respectively. However, the energy formalism with the above-quoted parameters only reproduces our simulation outcomes if the core–envelope boundary is adjusted to our setup and one does not apply the usual X = 0.1 or maximum compression point.
-
Although numerical convergence is only indicated but not robustly demonstrated, the distances between the stellar cores and the companions measured at the end of our simulations provide reasonable estimates within our modelling assumptions. Taking these values as upper limits for the orbital separations in the post-CE systems, we discuss the likely future evolution and final fate as a possible gravitational-wave source. A mass-transfer phase from the left-over core of the supergiant onto the companion appears likely. The non-conservative mass-transfer episode widens (shrinks) the orbit in the case of the 5 M⊙ (1.4 M⊙) companion, and the ensuing supernova explosion of the RSG core will further affect the orbital configuration. The post-CE binary may be visible as an intermediate- and low-mass X-ray binary possibly evolving towards an ultra-stripped supernova.
-
Without NS kicks, the resulting NS–NS and NS–BH binaries have final orbits that are too wide to lead to compact-object mergers within a Hubble time unless the orbits after the CE phase are smaller by factors of > 4–7. Only with favourably aligned NS kicks that shrink the orbit and/or induce high eccentricities do the resulting NS–NS and NS–BH systems lead to gravitational-wave merger events in about 8.7% and 0.6% of cases in a Hubble time. These probabilities are larger by about a factor of two if the orbit is smaller by one-third immediately after the CE phase. Therefore, NS kicks actually enable gravitational-wave mergers in our case.
The most critical parameter determining the merger rate of the post-CE systems is the orbital separation. Although orbital decay slows down drastically after the initial plunge-in of the companion, the separation still decreases slightly when we terminate our simulations. The fact that the slope becomes progressively shallower suggests that orbital shrinkage will eventually come to an end. To assess this further and to determine the true final orbital separation, future simulations should strive to follow the evolution until envelope ejection is reached according to the kinetic energy criterion (as achieved for systems with a low-mass primary star by Ondratschek et al. 2022). At the same time, we are numerically and physically limited; for example, the eccentricities do not appear to have converged and radiation transport is important to better understand how much of the ionisation energy can indeed be used to help in ejecting the envelope. The accessibility of the massive-star regime for 3D hydrodynamic CE simulations demonstrated here should be exploited by extending the parameter space of studied systems to higher masses and different evolutionary stages.
Movies
Movie 1 associated with Fig. A.1 (movie-bh) Access here
Movie 2 associated with Fig. A.2 (movie-ns20) Access here
Acknowledgments
We thank the anonymous reviewer for carefully reading our manuscript and the useful suggestions that helped improve this work. MMM, FRNS, and FKR acknowledge support by the Klaus Tschira Foundation. This work has received funding from the European Research Council (ERC) under the European Union’s Horizon 2020 research and innovation programme (Grant agreement No. 945806). This work is supported by the Deutsche Forschungsgemeinschaft (DFG, German Research Foundation) under Germany’s Excellence Strategy EXC 2181/1-390900948 (the Heidelberg STRUCTURES Excellence Cluster).
References
- Abadie, J., Abbott, B. P., Abbott, R., et al. 2010, Class. Quant. Grav., 27 [Google Scholar]
- Abbott, B. P., Abbott, R., Abbott, T. D., et al. 2017, ApJ, 848, L12 [Google Scholar]
- Belczynski, K., Klencki, J., Fields, C. E., et al. 2020, A&A, 636, A104 [NASA ADS] [CrossRef] [EDP Sciences] [Google Scholar]
- Bodenheimer, P., & Taam, R. E. 1984, ApJ, 280, 771 [NASA ADS] [CrossRef] [Google Scholar]
- Brandt, N., & Podsiadlowski, P. 1995, MNRAS, 274, 461 [NASA ADS] [CrossRef] [Google Scholar]
- Chamandy, L., Frank, A., Blackman, E. G., et al. 2018, MNRAS, 480, 1898 [NASA ADS] [CrossRef] [Google Scholar]
- Chamandy, L., Blackman, E. G., Frank, A., et al. 2019, MNRAS, 490, 3727 [NASA ADS] [CrossRef] [Google Scholar]
- Clayton, M., Podsiadlowski, P., Ivanova, N., & Justham, S. 2017, MNRAS, 470, 1788 [NASA ADS] [CrossRef] [Google Scholar]
- Courant, R., Friedrichs, K. O., & Lewy, H. 1928, Math. Ann., 100, 32 [NASA ADS] [CrossRef] [Google Scholar]
- de Ruyter, S., van Winckel, H., Maas, T., et al. 2006, A&A, 448, 641 [NASA ADS] [CrossRef] [EDP Sciences] [Google Scholar]
- Dermine, T., Izzard, R. G., Jorissen, A., & Van Winckel, H. 2013, A&A, 551, A50 [NASA ADS] [CrossRef] [EDP Sciences] [Google Scholar]
- Dewi, J. D. M., & Pols, O. R. 2003, MNRAS, 344, 629 [NASA ADS] [CrossRef] [Google Scholar]
- Dewi, J. D. M., & Tauris, T. M. 2000, A&A, 360, 1043 [NASA ADS] [Google Scholar]
- Dewi, J. D. M., Pols, O. R., Savonije, G. J., & van den Heuvel, E. P. J. 2002, MNRAS, 331, 1027 [CrossRef] [Google Scholar]
- Dominik, M., Belczynski, K., Fryer, C., et al. 2012, ApJ, 759, 52 [Google Scholar]
- Eggleton, P. P. 1983, ApJ, 268, 368 [Google Scholar]
- Fragos, T., Andrews, J. J., Ramirez-Ruiz, E., et al. 2019, ApJ, 883, L45 [Google Scholar]
- Giacobbo, N., & Mapelli, M. 2018, MNRAS, 480, 2011 [Google Scholar]
- Götberg, Y., de Mink, S. E., Groh, J. H., et al. 2018, A&A, 615, A78 [NASA ADS] [CrossRef] [EDP Sciences] [Google Scholar]
- Götberg, Y., de Mink, S. E., Groh, J. H., Leitherer, C., & Norman, C. 2019, A&A, 629, A134 [NASA ADS] [CrossRef] [EDP Sciences] [Google Scholar]
- Götberg, Y., de Mink, S. E., McQuinn, M., et al. 2020, A&A, 634, A134 [EDP Sciences] [Google Scholar]
- Grichener, A., Sabach, E., & Soker, N. 2018, MNRAS, 478, 1818 [NASA ADS] [CrossRef] [Google Scholar]
- Harten, A., Lax, P. D., & Van Leer, B. 1983, SIAM Rev., 25, 35 [CrossRef] [Google Scholar]
- Hobbs, G., Lorimer, D. R., Lyne, A. G., & Kramer, M. 2005, MNRAS, 360, 974 [Google Scholar]
- Hurley, J. R., Tout, C. A., & Pols, O. R. 2002, MNRAS, 329, 897 [Google Scholar]
- Iaconi, R., Reichardt, T., Staff, J., et al. 2017, MNRAS, 464, 4028 [NASA ADS] [CrossRef] [Google Scholar]
- Ivanova, N. 2011, ApJ, 730, 76 [Google Scholar]
- Ivanova, N. 2018, ApJ, 858, L24 [NASA ADS] [CrossRef] [Google Scholar]
- Ivanova, N., & Nandez, J. L. A. 2016, MNRAS, 462, 362 [NASA ADS] [CrossRef] [Google Scholar]
- Ivanova, N., Belczynski, K., Kalogera, V., Rasio, F. A., & Taam, R. E. 2003, ApJ, 592, 475 [NASA ADS] [CrossRef] [Google Scholar]
- Ivanova, N., Justham, S., Chen, X., et al. 2013, A&ARv, 21, 59 [Google Scholar]
- Ivanova, N., Justham, S., & Podsiadlowski, P. 2015, MNRAS, 447, 2181 [Google Scholar]
- Janka, H.-T. 2017, ApJ, 837, 84 [Google Scholar]
- Jiang, L., Tauris, T. M., Chen, W.-C., & Fuller, J. 2021, ApJ, 920, L36 [NASA ADS] [CrossRef] [Google Scholar]
- Kramer, M., Schneider, F. R. N., Ohlmann, S. T., et al. 2020, A&A, 642, A97 [NASA ADS] [CrossRef] [EDP Sciences] [Google Scholar]
- Kruckow, M. U., Tauris, T. M., Langer, N., et al. 2016, A&A, 596, A58 [NASA ADS] [CrossRef] [EDP Sciences] [Google Scholar]
- Kruckow, M. U., Tauris, T. M., Langer, N., Kramer, M., & Izzard, R. G. 2018, MNRAS, 481, 1908 [CrossRef] [Google Scholar]
- Laplace, E., Götberg, Y., de Mink, S. E., Justham, S., & Farmer, R. 2020, A&A, 637, A6 [NASA ADS] [CrossRef] [EDP Sciences] [Google Scholar]
- Lau, M. Y. M., Hirai, R., González-Bolívar, M., et al. 2022, MNRAS, 512, 5462 [NASA ADS] [CrossRef] [Google Scholar]
- Law-Smith, J. A. P., Everson, R. W., Ramirez-Ruiz, E., et al. 2020, ApJ, submitted [arXiv:2011.06630] [Google Scholar]
- MacLeod, M., & Ramirez-Ruiz, E. 2015, ApJ, 798, L19 [Google Scholar]
- Mandel, I., & Broekgaarden, F. S. 2022, Living Rev. Relativ., 25, 1 [NASA ADS] [CrossRef] [Google Scholar]
- Mandel, I., Müller, B., Riley, J., et al. 2021, MNRAS, 500, 1380 [Google Scholar]
- Mapelli, M., & Giacobbo, N. 2018, MNRAS, 479, 4391 [NASA ADS] [CrossRef] [Google Scholar]
- Meyer, F., & Meyer-Hofmeister, E. 1979, A&A, 78, 167 [NASA ADS] [Google Scholar]
- Miyoshi, T., & Kusano, K. 2005, J. Comput. Phys., 208, 315 [NASA ADS] [CrossRef] [Google Scholar]
- Murguia-Berthier, A., MacLeod, M., Ramirez-Ruiz, E., Antoni, A., & Macias, P. 2017, ApJ, 845, 173 [NASA ADS] [CrossRef] [Google Scholar]
- Ohlmann, S. T., Röpke, F. K., Pakmor, R., & Springel, V. 2016a, ApJ, 816, L9 [Google Scholar]
- Ohlmann, S. T., Röpke, F. K., Pakmor, R., Springel, V., & Müller, E. 2016b, MNRAS, 462, L121 [NASA ADS] [CrossRef] [Google Scholar]
- Ohlmann, S. T., Röpke, F. K., Pakmor, R., & Springel, V. 2017, A&A, 599, A5 [NASA ADS] [CrossRef] [EDP Sciences] [Google Scholar]
- Ondratschek, P. A., Röpke, F. K., Schneider, F. R. N., et al. 2022, A&A, 660, L8 [NASA ADS] [CrossRef] [EDP Sciences] [Google Scholar]
- Ostriker, E. C. 1999, ApJ, 513, 252 [Google Scholar]
- Pakmor, R., & Springel, V. 2013, MNRAS, 432, 176 [NASA ADS] [CrossRef] [Google Scholar]
- Pakmor, R., Bauer, A., & Springel, V. 2011, MNRAS, 418, 1392 [NASA ADS] [CrossRef] [Google Scholar]
- Passy, J.-C., De Marco, O., Fryer, C. L., et al. 2012, ApJ, 744, 52 [NASA ADS] [CrossRef] [Google Scholar]
- Paxton, B., Bildsten, L., Dotter, A., et al. 2011, ApJS, 192, 3 [Google Scholar]
- Paxton, B., Cantiello, M., Arras, P., et al. 2013, ApJS, 208, 4 [Google Scholar]
- Paxton, B., Marchant, P., Schwab, J., et al. 2015, ApJS, 220, 15 [Google Scholar]
- Paxton, B., Schwab, J., Bauer, E. B., et al. 2018, ApJS, 234, 34 [NASA ADS] [CrossRef] [Google Scholar]
- Paxton, B., Smolec, R., Schwab, J., et al. 2019, ApJS, 243, 10 [Google Scholar]
- Peters, P. C. 1964, Phys. Rev., 136, B1224 [NASA ADS] [CrossRef] [Google Scholar]
- Pfahl, E., Rappaport, S., Podsiadlowski, P., & Spruit, H. 2002, ApJ, 574, 364 [Google Scholar]
- Planck Collaboration VI. 2020, A&A, 641, A6 [NASA ADS] [CrossRef] [EDP Sciences] [Google Scholar]
- Podsiadlowski, P., Rappaport, S., & Pfahl, E. D. 2002, ApJ, 565, 1107 [NASA ADS] [CrossRef] [Google Scholar]
- Podsiadlowski, P., Rappaport, S., & Han, Z. 2003, MNRAS, 341, 385 [NASA ADS] [CrossRef] [Google Scholar]
- Podsiadlowski, P., Langer, N., Poelarends, A. J. T., et al. 2004, ApJ, 612, 1044 [NASA ADS] [CrossRef] [Google Scholar]
- Postnov, K. A., & Yungelson, L. R. 2014, Liv. Rev. Relativ., 17, 3 [Google Scholar]
- Powell, K. G., Roe, P. L., Linde, T. J., Gombosi, T. I., & de Zeeuw, D. L. 1999, J. Comput. Phys., 154, 284 [NASA ADS] [CrossRef] [Google Scholar]
- Prust, L. J., & Chang, P. 2019, MNRAS, 486, 5809 [NASA ADS] [CrossRef] [Google Scholar]
- Reichardt, T. A., De Marco, O., Iaconi, R., Tout, C. A., & Price, D. J. 2019, MNRAS, 484, 631 [NASA ADS] [CrossRef] [Google Scholar]
- Reichardt, T. A., De Marco, O., Iaconi, R., Chamandy, L., & Price, D. J. 2020, MNRAS, 494, 5333 [NASA ADS] [CrossRef] [Google Scholar]
- Ricker, P. M., & Taam, R. E. 2012, ApJ, 746, 74 [Google Scholar]
- Ricker, P. M., Taam, R. E., Webbink, R. F., Timmes, F. X., & Holgado, A. M. 2019a, in American Astronomical Society Meeting Abstracts, 233, 348.11 [NASA ADS] [Google Scholar]
- Ricker, P. M., Timmes, F. X., Taam, R. E., & Webbink, R. F. 2019b, in IAU Symposium, eds. L. M. Oskinova, E. Bozzo, T. Bulik, & D. R. Gies, 346, 449 [NASA ADS] [Google Scholar]
- Rogers, F. J., & Nayfonov, A. 2002, ApJ, 576, 1064 [Google Scholar]
- Rogers, F. J., Swenson, F. J., & Iglesias, C. A. 1996, ApJ, 456, 902 [Google Scholar]
- Rosdahl, J., Katz, H., Blaizot, J., et al. 2018, MNRAS, 479, 994 [NASA ADS] [Google Scholar]
- Rusanov, V. V. 1961, J. Comput. Math. Phys. USSR, 1, 267 [Google Scholar]
- Sabach, E., Hillel, S., Schreier, R., & Soker, N. 2017, MNRAS, 472, 4361 [NASA ADS] [CrossRef] [Google Scholar]
- Sand, C., Ohlmann, S. T., Schneider, F. R. N., Pakmor, R., & Röpke, F. K. 2020, A&A, 644, A60 [NASA ADS] [CrossRef] [EDP Sciences] [Google Scholar]
- Sanyal, D., Langer, N., Szécsi, D. C., Yoon, S., & Grassitelli, L. 2017, A&A, 597, A71 [NASA ADS] [CrossRef] [EDP Sciences] [Google Scholar]
- Schneider, F. R. N., Podsiadlowski, P., & Müller, B. 2021, A&A, 645, A5 [NASA ADS] [CrossRef] [EDP Sciences] [Google Scholar]
- Shiber, S., Iaconi, R., De Marco, O., & Soker, N. 2019, MNRAS, 488, 5615 [NASA ADS] [CrossRef] [Google Scholar]
- Springel, V. 2010, MNRAS, 401, 791 [Google Scholar]
- Stevenson, S., Vigna-Gómez, A., Mandel, I., et al. 2017, Nat. Commun., 8, 14906 [Google Scholar]
- Sukhbold, T., Ertl, T., Woosley, S. E., Brown, J. M., & Janka, H.-T. 2016, ApJ, 821, 38 [Google Scholar]
- Suwa, Y., Yoshida, T., Shibata, M., Umeda, H., & Takahashi, K. 2015, MNRAS, 454, 3073 [NASA ADS] [CrossRef] [Google Scholar]
- Tauris, T. M. 1996, A&A, 315, 453 [NASA ADS] [Google Scholar]
- Tauris, T. M., & Dewi, J. D. M. 2001, A&A, 369, 170 [NASA ADS] [CrossRef] [EDP Sciences] [Google Scholar]
- Tauris, T. M., Langer, N., Moriya, T. J., et al. 2013, ApJ, 778, L23 [NASA ADS] [CrossRef] [Google Scholar]
- Tauris, T. M., Langer, N., & Podsiadlowski, P. 2015, MNRAS, 451, 2123 [NASA ADS] [CrossRef] [Google Scholar]
- Tauris, T. M., Kramer, M., Freire, P. C. C., et al. 2017, ApJ, 846, 170 [Google Scholar]
- Terman, J. L., Taam, R. E., & Hernquist, L. 1995, ApJ, 445, 367 [NASA ADS] [CrossRef] [Google Scholar]
- van Winckel, H., Lloyd Evans, T., Briquet, M., et al. 2009, A&A, 505, 1221 [NASA ADS] [CrossRef] [EDP Sciences] [Google Scholar]
- Vigna-Gómez, A., Neijssel, C. J., Stevenson, S., et al. 2018, MNRAS, 481, 4009 [Google Scholar]
- Vigna-Gómez, A., Wassink, M., Klencki, J., et al. 2022, MNRAS, 511, 2326 [CrossRef] [Google Scholar]
- Voss, R., & Tauris, T. M. 2003, MNRAS, 342, 1169 [Google Scholar]
- Webbink, R. F. 1984, ApJ, 277, 355 [NASA ADS] [CrossRef] [Google Scholar]
- Wilson, E. C., & Nordhaus, J. 2019, MNRAS, 485, 4492 [NASA ADS] [CrossRef] [Google Scholar]
- Wilson, E. C., & Nordhaus, J. 2020, MNRAS, 497, 1895 [NASA ADS] [CrossRef] [Google Scholar]
- Woosley, S. E. 2019, ApJ, 878, 49 [Google Scholar]
Appendix A: Movies of the CE simulations
Figures A.1 and A.2 illustrate the density evolution in the orbital plane for our two standard simulations with a BH-mass companion and a NS-mass companion, respectively.
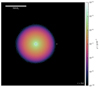 |
Fig. A.1. (Movie online) Movie of density evolution in the orbital plane for the simulation with a BH-mass companion (marked with a cross symbol; the centre of the primary star is marked with a plus symbol). We note that the apparent changes in orbital direction result from strobe effects. |
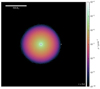 |
Fig. A.2. (Movie online) Same as Fig. A.1 but for the NS-mass companion. |
All Tables
Initial conditions of the CE simulations with the NS-like and BH-like companions.
Final configuration of the CE simulations with the NS-like and BH-like companions.
All Figures
|
Fig. 1. Chemical composition as a function of mass coordinate m (panel a) and envelope binding energy as a function of radius r (panel b) of the RSG primary star. In both panels, the grey shaded area indicates the convective envelope and the vertical dot-dashed black line is the location at which the hydrogen mass fraction X = 0.1. In panel b, the released orbital energy of inspiralling companions of 1.4 and 5.0 M⊙ are also shown (Eq. (2)) as well as the envelope binding energies as computed from the relaxed AREPO model (thick transparent lines at r ≥ 20 R⊙; the maximum deviation with respect to the MESA model is < 5%). |
| In the text | |
|
Fig. 2. Original MESA and mapped models of the primary star. Shown are (a) density, (b) Mach number and (c) relative deviation from HSE according to Eq. (3) as a function of radius (quantities are averages over spherical shells). The times t = 447 d and t = 895 d correspond to the end of the damping and the end of the relaxation step, respectively. At time t = 0 d, there are no velocities in the AREPO model yet, and this is why the Mach number in panel b cannot be seen. |
| In the text | |
|
Fig. 3. Density profiles of the original stellar model (‘MESA’) and after relaxation on AREPO grids with the indicated total number of cells, Ncells, and the number of cells per softening length, Ncps. Our default model is represented in blue. |
| In the text | |
|
Fig. 4. Simulation of CE interaction of a 10 M⊙ red giant primary star with a BH-mass companion (top row) and with a NS-mass companion (bottom row). Shown is the density in slices through the orbital plane at the times indicated in the panels. The core of the primary star is marked by a plus symbol and the cross symbol marks the position of the companion. The scale bar applies to all snapshots. |
| In the text | |
|
Fig. 5. Orbital evolution (solid line, left axis) and mass ejection according to the three energy criteria defined in Sect. 3.1 (dashed lines, right axis) in the simulation with a BH-mass companion. |
| In the text | |
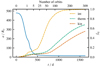 |
Fig. 6. Same as in Fig. 5 but for a NS-mass companion. |
| In the text | |
|
Fig. 7. Hypothetical orbital evolution of the remnant binary system. The ratio of present-day to initial orbital separation, a/ai, is plotted as a function of the mass of the remnant primary star, M1. Evolution is from right to left, that is, from high masses M1 to low masses. The initial companion masses are M2i = 1.4 M⊙ and 5.0 M⊙, and three different mass ejection fractions β are applied for each mass. |
| In the text | |
|
Fig. 8. Fraction of systems that merge within a Hubble time, fmerge, that remain bound after SN, fbound, and that are disrupted by the SN kick, fdisrupt, in six post-CE evolutionary scenarios of binaries with the 1.4 M⊙ and 5.0 M⊙ companions. The six scenarios are as follows: (i) no mass transfer after the CE and SN kicks; (ii) our default scenario of non-conservative (β = 1.0) mass transfer with final mass M1 = 2.0 M⊙ and SN kicks; (iii) same as the default scenario (ii) but with slower NS kicks from a Maxwellian with σkick = 50 km s−1; (iv) same as the default scenario but assuming an orbital separation after the CE that is smaller by one-third; (v) same as (iv) but with an orbital separation that is smaller by two-thirds; (vi) same as the default scenario but assuming a final mass of M1 = 1.6 M⊙. |
| In the text | |
|
Fig. 9. Orbital evolution (solid lines) and mass ejection according to the internal energy criterion (dashed lines) for CE simulations with different Rcut in the primary star model. |
| In the text | |
|
Fig. A.1. (Movie online) Movie of density evolution in the orbital plane for the simulation with a BH-mass companion (marked with a cross symbol; the centre of the primary star is marked with a plus symbol). We note that the apparent changes in orbital direction result from strobe effects. |
| In the text | |
|
Fig. A.2. (Movie online) Same as Fig. A.1 but for the NS-mass companion. |
| In the text | |
Current usage metrics show cumulative count of Article Views (full-text article views including HTML views, PDF and ePub downloads, according to the available data) and Abstracts Views on Vision4Press platform.
Data correspond to usage on the plateform after 2015. The current usage metrics is available 48-96 hours after online publication and is updated daily on week days.
Initial download of the metrics may take a while.