Fig. 4.
Download original image
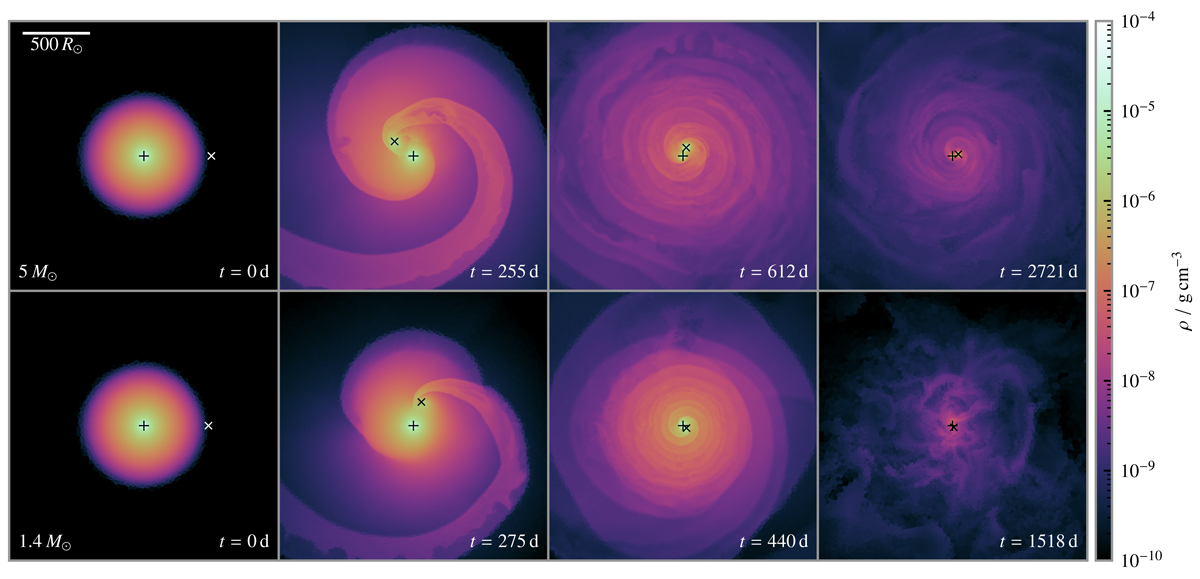
Simulation of CE interaction of a 10 M⊙ red giant primary star with a BH-mass companion (top row) and with a NS-mass companion (bottom row). Shown is the density in slices through the orbital plane at the times indicated in the panels. The core of the primary star is marked by a plus symbol and the cross symbol marks the position of the companion. The scale bar applies to all snapshots.
Current usage metrics show cumulative count of Article Views (full-text article views including HTML views, PDF and ePub downloads, according to the available data) and Abstracts Views on Vision4Press platform.
Data correspond to usage on the plateform after 2015. The current usage metrics is available 48-96 hours after online publication and is updated daily on week days.
Initial download of the metrics may take a while.