Fig. 2.
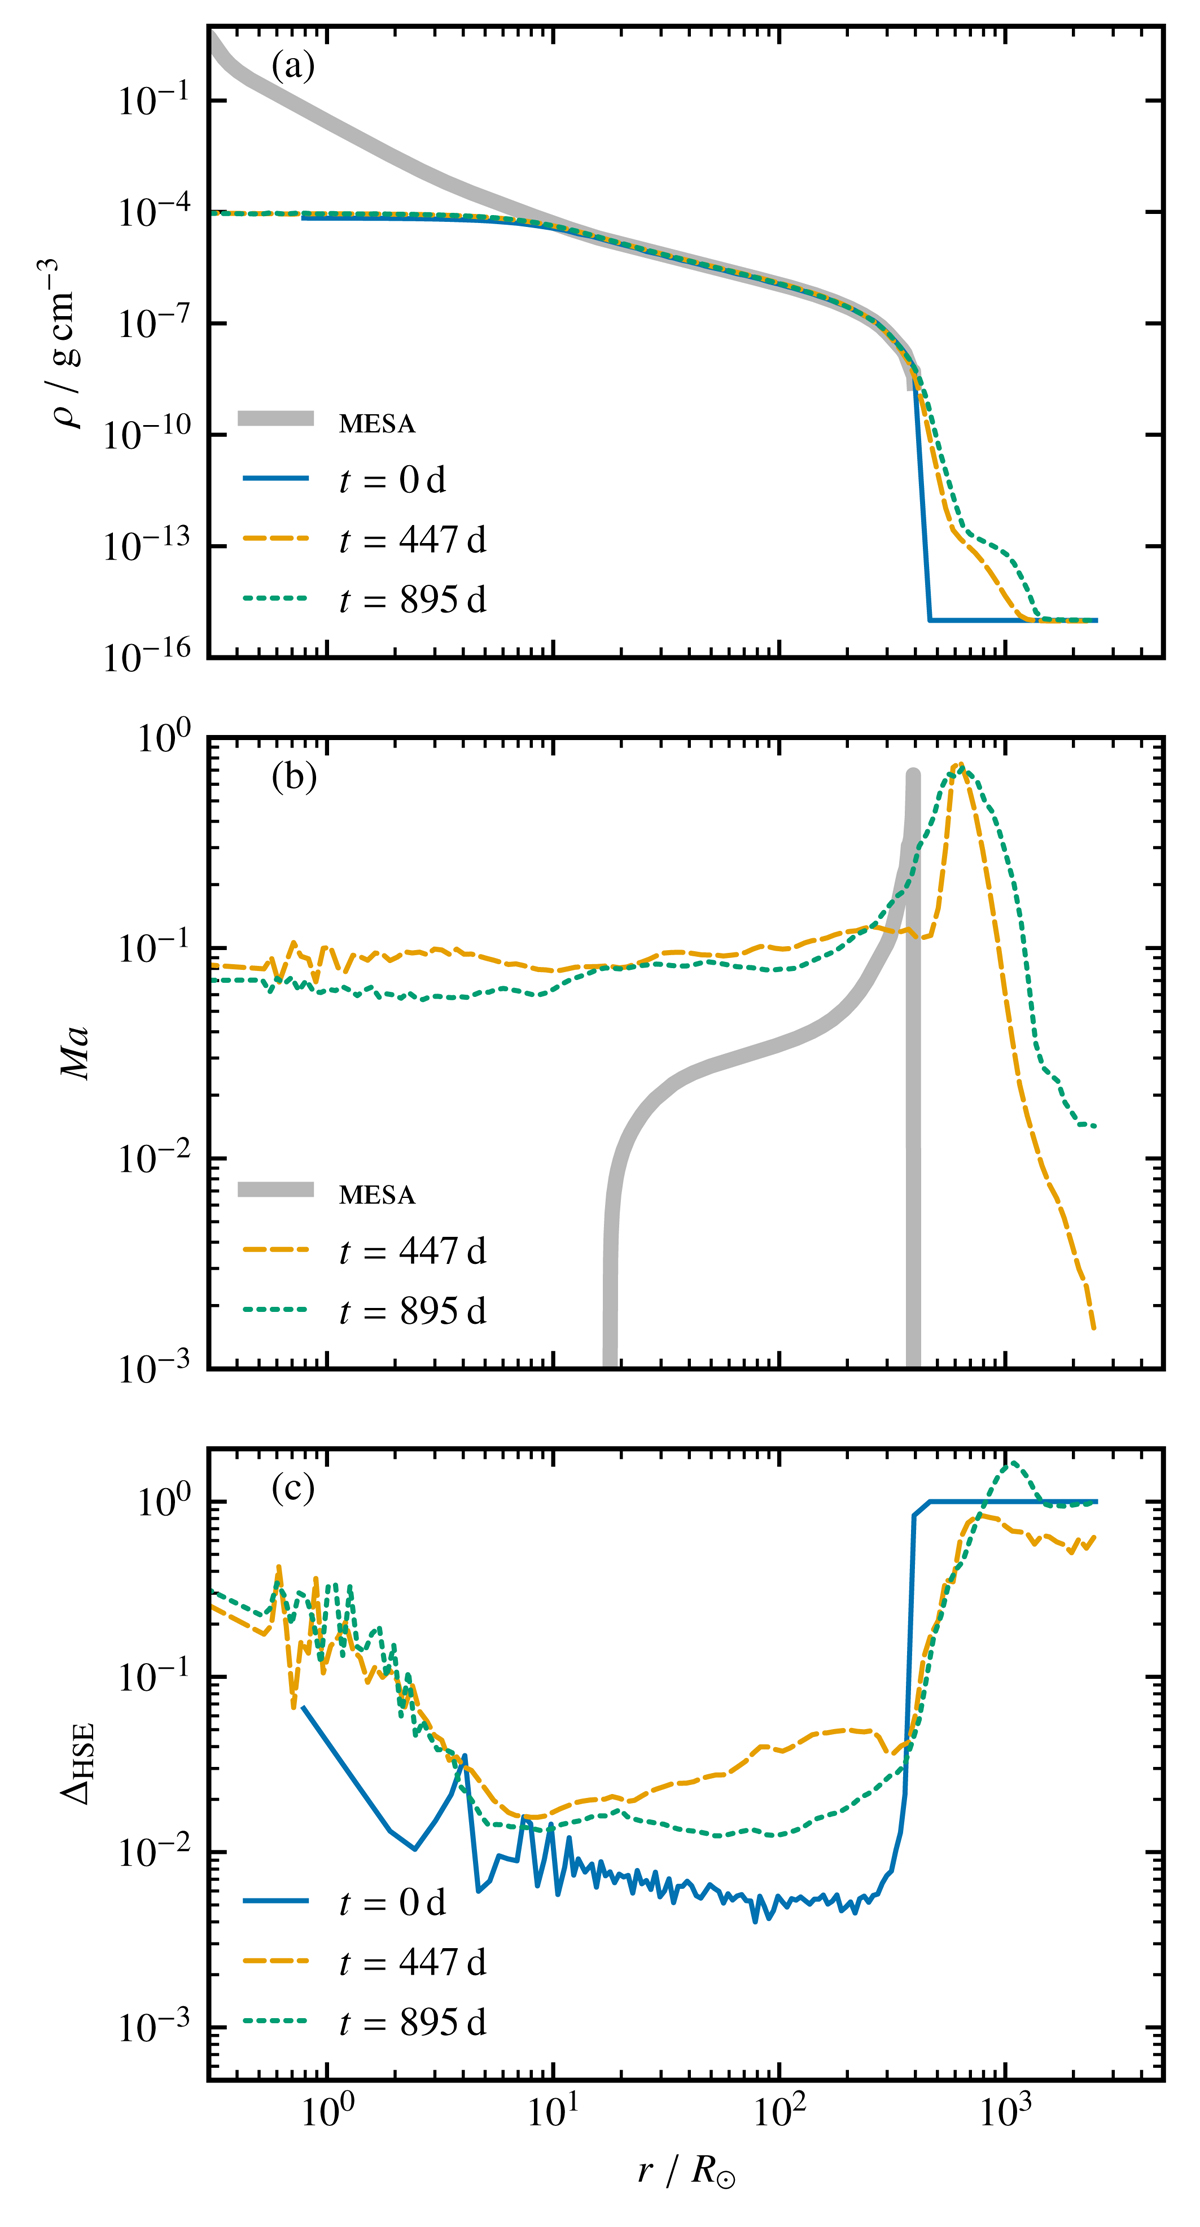
Download original image
Original MESA and mapped models of the primary star. Shown are (a) density, (b) Mach number and (c) relative deviation from HSE according to Eq. (3) as a function of radius (quantities are averages over spherical shells). The times t = 447 d and t = 895 d correspond to the end of the damping and the end of the relaxation step, respectively. At time t = 0 d, there are no velocities in the AREPO model yet, and this is why the Mach number in panel b cannot be seen.
Current usage metrics show cumulative count of Article Views (full-text article views including HTML views, PDF and ePub downloads, according to the available data) and Abstracts Views on Vision4Press platform.
Data correspond to usage on the plateform after 2015. The current usage metrics is available 48-96 hours after online publication and is updated daily on week days.
Initial download of the metrics may take a while.